About the VRIO Analysis Template
The VRIO analysis template is an intuitive tool that helps businesses and people determine their competitive potential. This analytical framework evaluates the capacity of organizational resources to provide a competitive advantage by focusing on four main components:
Value:
Meaning: Assesses if a resource or capability allows a firm to exploit an opportunity or neutralize a threat.
How to Use: List down all the firm's resources and capabilities and then determine which ones add real value regarding opportunities or threats.
Rarity:
Meaning: Measures the uniqueness or scarcity of a resource.
How to Use: Evaluate if the identified valuable resources are rare or common in the industry. If it's common, it might not provide a competitive edge.
Imitability:
Meaning: Determines how easily competitors can replicate or imitate the resource.
How to Use: Examine the resources that are both valuable and rare. For each, determine if competitors can easily imitate them. If they can't, it's a competitive advantage.
Organization:
Meaning: Evaluates if the firm is structured to capture value from its resources.
How to Use: Review the company's structure, culture, and processes to ensure that the resources that are valuable, rare, and inimitable are being utilized optimally.
By understanding and applying these areas in the template, businesses can ensure that their resources and capabilities are aligned to yield the maximum competitive advantage.
How to use the VRIO analysis template?
Edit with ease: With just a few clicks, one can easily change text, adjust components, or customize areas according to specific needs.
Expand and connect: Benefit from automated diagramming features. Add more sections, adjust sizes, or create connector lines effortlessly to expand the template's structure.
Add more context: Introduce any artifact to the board to provide additional context, be it images, documents, links, or any other relevant item.
Why should you use a VRIO analysis template?
Comprehensive analysis: It provides a structured way to evaluate resources and capabilities systematically.
Enhanced decision-making: By understanding strengths and weaknesses, businesses can make more informed strategic choices.
Quick visualization: Instead of a lengthy analysis, the chart provides a visual representation, making it easier to grasp and share.
Customization: The template can be tailored to fit the specific needs and nuances of any organization.
Consistent evaluation: Using the template ensures a uniform method of evaluating resources across various departments or periods.
Discover more competitive analysis examples that you can use now.
VRIO Analysis Template FAQs
What's the primary purpose of the VRIO analysis template?
The primary purpose is to help businesses and people determine their potential for a competitive advantage by analyzing their resources and capabilities.
Do I need any prior knowledge of VRIO to use the template?
No, the template is intuitive and designed to guide users through the analysis process, regardless of their familiarity with VRIO.
Can I customize the VRIO Analysis Template to suit my organization's branding?
Absolutely! The template is fully customizable, allowing you to adjust colors, fonts, and layouts to match your organization's branding.
Can other analytical tools be integrated with the VRIO analysis template?
Yes, the flexible nature of the template allows integration with other tools and analytical frameworks, enhancing its depth and applicability.

Miro
Your virtual workspace for innovation
Miro is an innovation workspace designed for teams of every size, everywhere, to dream, design, and build the future together. Our mission? To empower these teams to create the next big thing, powered by AI at every step of the way. Over 90 million users around the world rely on Miro to untangle complex ideas, put customer needs first, and deliver products and services faster. All supported by best-in-class security, compliance, and scalability.
Categories
Similar templates
Root Cause Analysis (RCA) Template
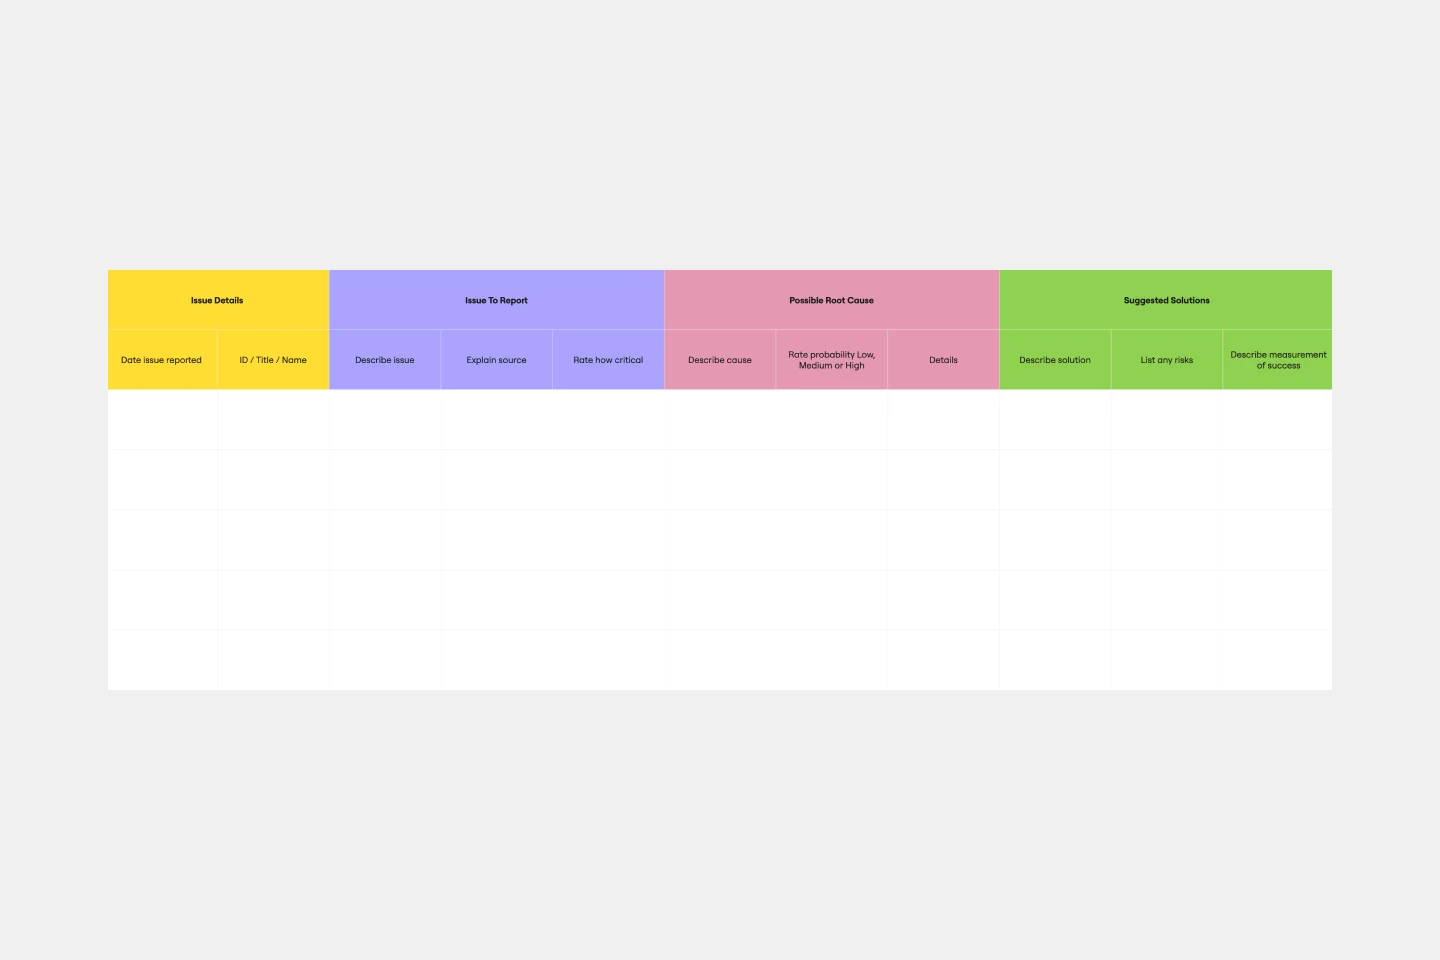
Root Cause Analysis (RCA) Template
The Root Cause Analysis (RCA) Template is a structured tool that helps teams uncover the underlying reasons behind specific problems or events. By pinpointing and addressing these root causes, rather than just treating the symptoms, organizations can foster long-term solutions and prevent recurring challenges, leading to more efficient and sustainable operations.
Fit Gap Analysis Template
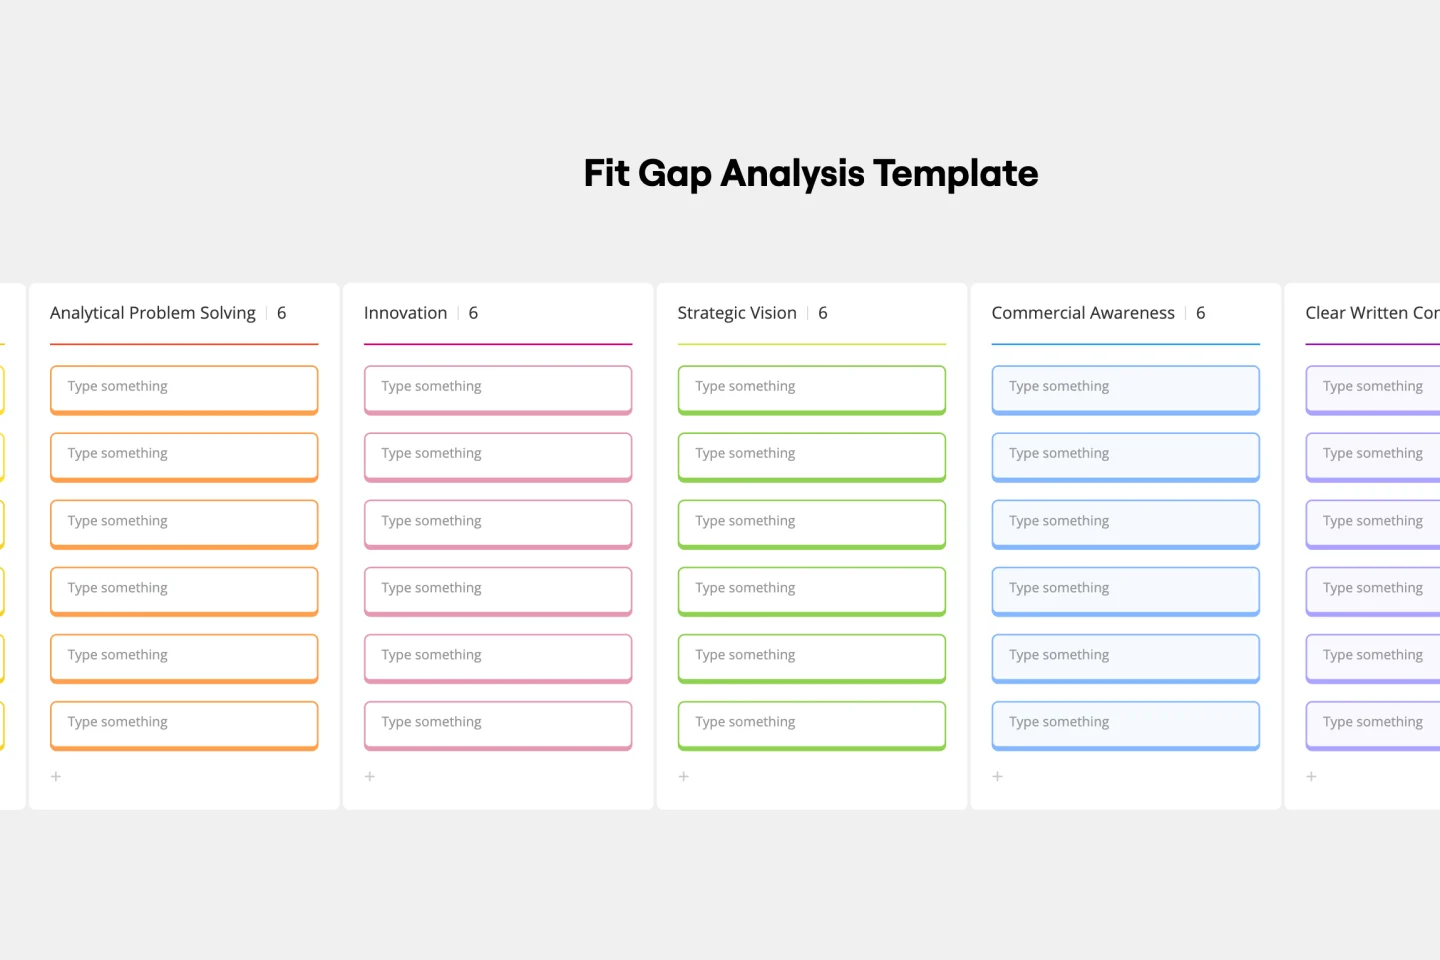
Fit Gap Analysis Template
The Fit Gap Analysis Template is a strategic tool designed to help teams and organizations identify discrepancies between their current state and desired outcomes. By visualizing these gaps, it offers a clear roadmap for improvement, allowing for a focused alignment of resources. One significant benefit of using this template is enhanced clarity; teams can visually discern where they currently stand and plot a precise path toward their goals, ensuring efficient decision-making and effective resource allocation.
SWOT Analysis
SWOT Analysis Template
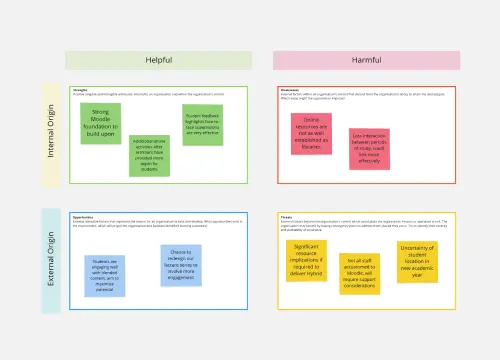
SWOT Analysis Template
When you’re developing a business strategy, it can be hard to figure out what to focus on. A SWOT analysis helps you hone in on key factors. SWOT stands for Strengths, Weaknesses, Opportunities, and Threats. Strengths and weaknesses are internal factors, like your employees, intellectual property, marketing strategy, and location. Opportunities and threats are usually external factors, like market fluctuations, competition, prices of raw materials, and consumer trends. Conduct a SWOT analysis whenever you want to explore opportunities for new businesses and products, decide the best way to launch a product, unlock your company’s potential, or use your strengths to develop opportunities.
Competitive Analysis Template
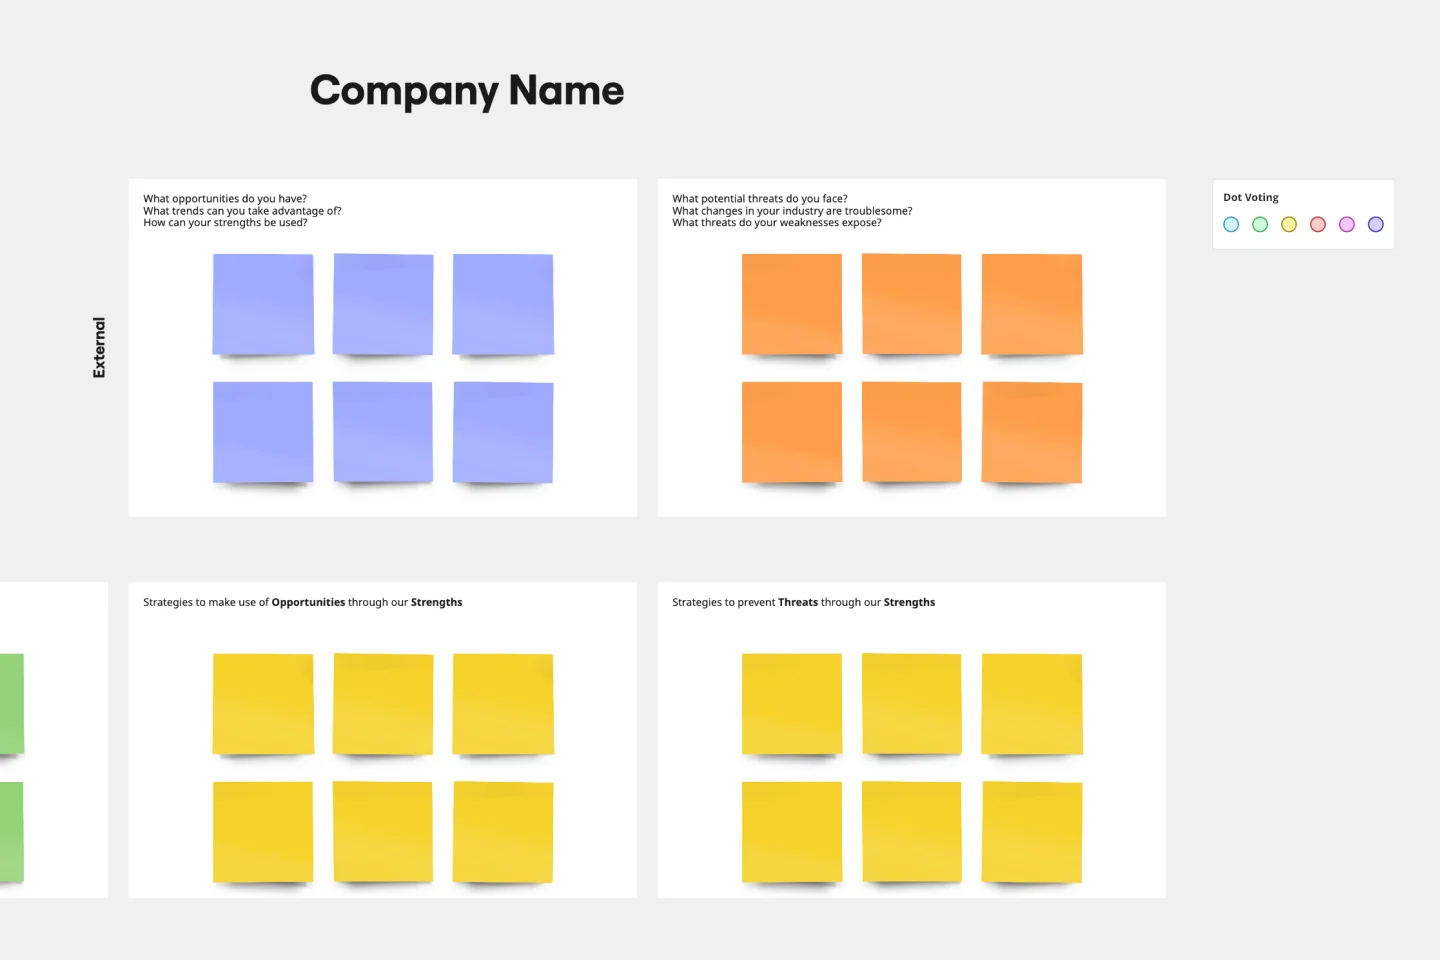
Competitive Analysis Template
Developing a great product starts with knowing the lay of the land (meaning who you’re up against) and answering a few questions: Who are your competitors? How does your product or service compare? What makes you stand out? A competitive analysis will help find the answers, which can ultimately shape your product, value prop, marketing, and sales strategies. It’s a great exercise when a big business event is about to occur — like a new product release or strategic planning session.
Cost-Benefit Analysis Template
Cost-Benefit Analysis Template
With so many day-to-day decisions to make—and each one feeling high-stakes—it’s easy for all the choices to weigh a business or organization down. You need a systematic way to analyze the risks and rewards. A cost benefit analysis gives you the clarity you need to make smart decisions. This template will let you conduct a CBA to help your team assess the pros and cons of new projects or business proposals—and ultimately help your company preserve your precious time, money, and social capital.
Root Cause Analysis (RCA) Template
Root Cause Analysis (RCA) Template
The Root Cause Analysis (RCA) Template is a structured tool that helps teams uncover the underlying reasons behind specific problems or events. By pinpointing and addressing these root causes, rather than just treating the symptoms, organizations can foster long-term solutions and prevent recurring challenges, leading to more efficient and sustainable operations.
Fit Gap Analysis Template
Fit Gap Analysis Template
The Fit Gap Analysis Template is a strategic tool designed to help teams and organizations identify discrepancies between their current state and desired outcomes. By visualizing these gaps, it offers a clear roadmap for improvement, allowing for a focused alignment of resources. One significant benefit of using this template is enhanced clarity; teams can visually discern where they currently stand and plot a precise path toward their goals, ensuring efficient decision-making and effective resource allocation.
SWOT Analysis
SWOT Analysis Template
SWOT Analysis Template
When you’re developing a business strategy, it can be hard to figure out what to focus on. A SWOT analysis helps you hone in on key factors. SWOT stands for Strengths, Weaknesses, Opportunities, and Threats. Strengths and weaknesses are internal factors, like your employees, intellectual property, marketing strategy, and location. Opportunities and threats are usually external factors, like market fluctuations, competition, prices of raw materials, and consumer trends. Conduct a SWOT analysis whenever you want to explore opportunities for new businesses and products, decide the best way to launch a product, unlock your company’s potential, or use your strengths to develop opportunities.
Competitive Analysis Template
Competitive Analysis Template
Developing a great product starts with knowing the lay of the land (meaning who you’re up against) and answering a few questions: Who are your competitors? How does your product or service compare? What makes you stand out? A competitive analysis will help find the answers, which can ultimately shape your product, value prop, marketing, and sales strategies. It’s a great exercise when a big business event is about to occur — like a new product release or strategic planning session.
Cost-Benefit Analysis Template
Cost-Benefit Analysis Template
With so many day-to-day decisions to make—and each one feeling high-stakes—it’s easy for all the choices to weigh a business or organization down. You need a systematic way to analyze the risks and rewards. A cost benefit analysis gives you the clarity you need to make smart decisions. This template will let you conduct a CBA to help your team assess the pros and cons of new projects or business proposals—and ultimately help your company preserve your precious time, money, and social capital.