About the Vertical Org Chart Template
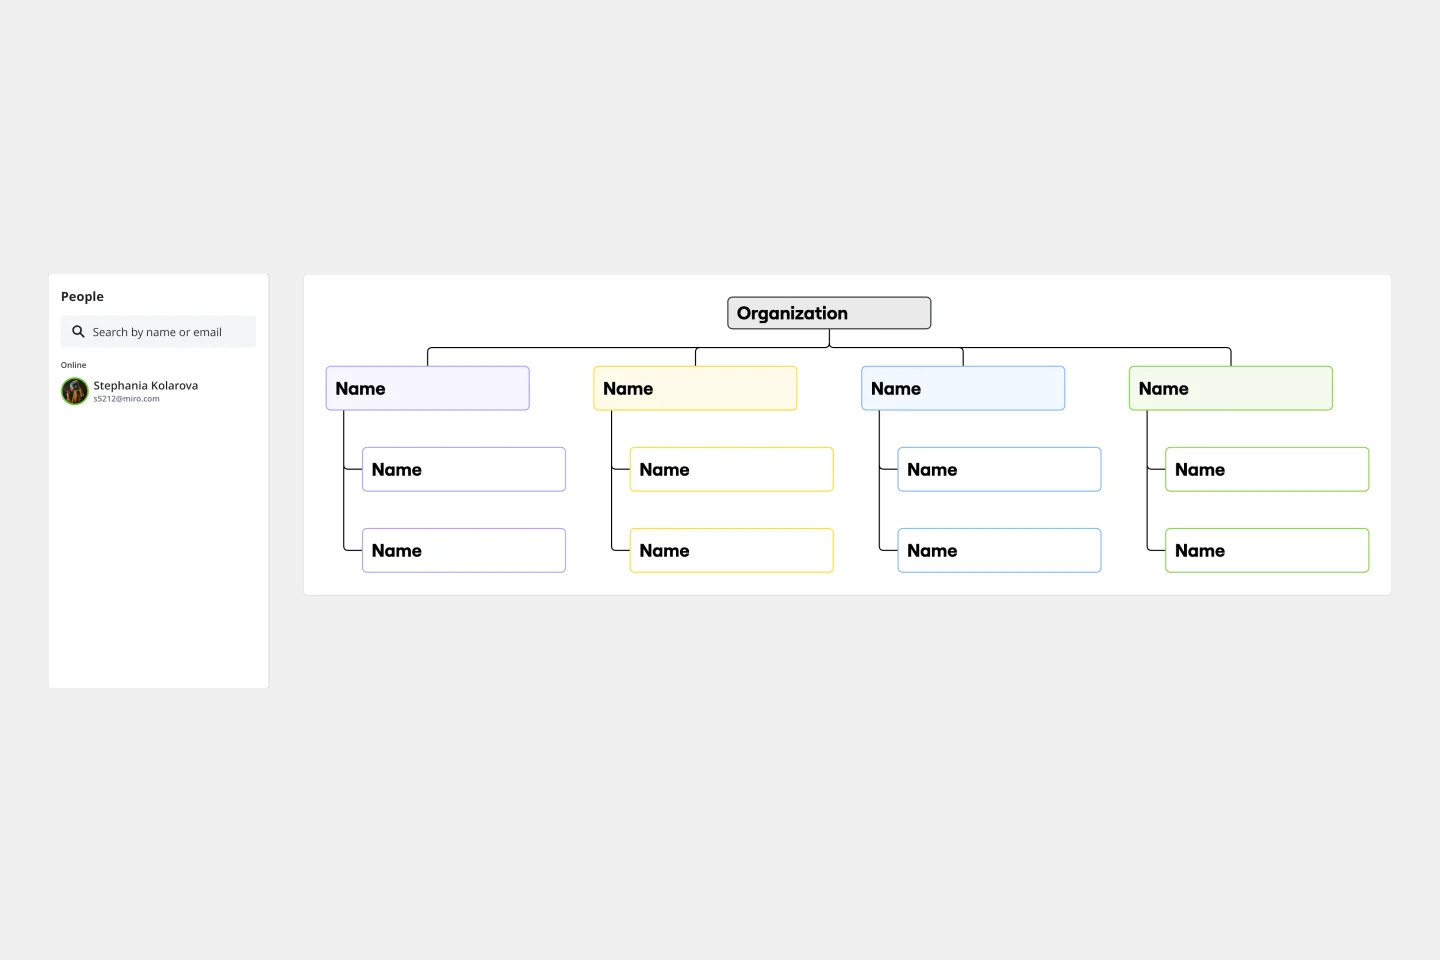
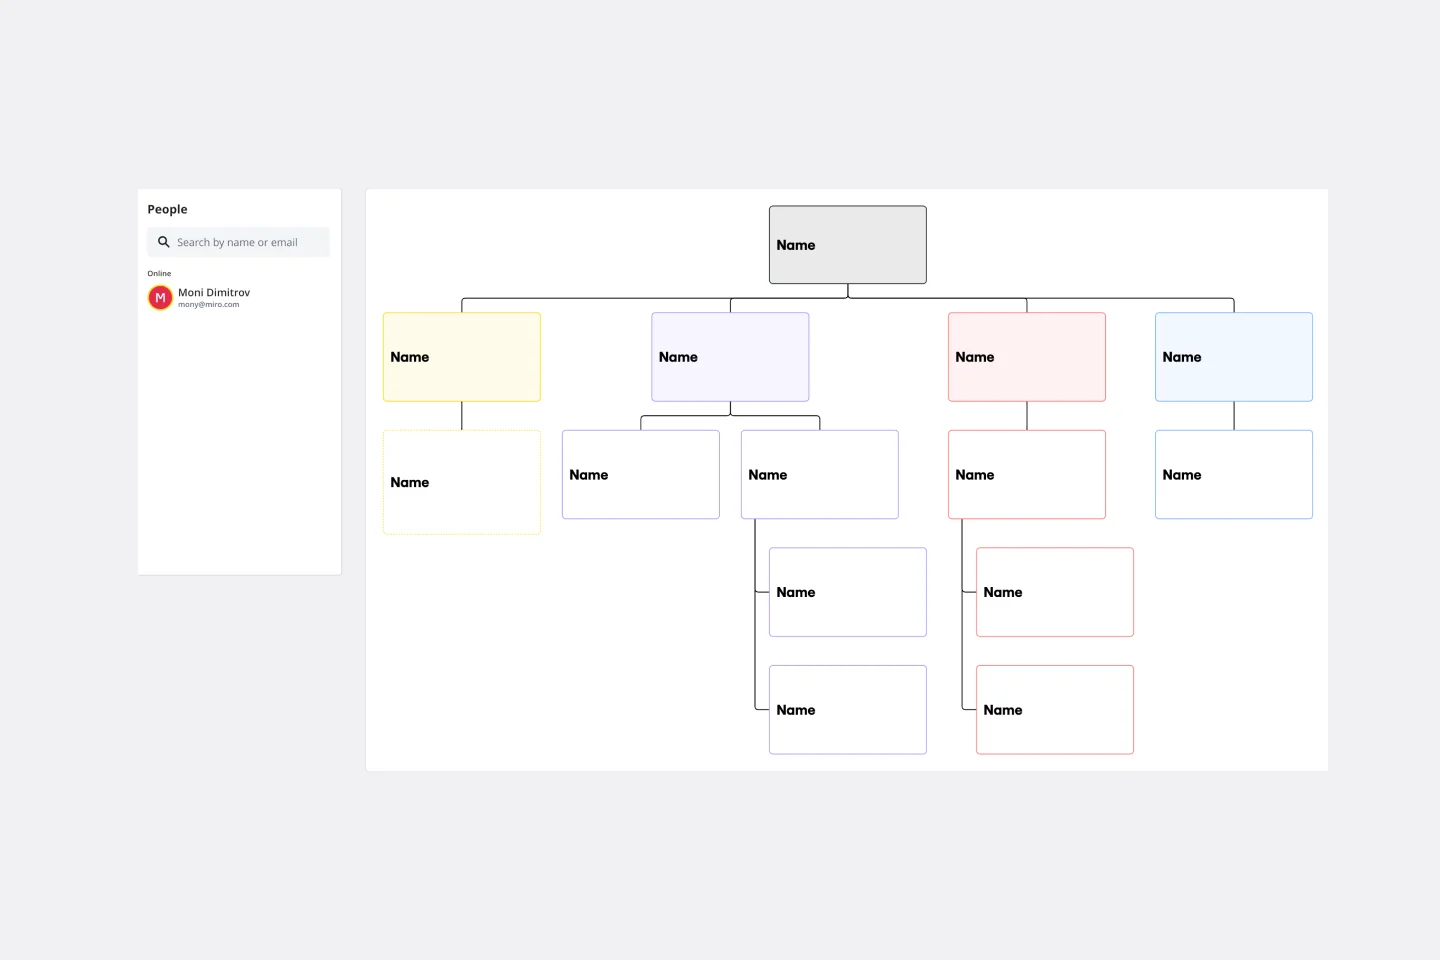
A well-defined organizational structure is crucial for effective communication and a clear understanding of roles and responsibilities within an entity. The Vertical Org Chart Template is a valuable tool that enables teams to visualize the hierarchical relationships and team dynamics in a top-down manner.
This template provides a structured representation of people and their roles within an organization, with the highest authority at the top and the hierarchy branching downwards. Each section of the template represents a tier of the hierarchy. By mapping out these relationships, one can easily understand the flow of responsibilities and communication channels within an organization.
How to use the vertical org chart template
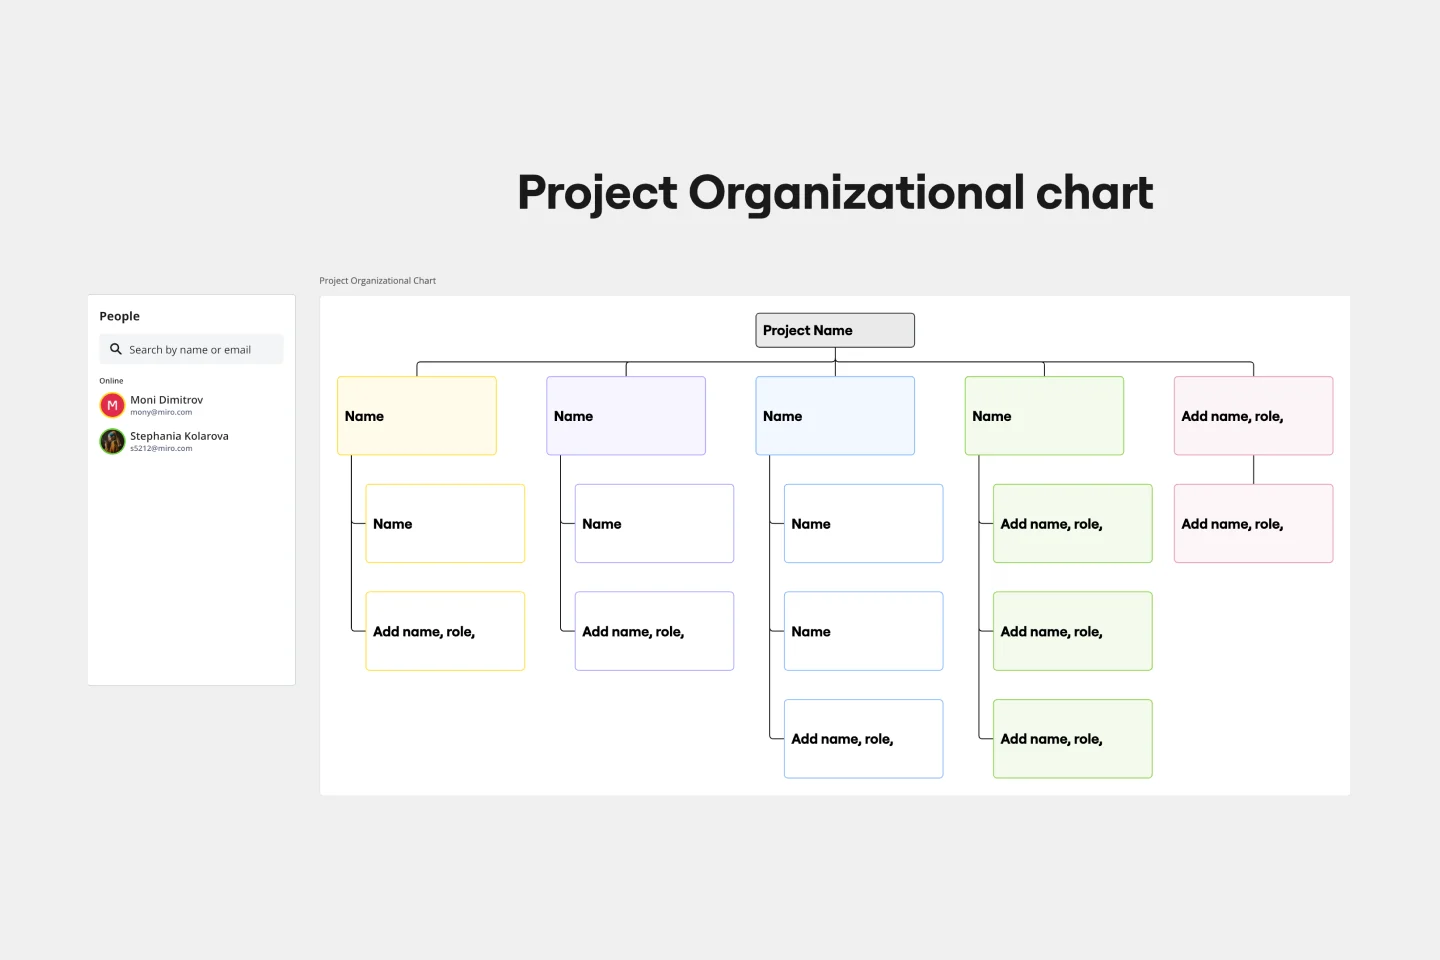
Add your data: Begin at the topmost tier, representing the highest authority, and work your way down. Fill in each section with the appropriate title or individual's name by double-clicking the shapes.
Customize with ease: Adjust the size, color, and design of each block to match your organization's branding or to differentiate between departments. Use the context-menu bar to edit your vertical org chart features.
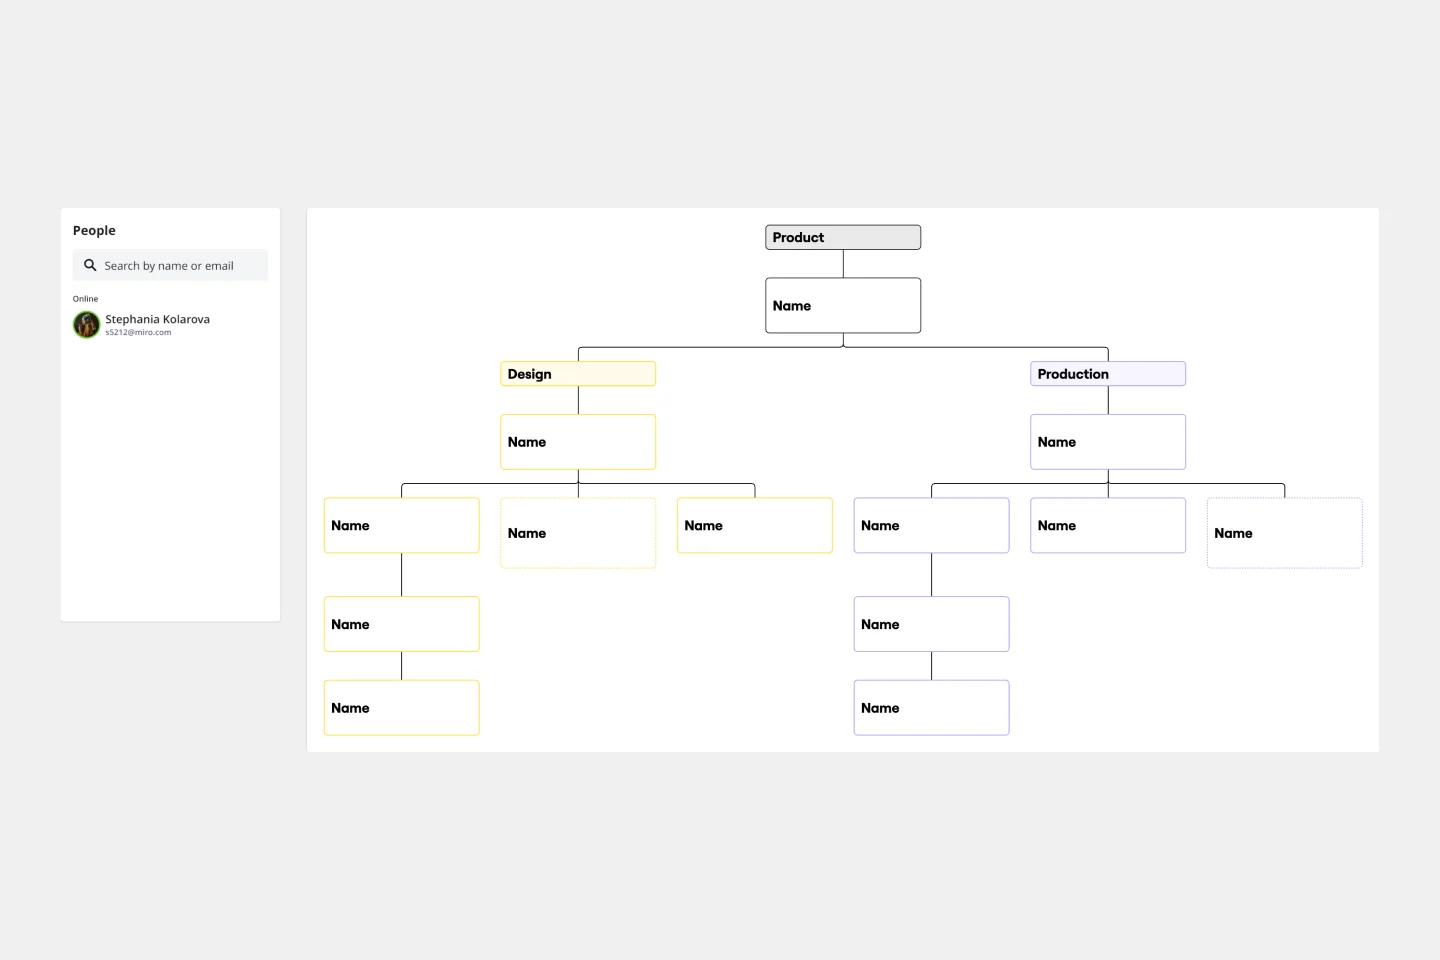
Expand as needed: Need to add more tiers or members? Use the automated diagramming features to add additional shapes and connector lines seamlessly.
Give more context: Beyond names and titles, you can attach any artifact to your chart, like photos, documents, or notes, to provide additional context.
Why should you use a vertical org chart template?
Visualizing the hierarchy of an organization can have several benefits, including clear communication, efficient onboarding, strategic planning, transparency, and enhanced collaboration.
Clear communication: By visualizing the hierarchy, organizations can ensure clear communication channels, reducing misunderstandings and potential conflicts.
Efficient onboarding: New members can quickly understand the organization's structure, facilitating faster integration and orientation.
Strategic planning: Decision-makers can use the chart to identify gaps, redundancies, or potential areas for expansion or consolidation.
Transparency: Employees gain clarity on reporting lines and understand their position within the broader organizational context.
Enhanced collaboration: Recognizing interconnected roles can foster collaboration between departments or teams, driving synergies and improved outcomes.
Miro is the perfect org chart creator to help visualize and understand your organization's hierarchical structure and reporting lines between roles. If you're interested in learning more about organizational charts you can read our in-depth guide.
Vertical Org Chart FAQs
Can the template be customized to fit large organizations?
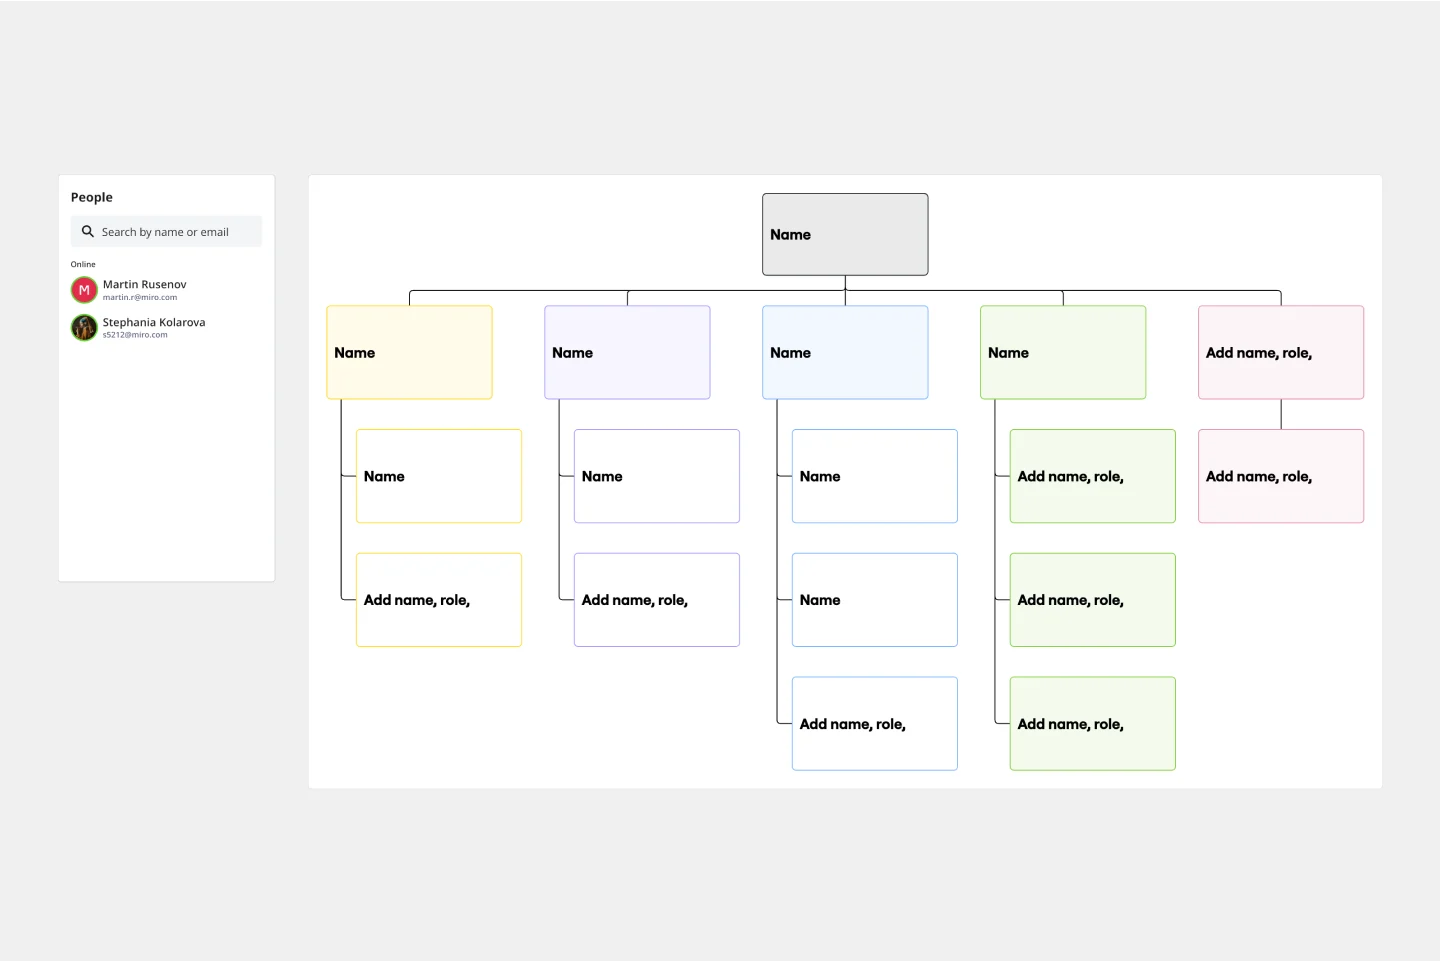
Absolutely. The template is scalable, allowing for the addition of more tiers and entities. The automated diagramming features ensure that expanding the template remains a smooth process.
Is it possible to link external documents or websites to the chart?
Yes. Artifacts, such as documents or URLs, can be attached to any part of the chart, offering a richer context and acting as a quick reference point.
How can I differentiate between departments or teams in the chart?
The template is highly customizable. You can change colors, shapes, and designs to demarcate different departments or teams, making the visualization more intuitive.
Can the Vertical Org Chart be shared and edited collaboratively?
Indeed. Like other templates, the Vertical Org Chart allows real-time collaboration, enabling teams to jointly input, edit, and finish the organizational structure.

Miro
Your virtual workspace for innovation
Miro is an innovation workspace designed for teams of every size, everywhere, to dream, design, and build the future together. Our mission? To empower these teams to create the next big thing, powered by AI at every step of the way. Over 90 million users around the world rely on Miro to untangle complex ideas, put customer needs first, and deliver products and services faster. All supported by best-in-class security, compliance, and scalability.
Categories
Similar templates
Flat Org Chart Template
Flat Org Chart Template
The flat org chart template provides a clear and visual representation of modern organizational structures that prioritize collaboration and horizontal relationships over complex hierarchical chains of command. One of the major advantages of using this template is that it promotes clarity and transparency, making it easy for organizations to showcase team configurations and ensure that all team members understand their roles in the larger context. This clarity fosters a more inclusive and collaborative environment, which aligns perfectly with contemporary organizational values. The template is a great tool for promoting effective communication and teamwork.
Matrix Org Chart
Matrix Org Chart
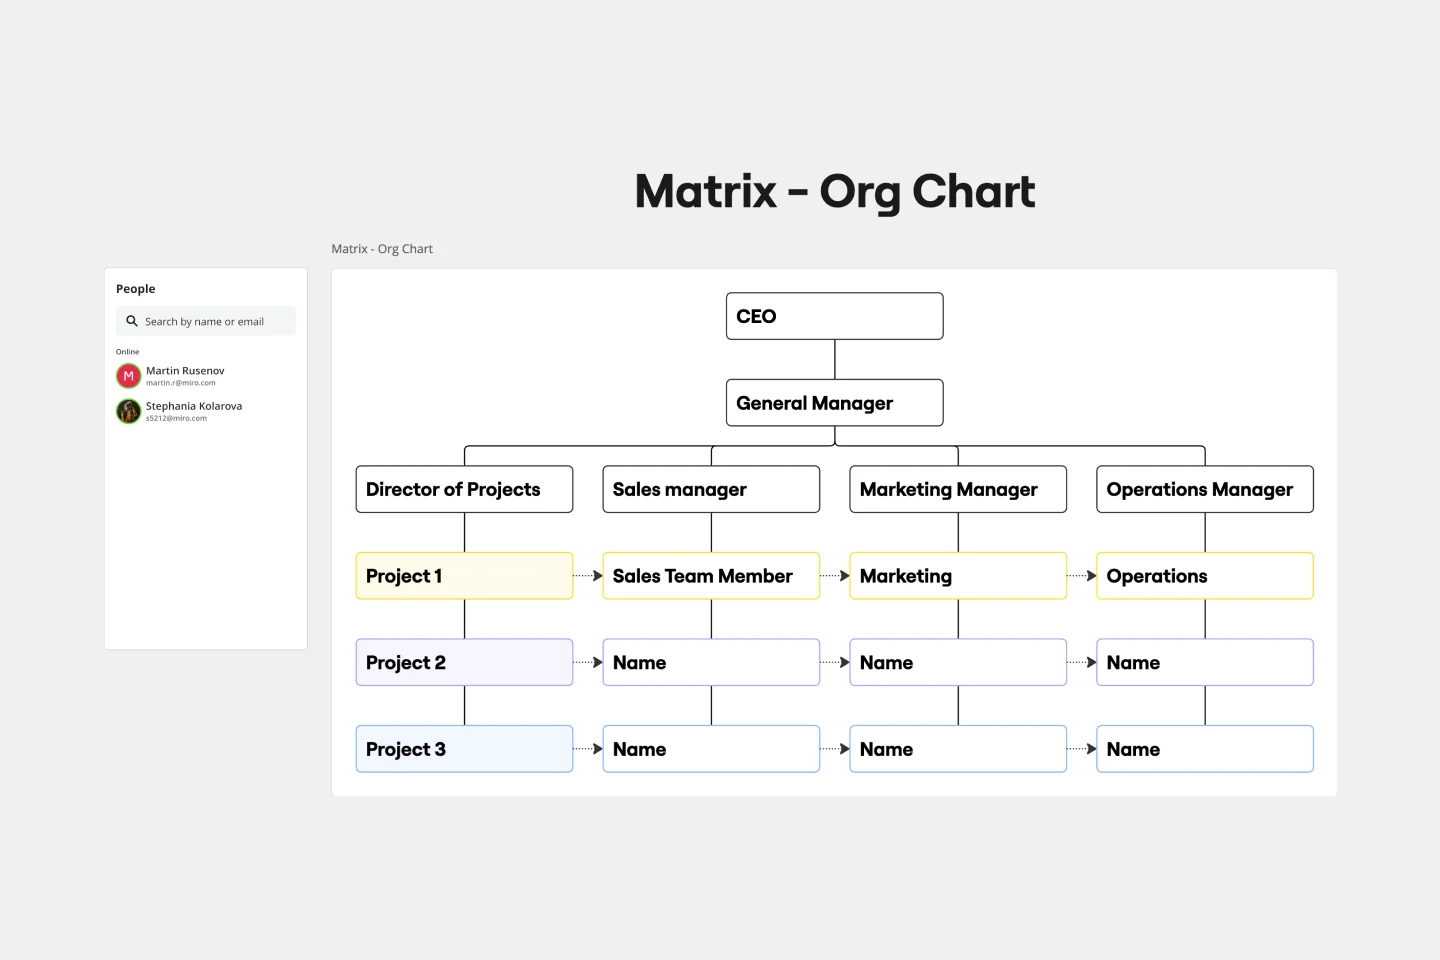
The matrix org chart template organizes teams efficiently and promotes effective communication. It is an essential tool for businesses that require complex decision-making capabilities and rapid response times. With this template, people can easily visualize their roles, responsibilities, and relationships within the organization, leading to improved alignment and performance.
Chain of Command Template
Chain of Command Template
The Chain of Command Template represents an organization's hierarchical structure, paving the way for enhanced clarity in roles and responsibilities. One of its standout benefits is the promotion of efficient communication. By clearly delineating the channels of authority and the reporting structure, team members can effortlessly identify the right people to approach with specific queries, concerns, or updates. This streamlined communication fosters better team collaboration and ensures that pivotal information reaches its intended destination promptly, driving overall organizational efficiency.
Accountability Chart Template
Accountability Chart Template
The Accountability Chart Template is a visual map detailing the various roles within an organization and the responsibilities tied to each. This systematic layout ensures clarity in defining duties and fosters a culture of accountability. A standout benefit of using this template is its capacity to eliminate role ambiguity. The Accountability Chart template ensures that every team member understands tasks by clearly depicting who is responsible for what. This leads to enhanced productivity and reduced task overlaps or missed assignments.
Company Organizational Chart
Company Organizational Chart
An org chart is a visual guide that sums up a company’s structure at a glance—who reports to whom and who manages what teams. But it does more than just display the chain of command. It also showcases the structure of different departments and informs employees who to reach out to with issues and concerns. That makes it an especially valuable tool for new hires who are getting familiar with the company. Our templates make it easy for you to add your entire team and customize the chart with colors and shapes.
Project Organizational Chart Template
Project Organizational Chart Template
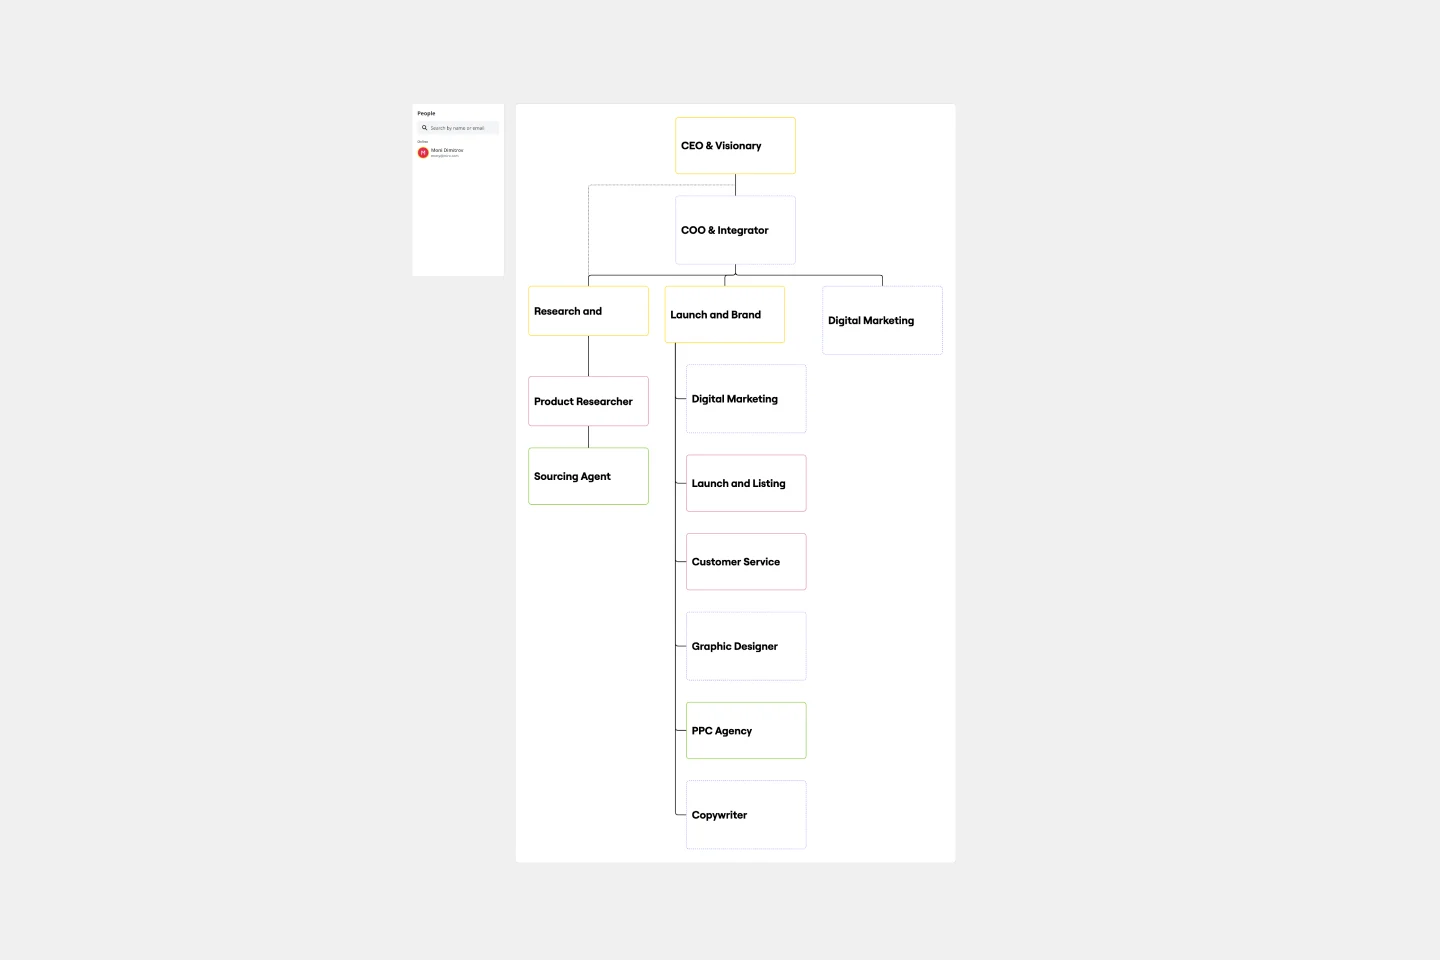
When you’re embarking on a long, complex project, you will inevitably hit roadblocks and obstacles. It’s important to have your project organizational chart on hand to overcome those challenges. A project organizational chart is a visual diagram that illustrates who is on your team and the role they play in a given project. It documents the structure of the project organization, the hierarchy between team members, and the relationships between employees. Project organizational charts are useful tools for clarifying who does what, securing buy-in, and setting expectations for the group.
Business Organizational Chart Template
Business Organizational Chart Template
Establishing hierarchy in a business can empower employees—to know their roles and responsibilities, team members, potential cross-functional collaborators, and who to turn to with a specific need. That’s just what a Business Organizational Chart does. And this template makes it simple to build a BOC for your company. The first step is to determine the high-level organizational structure of your company. Then it's easy to create a visual representation of how different employees are interconnected.
Organizational Chart Template
Organizational Chart Template
Who makes up the team? What roles do they play? Who does each member report to? An organizational chart, or org chart, can answer it all at a glance. Ideal for onboarding new employees, these visual diagrams plot out company structure and the chain of command to help your team members understand reporting relationships, their role, and how they fit into the broader organization. Our template lets you choose your own chart structure and easily plot the connections between employees, roles, and departments.
Flat Org Chart Template
Flat Org Chart Template
The flat org chart template provides a clear and visual representation of modern organizational structures that prioritize collaboration and horizontal relationships over complex hierarchical chains of command. One of the major advantages of using this template is that it promotes clarity and transparency, making it easy for organizations to showcase team configurations and ensure that all team members understand their roles in the larger context. This clarity fosters a more inclusive and collaborative environment, which aligns perfectly with contemporary organizational values. The template is a great tool for promoting effective communication and teamwork.
Matrix Org Chart
Matrix Org Chart
The matrix org chart template organizes teams efficiently and promotes effective communication. It is an essential tool for businesses that require complex decision-making capabilities and rapid response times. With this template, people can easily visualize their roles, responsibilities, and relationships within the organization, leading to improved alignment and performance.
Chain of Command Template
Chain of Command Template
The Chain of Command Template represents an organization's hierarchical structure, paving the way for enhanced clarity in roles and responsibilities. One of its standout benefits is the promotion of efficient communication. By clearly delineating the channels of authority and the reporting structure, team members can effortlessly identify the right people to approach with specific queries, concerns, or updates. This streamlined communication fosters better team collaboration and ensures that pivotal information reaches its intended destination promptly, driving overall organizational efficiency.
Accountability Chart Template
Accountability Chart Template
The Accountability Chart Template is a visual map detailing the various roles within an organization and the responsibilities tied to each. This systematic layout ensures clarity in defining duties and fosters a culture of accountability. A standout benefit of using this template is its capacity to eliminate role ambiguity. The Accountability Chart template ensures that every team member understands tasks by clearly depicting who is responsible for what. This leads to enhanced productivity and reduced task overlaps or missed assignments.
Company Organizational Chart
Company Organizational Chart
An org chart is a visual guide that sums up a company’s structure at a glance—who reports to whom and who manages what teams. But it does more than just display the chain of command. It also showcases the structure of different departments and informs employees who to reach out to with issues and concerns. That makes it an especially valuable tool for new hires who are getting familiar with the company. Our templates make it easy for you to add your entire team and customize the chart with colors and shapes.
Project Organizational Chart Template
Project Organizational Chart Template
When you’re embarking on a long, complex project, you will inevitably hit roadblocks and obstacles. It’s important to have your project organizational chart on hand to overcome those challenges. A project organizational chart is a visual diagram that illustrates who is on your team and the role they play in a given project. It documents the structure of the project organization, the hierarchy between team members, and the relationships between employees. Project organizational charts are useful tools for clarifying who does what, securing buy-in, and setting expectations for the group.
Business Organizational Chart Template
Business Organizational Chart Template
Establishing hierarchy in a business can empower employees—to know their roles and responsibilities, team members, potential cross-functional collaborators, and who to turn to with a specific need. That’s just what a Business Organizational Chart does. And this template makes it simple to build a BOC for your company. The first step is to determine the high-level organizational structure of your company. Then it's easy to create a visual representation of how different employees are interconnected.
Organizational Chart Template
Organizational Chart Template
Who makes up the team? What roles do they play? Who does each member report to? An organizational chart, or org chart, can answer it all at a glance. Ideal for onboarding new employees, these visual diagrams plot out company structure and the chain of command to help your team members understand reporting relationships, their role, and how they fit into the broader organization. Our template lets you choose your own chart structure and easily plot the connections between employees, roles, and departments.