
Venn Diagram for Marketing Analysis
A Venn diagram is a graphical representation that shows similarities and differences between items, concepts or data.
They utilize shapes, often circles, to illustrate relationships and compare data. Venn diagrams are certainly one of the most well-known types of diagrams. This design, featuring a series of simple circles or ellipses or rectangles that overlap is ubiquitous. The overlapping region of a Venn diagram indicates similarities while others showcase differences. Although the Venn diagram was created to describe mathematically logical relationships, it’s now used to show all types of relationships.
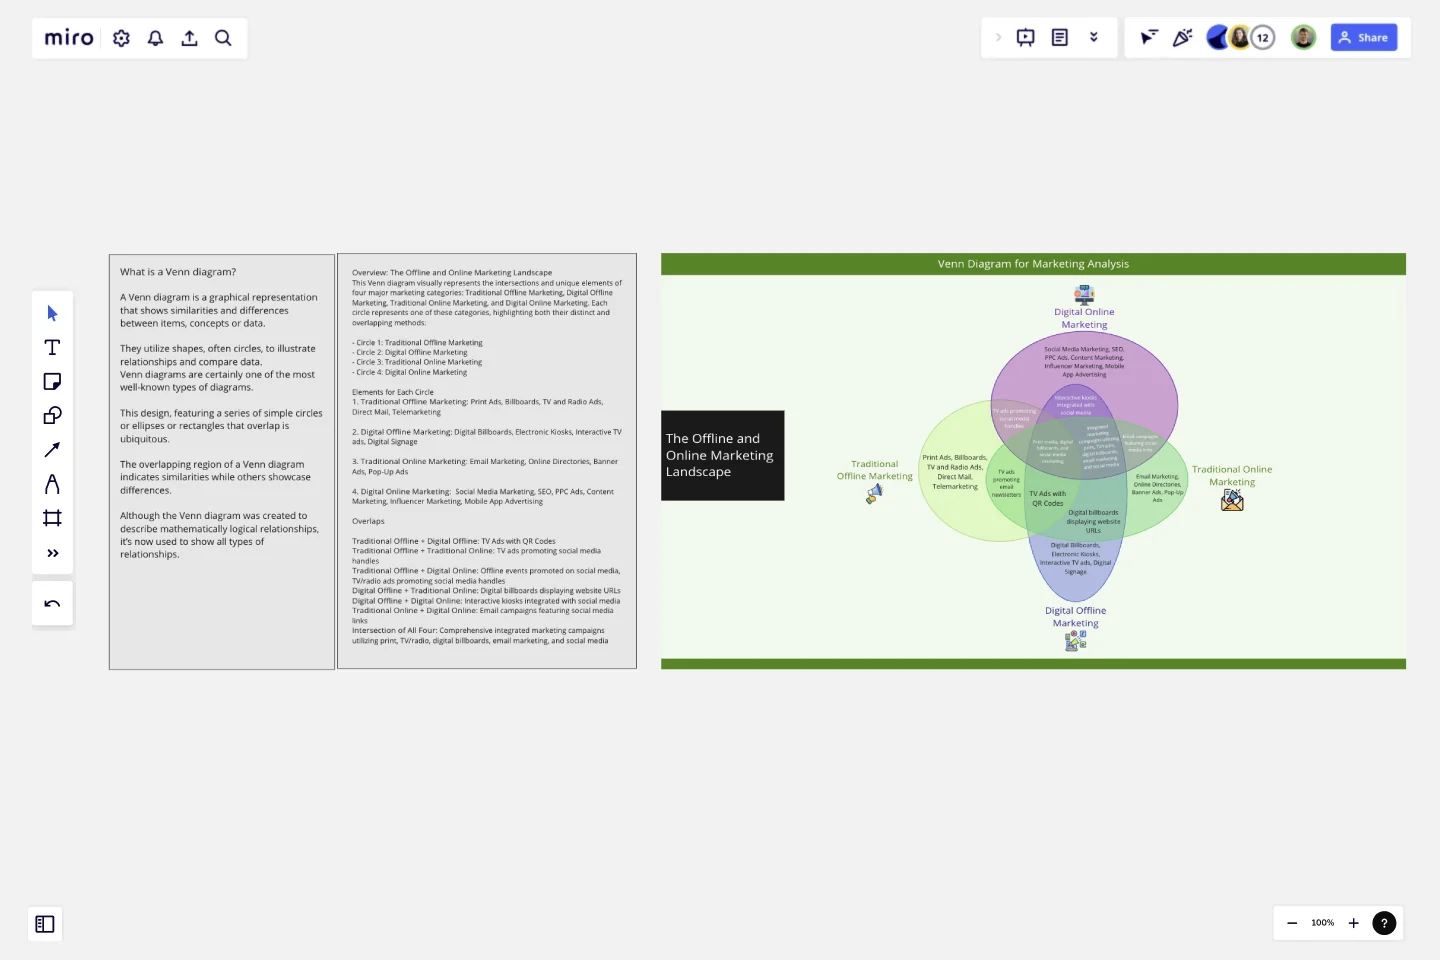
Overview: The Offline and Online Marketing Landscape
This Venn diagram visually represents the intersections and unique elements of four major marketing categories: Traditional Offline Marketing, Digital Offline Marketing, Traditional Online Marketing, and Digital Online Marketing. Each circle represents one of these categories, highlighting both their distinct and overlapping methods:
- Circle 1: Traditional Offline Marketing
- Circle 2: Digital Offline Marketing
- Circle 3: Traditional Online Marketing
- Circle 4: Digital Online MarketingElements for Each Circle
1. Traditional Offline Marketing: Print Ads, Billboards, TV and Radio Ads, Direct Mail, Telemarketing
2. Digital Offline Marketing: Digital Billboards, Electronic Kiosks, Interactive TV ads, Digital Signage
3. Traditional Online Marketing: Email Marketing, Online Directories, Banner Ads, Pop-Up Ads
4. Digital Online Marketing: Social Media Marketing, SEO, PPC Ads, Content Marketing, Influencer Marketing, Mobile App Advertising
Overlaps
Traditional Offline + Digital Offline: TV Ads with QR Codes
Traditional Offline + Traditional Online: TV ads promoting social media handles
Traditional Offline + Digital Online: Offline events promoted on social media, TV/radio ads promoting social media handles
Digital Offline + Traditional Online: Digital billboards displaying website URLs
Digital Offline + Digital Online: Interactive kiosks integrated with social media
Traditional Online + Digital Online: Email campaigns featuring social media links
Intersection of All Four: Comprehensive integrated marketing campaigns utilizing print, TV/radio, digital billboards, email marketing, and social media.
Above elaborated marketing analysis venn-diagram will help you understand its application to your problem statement.
This template was created by Khawaja Rizwan.
Get started with this template right now.
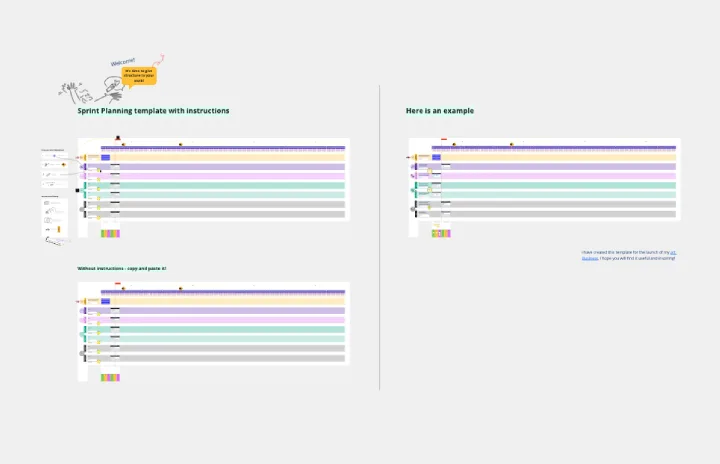
Sprint Planning by Piera Mattioli
Works best for:
Planning, Strategy
Sprint Planning Template helps you organize and plan your sprints effectively. It allows you to set goals, allocate tasks, and track progress, ensuring your team stays focused and meets sprint objectives. Perfect for agile teams.
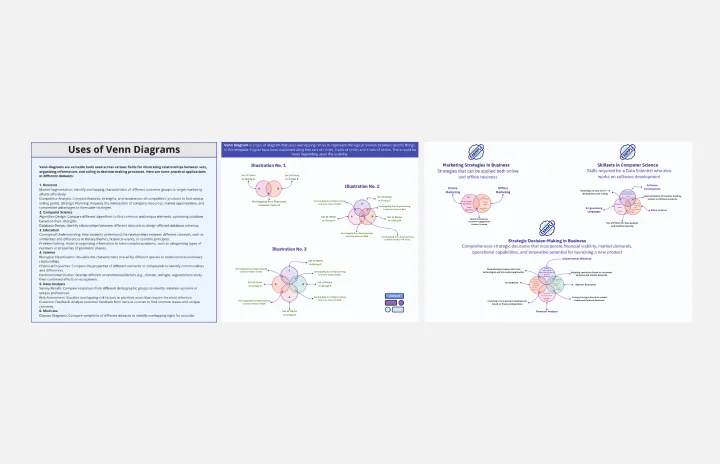
Venn Diagram Practical Applications
Works best for:
Venn Diagram
The Venn Diagram for Practical Applications template helps you apply Venn diagrams to real-world scenarios. Use this template to solve problems, identify relationships, and make decisions based on clear visual analysis. It's perfect for practical tasks such as project planning, resource allocation, and strategic decision-making. This tool is ideal for business professionals, educators, and anyone looking to apply theoretical concepts to practical situations.
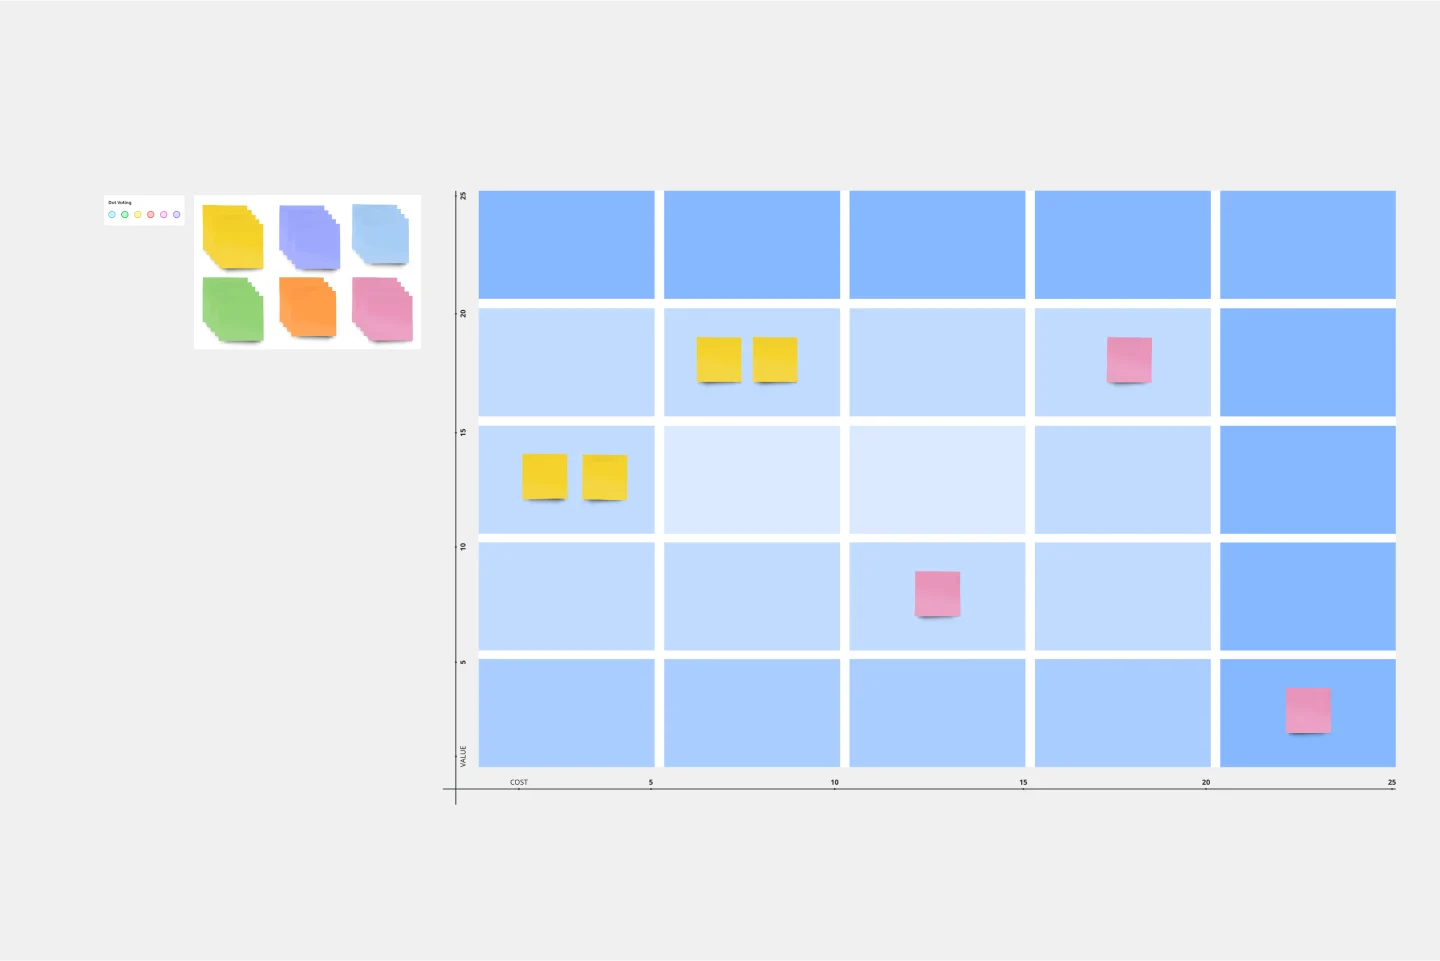
Bang for the Buck Template
Works best for:
Project Management, Strategic Planning, Prioritization
The name pretty much says it—this Agile framework is all about helping you maximize efficiency by powering collaboration between product managers and dev teams. Together you can go over each to-do on the project agenda and evaluate them in terms of costs and benefits. That way you can prioritize tasks based on how much bang for your buck they deliver. This template is great for teams and organizations that want to make a strategic plan to tackle an upcoming sprint.
Crazy Eights Template
Works best for:
Design Thinking, Brainstorming, Ideation
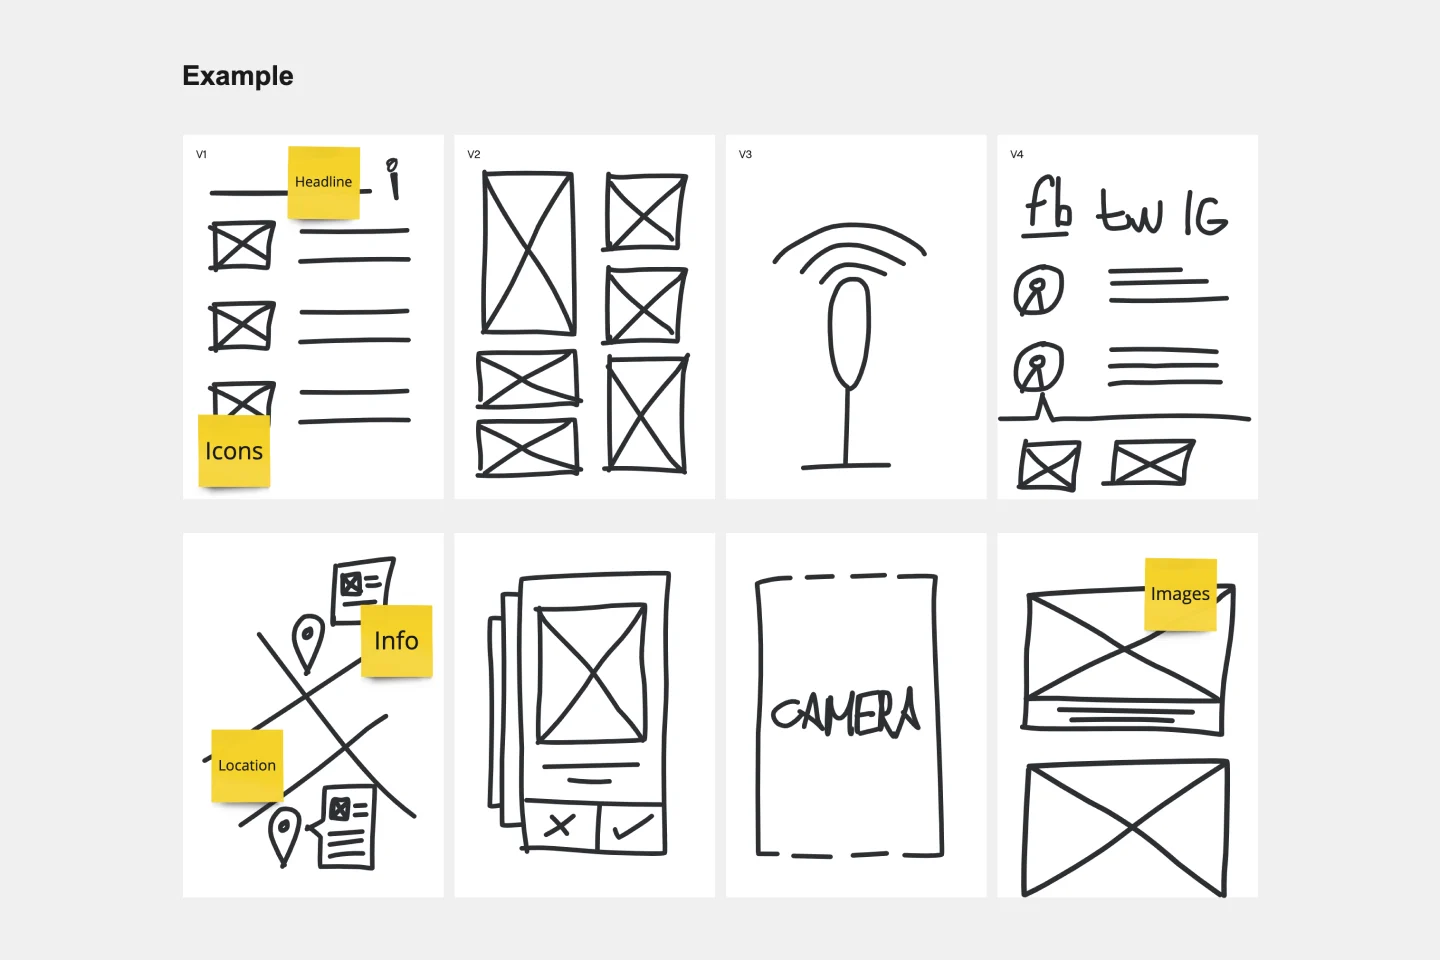
Sometimes you just need to get the team’s creative juices flowing for a brainstorm—and get them thinking of as many ideas as they can, as fast as they can. Crazy Eights will do it in a hurry. Favoring quantity over quality, this sketch brainstorming exercise challenges them to come up with eight ideas in eight minutes, which leaves no time to second guess ideas. It’s perfect for early stages of development, and it’s a team favorite for being fast paced and fun.
3x3 Prioritization Method Template
Works best for:
Operations, Prioritization, Strategic Planning
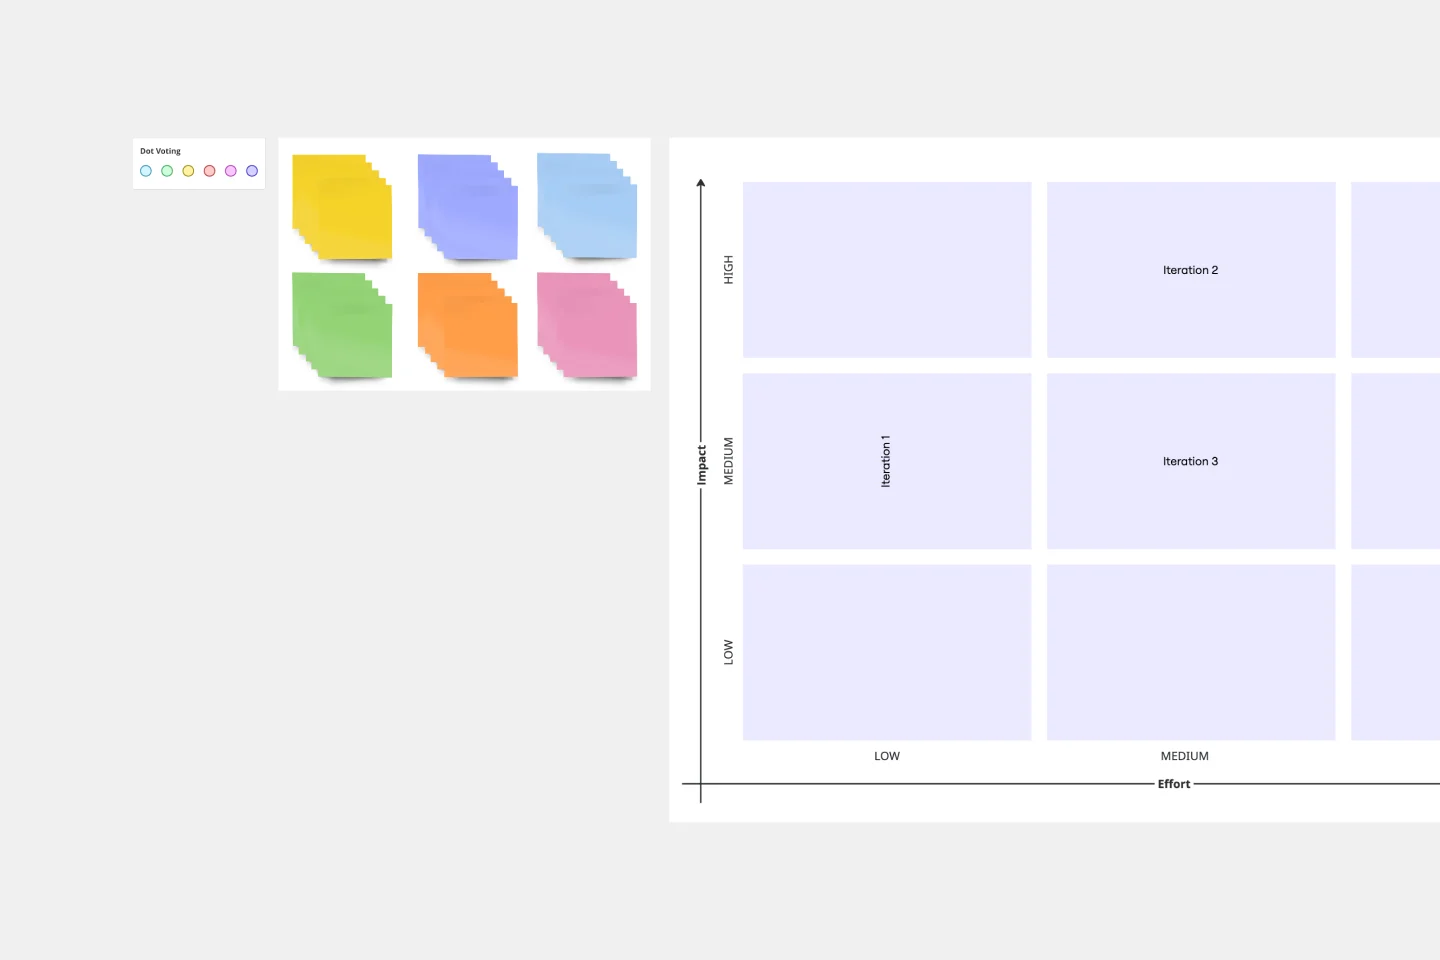
It’s all about assessing a task or idea, and quickly deciding the effort it will take and the potential impact it will have—ranked low, medium, or high. That’s what the 3x3 prioritization method does: Help teams prioritize and identify quick wins, big projects, filler tasks, or time-wasters. With nine bucket areas, it offers slightly greater detail than the 2x2 Prioritization Matrix (or Lean Prioritization Method). It’s easy to make your own 3x3 prioritization matrix—then use it to determine what activities or ideas to focus on with your valuable resources.
Porter's Five Forces Template
Works best for:
Leadership, Strategic Planning, Market Research
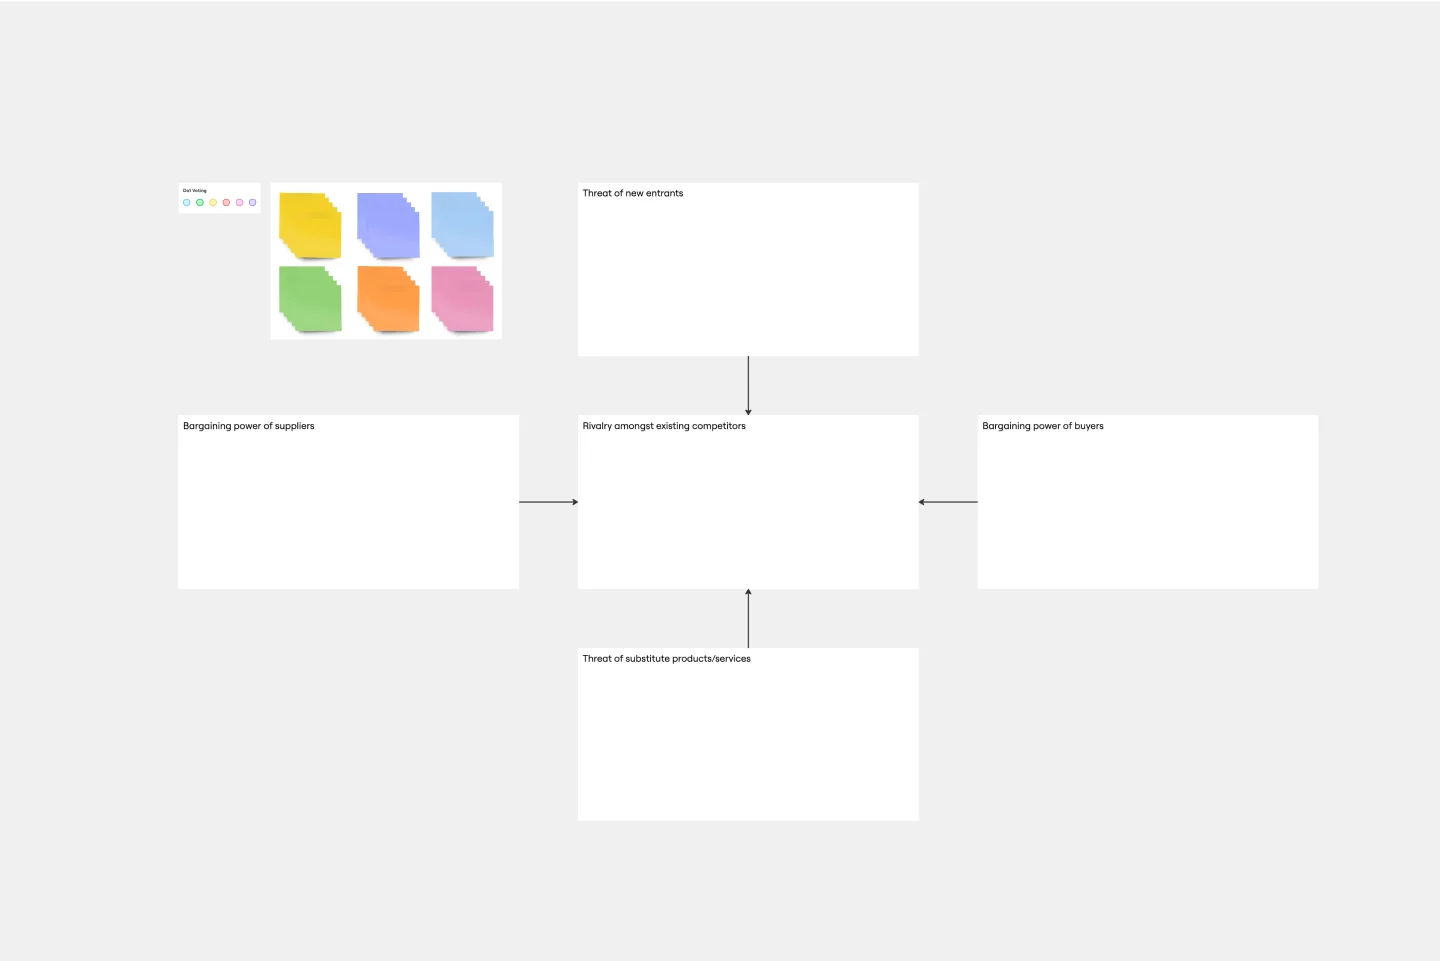
Developed by Harvard Business School professor Michael Porter, Porter’s Five Forces has become one of the most popular and highly regarded business strategy tools available for teams. Use Porter’s Five Forces to measure the strength of your current competition and decide which markets you might be able to move into. Porter’s Five Forces include: supplier power, buyer power, rivalry among existing competitors, the threat of substitute products or services, the threat of substitute products and services, and the threat of new entrants.