
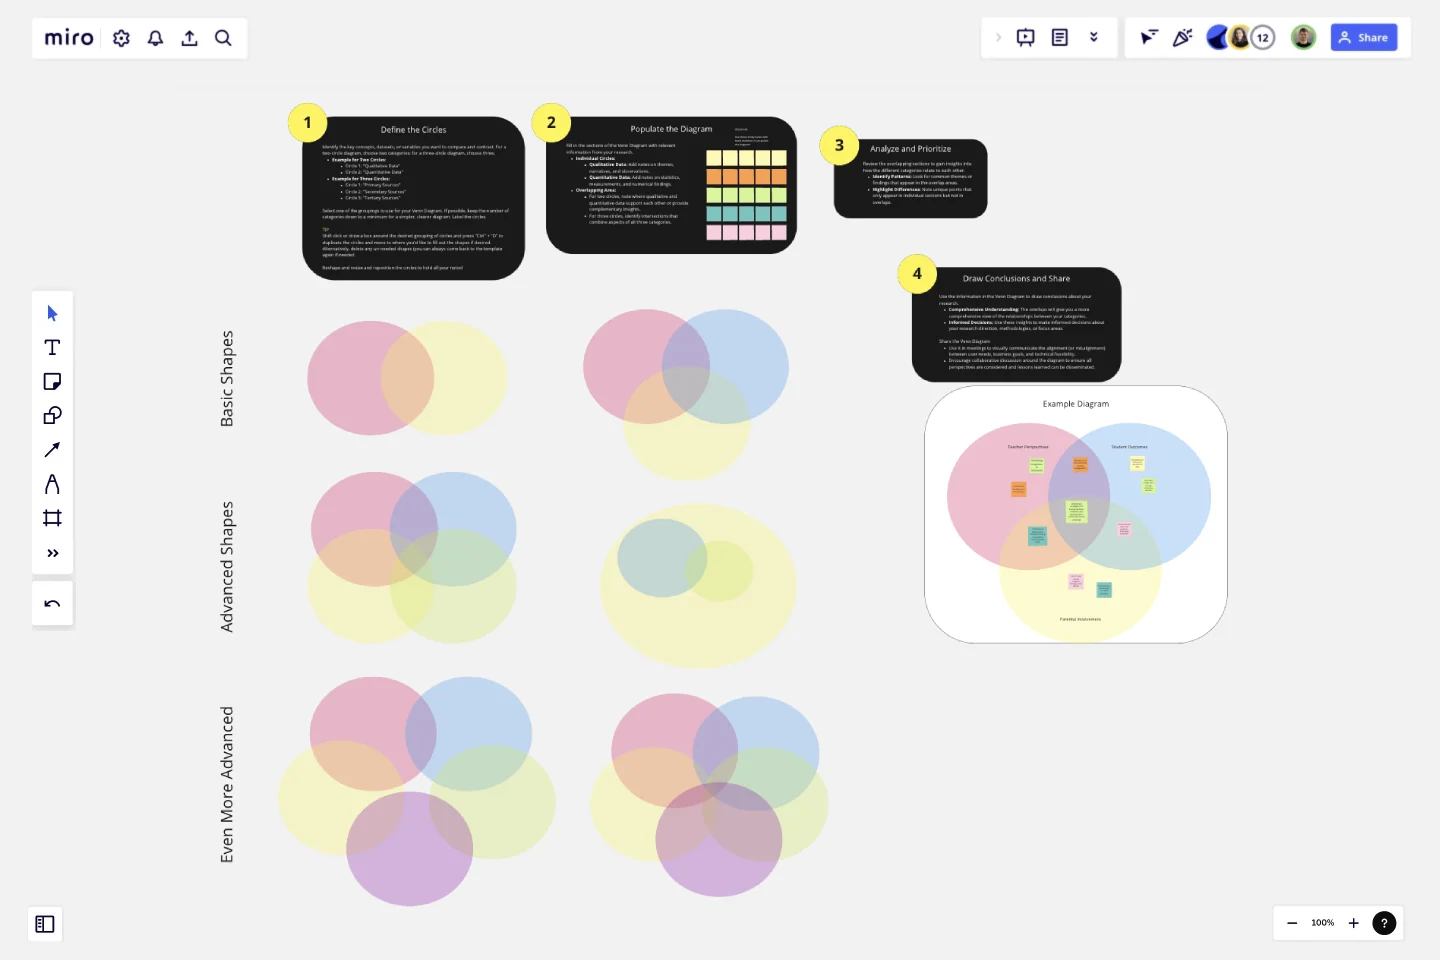
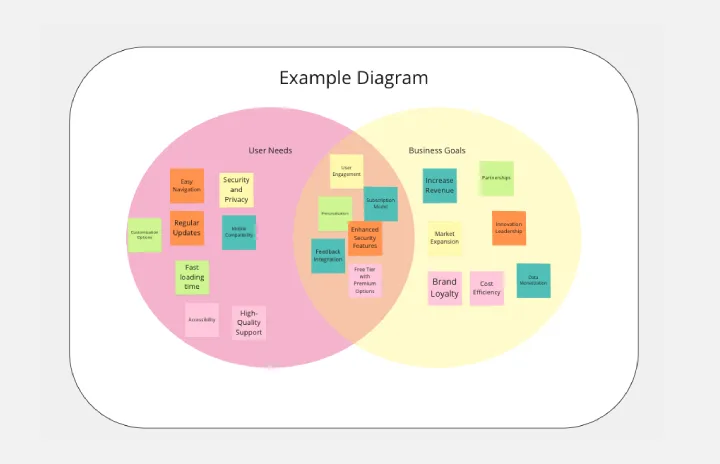
Venn Diagram for Research
The Venn Diagram for Research template is an essential tool designed to help researchers visually organize, compare, and contrast different datasets, concepts, or variables.
By clearly displaying the relationships and overlaps between categories, this template aids in uncovering insights and drawing meaningful conclusions.
Why Use This Template?
Organize Complex Data:
Visual Clarity: The template simplifies the organization of complex data, making it easier to understand and analyze.
Structured Comparison: Helps in systematically comparing and contrasting different research elements.
Enhance Analytical Insights:
Identify Patterns: Easily spot patterns, trends, and relationships between different datasets or variables.
Highlight Gaps: Quickly identify gaps or areas needing further investigation.
Facilitate Collaboration:
Team Alignment: Use the template in collaborative research settings to ensure all team members have a clear understanding of the relationships between different research elements.
Interactive Discussions: Ideal for group discussions, brainstorming sessions, and collaborative analysis.
Support Decision-Making:
Informed Conclusions: Helps in making informed decisions by clearly showing the intersection of different research categories.
Strategic Planning: Assists in planning research focus areas, methodologies, and further investigations.
Ease of Use:
Pre-Defined Sections: Comes with pre-defined sections for various categories and their overlaps, making it quick and easy to start using.
Editable Placeholders: Includes editable placeholders for notes, allowing for customization based on specific research needs.
Versatile Application:
Adaptable: Suitable for various types of research, including qualitative, quantitative, and mixed-methods studies.
Reusable: Can be reused across different research projects, making it a valuable tool for ongoing research activities.
Use Cases:
Comparative Studies: Compare different datasets, such as qualitative and quantitative data, or different sources of information.
Thematic Analysis: Identify common themes and unique insights across various research categories.
Data Integration: Integrate findings from different studies or sources to draw comprehensive conclusions.
Research Planning: Plan and prioritize research activities based on identified overlaps and gaps.
Template Features:
Instructions Section:
Step-by-Step Guide: Simple instructions on how to fill out and use the Venn Diagram effectively.
Example Notes:
Pre-Populated Examples: Examples of notes for each section to help users understand how to populate the diagram.
By choosing the Venn Diagram for Research template, researchers can effectively organize and analyze their data, leading to deeper insights and more robust conclusions. This template is ideal for anyone looking to streamline their research process and enhance collaborative efforts.
This template was created by Anthony.
Get started with this template right now.
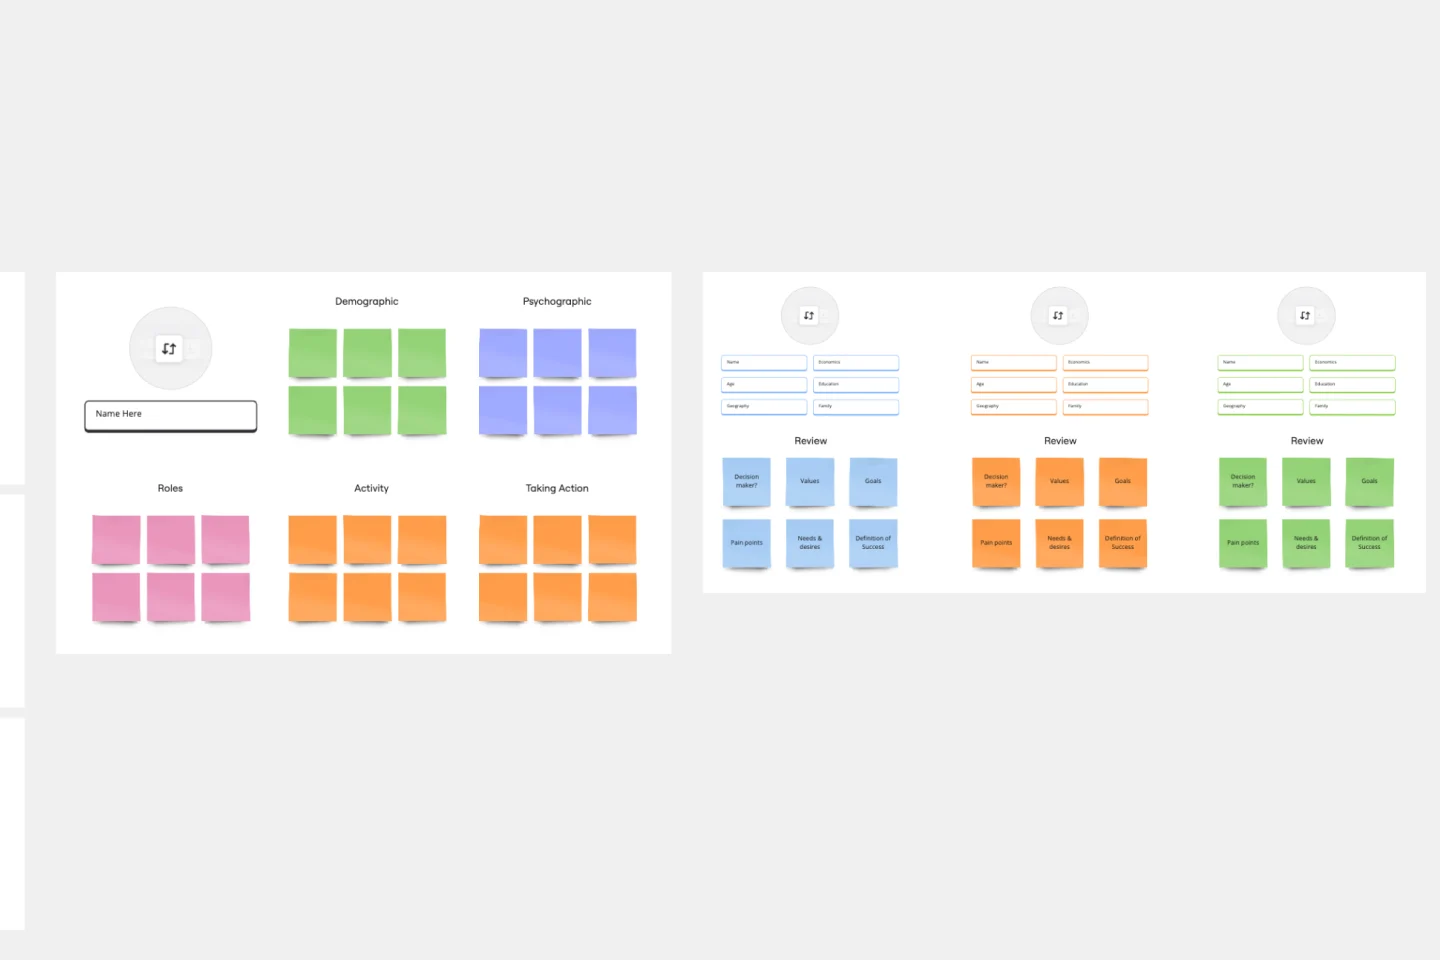
Target Audience Template
Works best for:
Marketing, Desk Research, Prioritization
Understanding your target audience is vital to business success. How can you market yourself effectively if you don’t know who you’re targeting? Using the Target Audience template, you can review valuable data about who your customers are and what they want from your product or service.
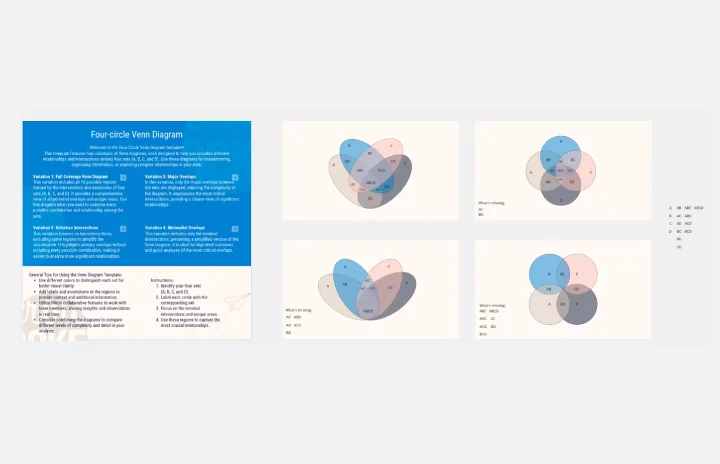
Four-Circle Venn Diagram by Irfan Rosli
Works best for:
Venn Diagrams
The Four Circle Venn Diagram template offers a robust tool for detailed data comparison involving four sets. Use it to identify common and unique attributes across multiple categories. This template is perfect for complex analysis in research, strategic planning, and education. It helps visualize relationships clearly, making it easier to draw insights and communicate findings. Ideal for professionals and educators needing advanced comparative tools.
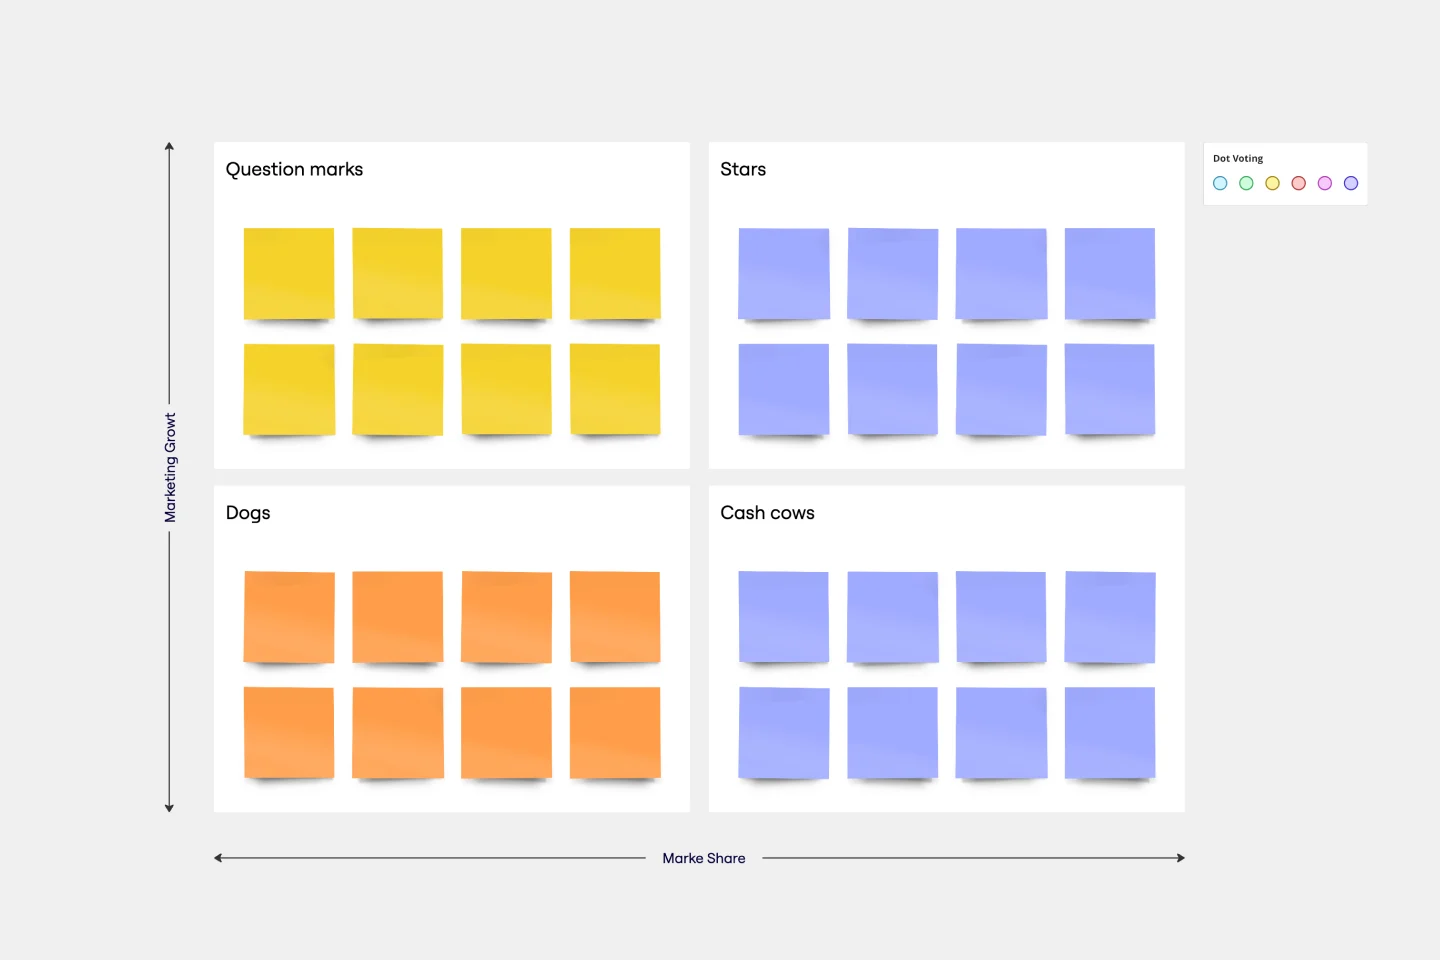
BCG Matrix Template
Works best for:
Strategic Planning
Use the BCG matrix template to make informed and strategic decisions about growth opportunities for your business. Assign your portfolio of products to different areas within the matrix (cash cows, dogs, question marks, stars) to prioritize where you should invest your time and money to see the best results.
Venn Diagram for Product Development
Works best for:
Venn Diagrams
Streamline your product development process with the Venn Diagram for Product Development template. Use it to compare product features, identify market needs, and explore design options. This template helps you visualize relationships and prioritize features based on customer requirements and competitive analysis. It's an essential tool for product managers, designers, and development teams aiming to create successful and user-centric products.
Timeline-Retrospective
Works best for:
Timeline, Planning
Use the Timeline Retrospective template to review project progress and outcomes. It’s ideal for identifying what worked well and what didn’t, facilitating continuous improvement. This template helps teams reflect on their performance and make informed decisions for future projects.
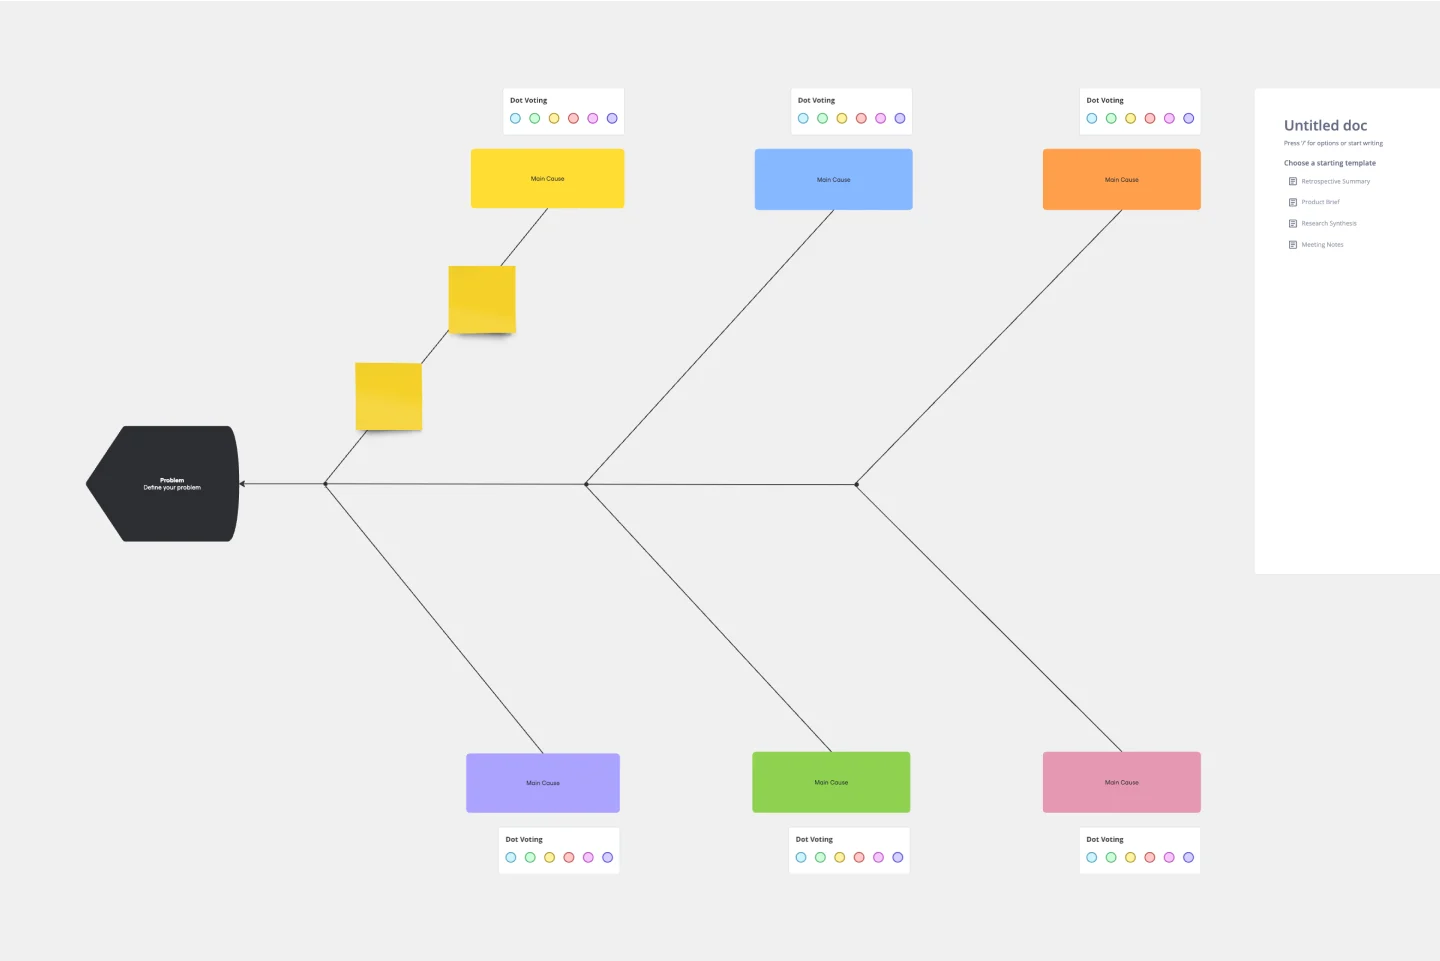
Fishbone Diagram Template
Works best for:
Operations, Diagrams, Workflows
What is the best way to solve any problem your team faces? Go straight to the root. That means identifying the root causes of the problem, and fishbone diagrams are designed to help you do it best. Also known as the Ishikawa Diagram (named after Japanese quality control expert Kaoru Ishikawa), fishbone diagrams allow teams to visualize all possible causes of a problem, to explore and understand how they fit together holistically. Teams can also use fishbone diagrams as a starting point for thinking about what the root cause of a future problem might be.