Back to Diagramming & mapping
Venn diagram templates
Peek into our Venn diagram templates collection and see how they make data relationships crystal clear. They're straightforward to use, helping your team identify common ground and unique traits quickly. These templates are not just about simplifying decision-making and strategic planning; they're about fostering seamless collaboration and guiding your projects to triumph. With our Venn diagram examples, visualizing intersections and differences becomes intuitive, supporting your team in making well-informed choices.
20 templates
3-Circle Venn Diagram
2 likes409 uses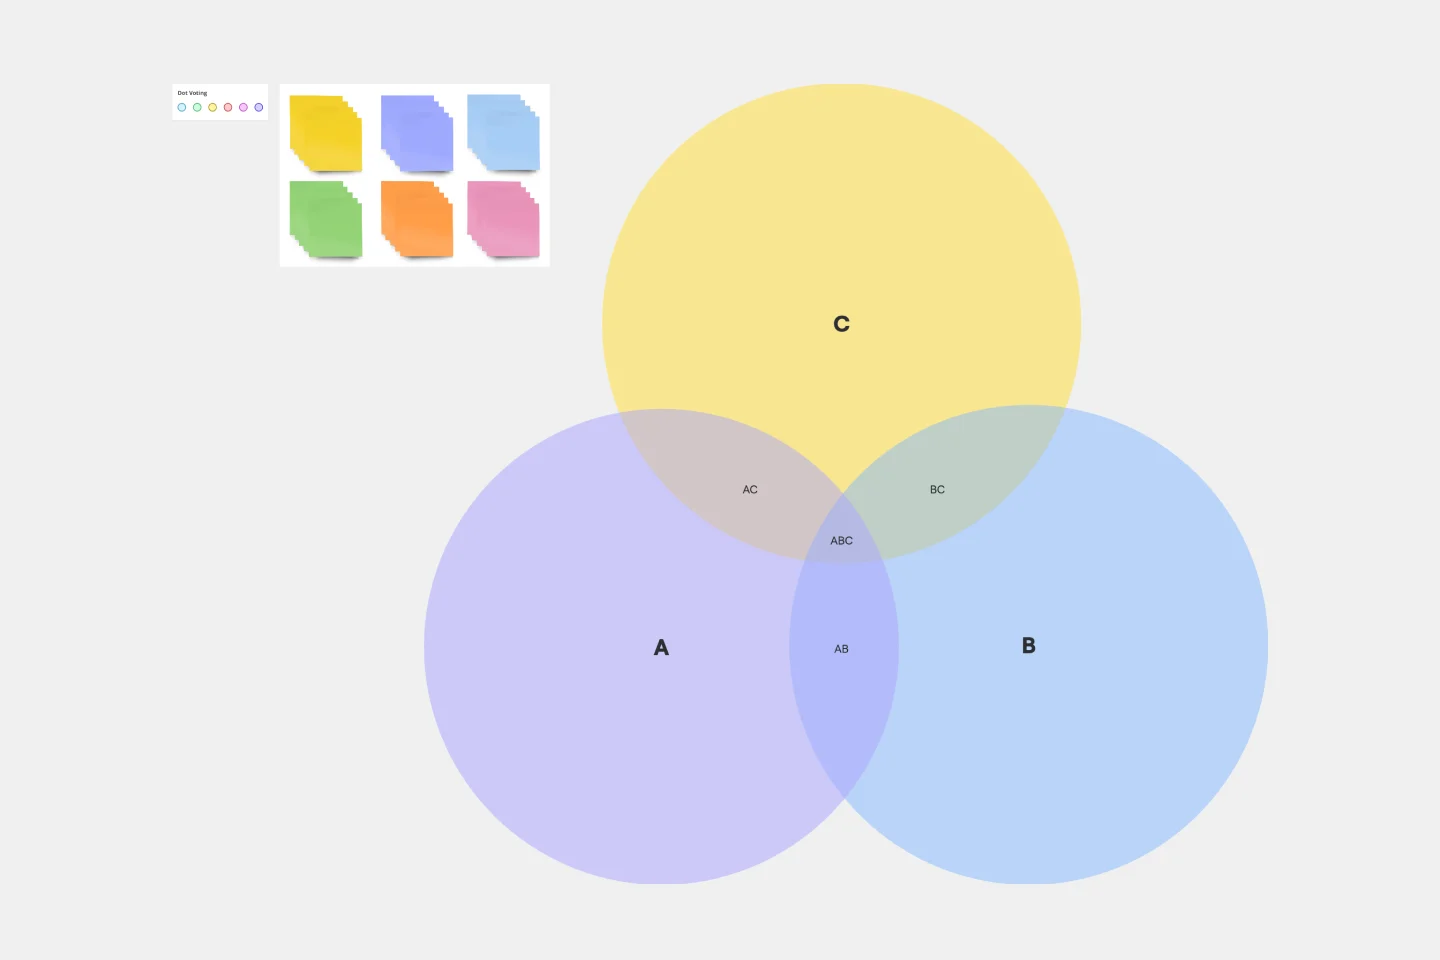
4-Circle Venn Diagram Template
1 likes127 uses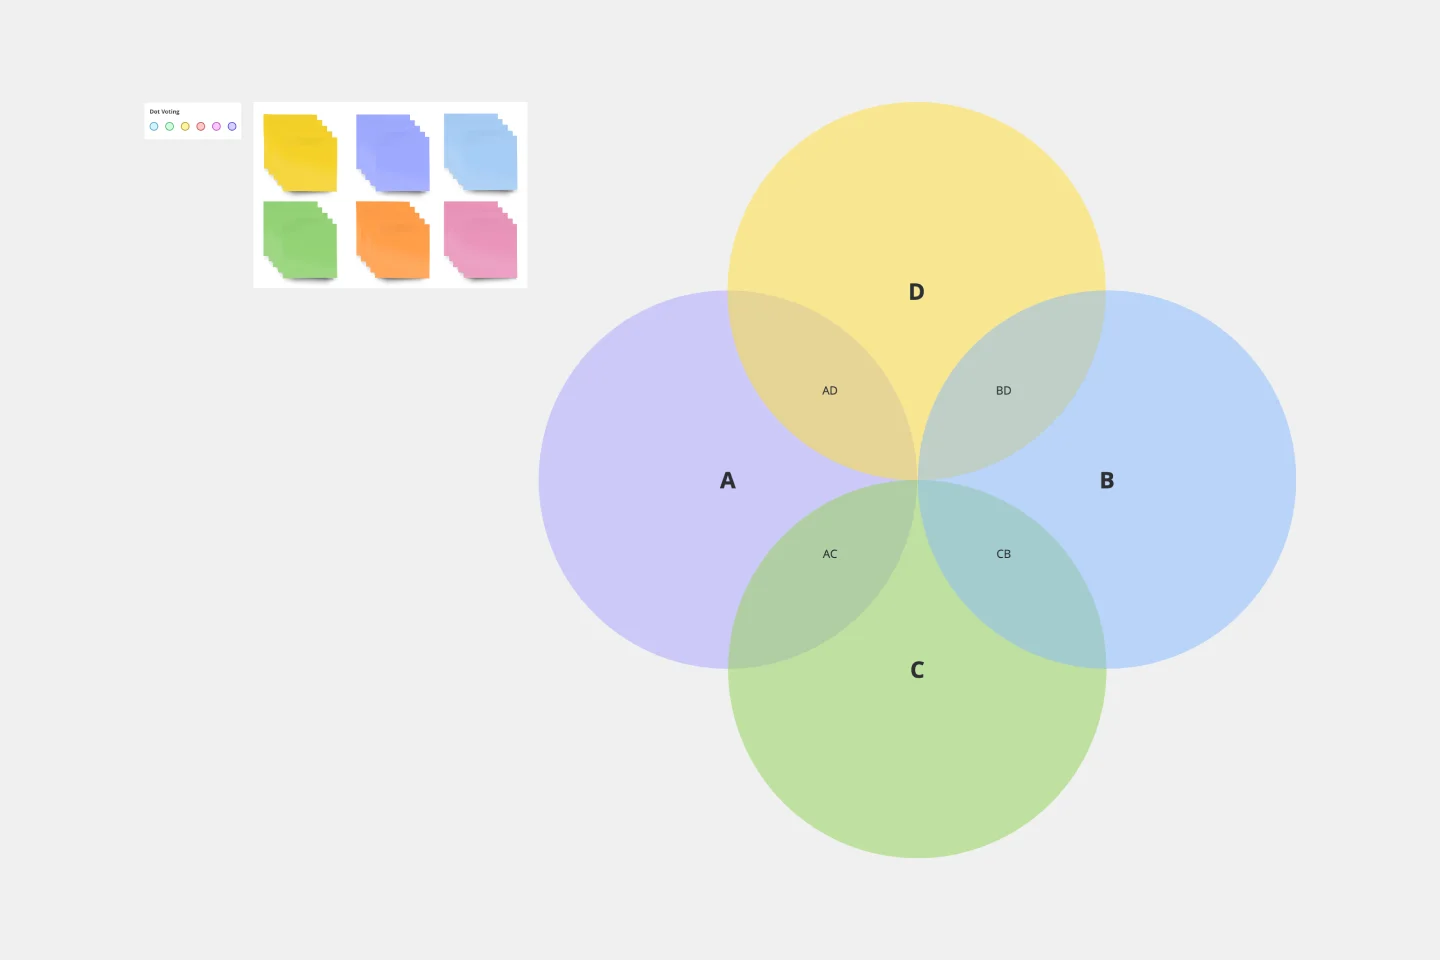
5-Set Venn Diagram
5 likes90 uses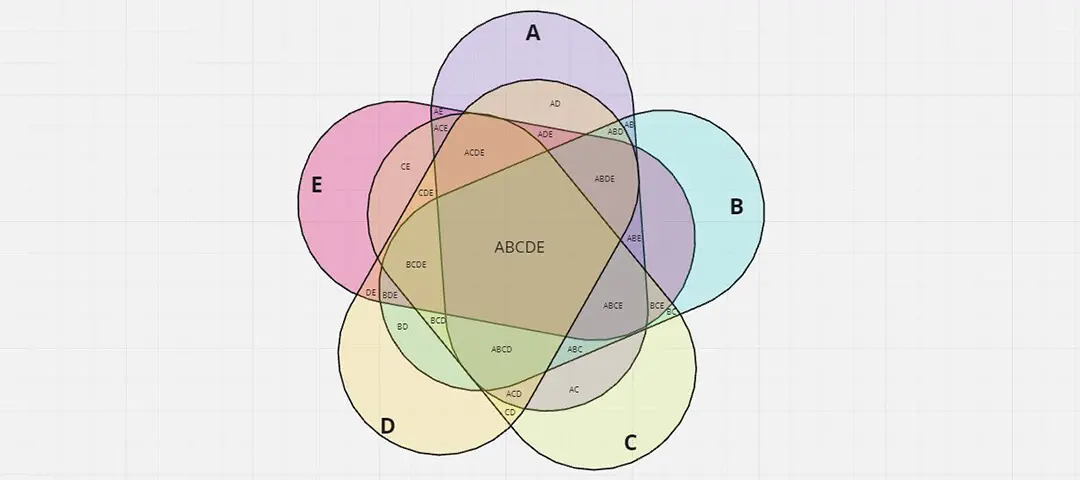
3-Circle Venn Diagram
2 likes409 usesVenn Diagrams
22 likes260 uses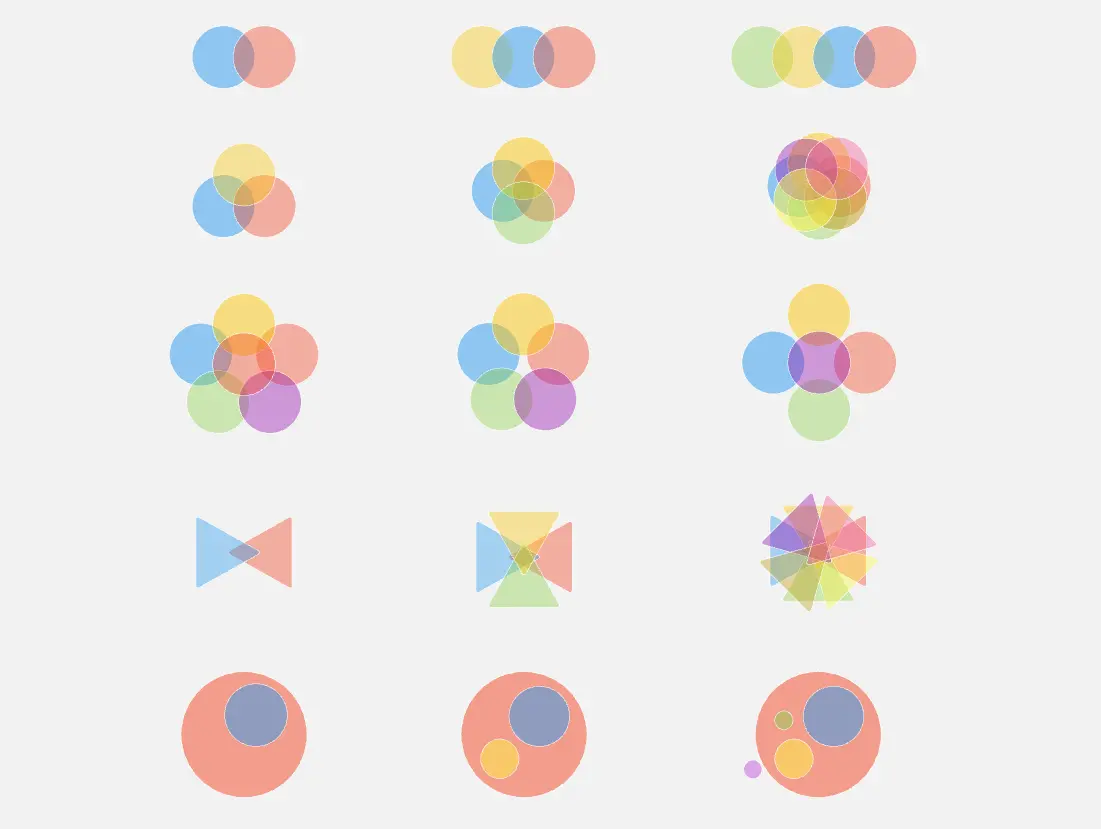
5-Circle Venn Diagram Template
1 likes234 uses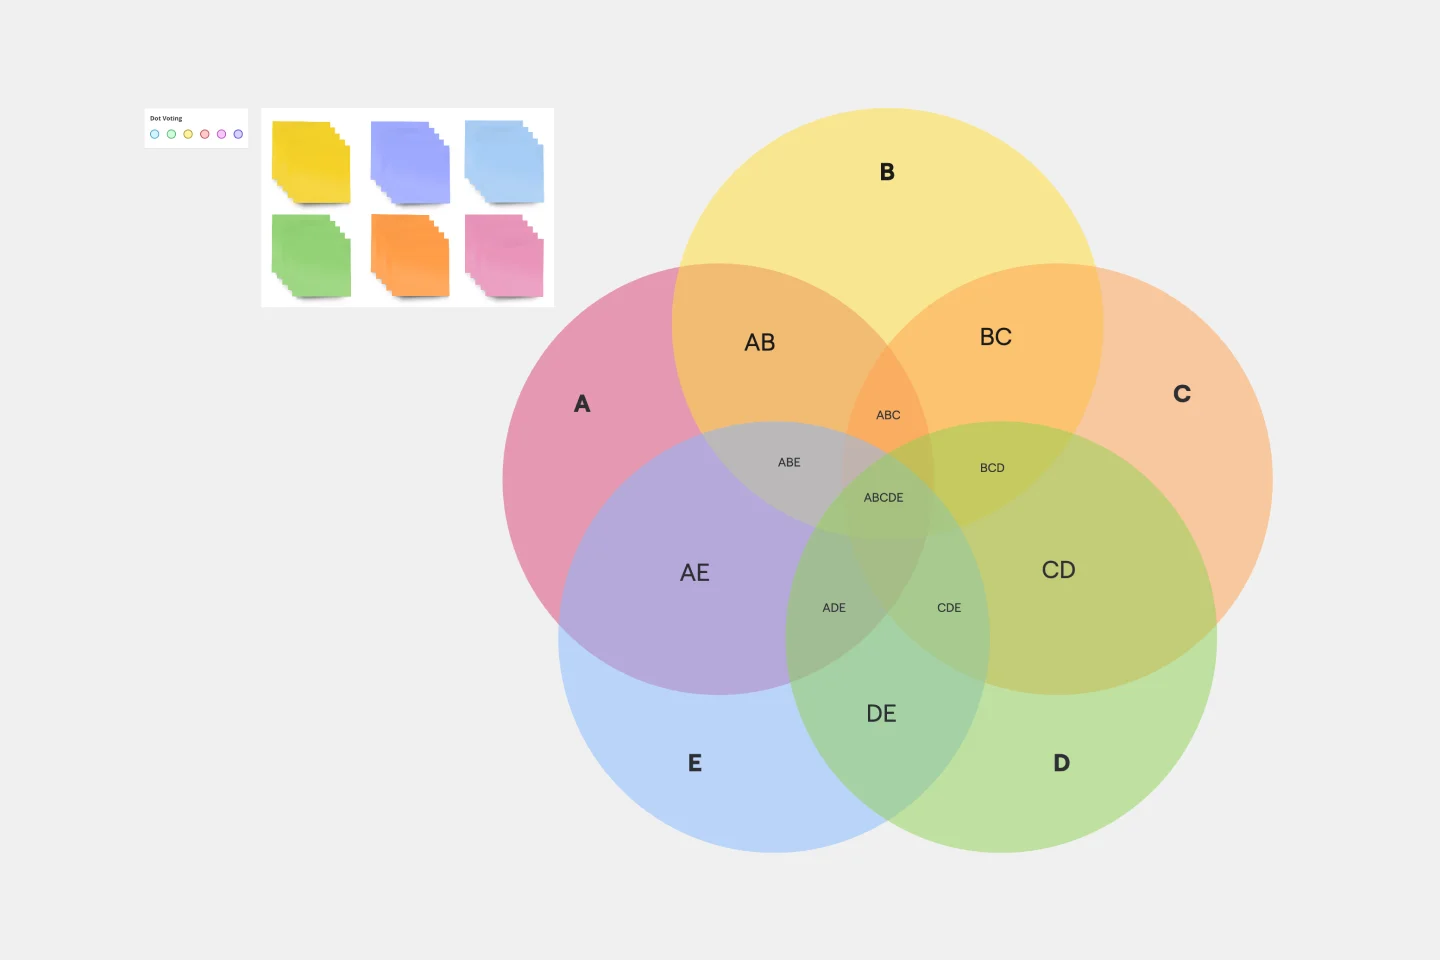
Four-Circle Venn Diagram
3 likes187 uses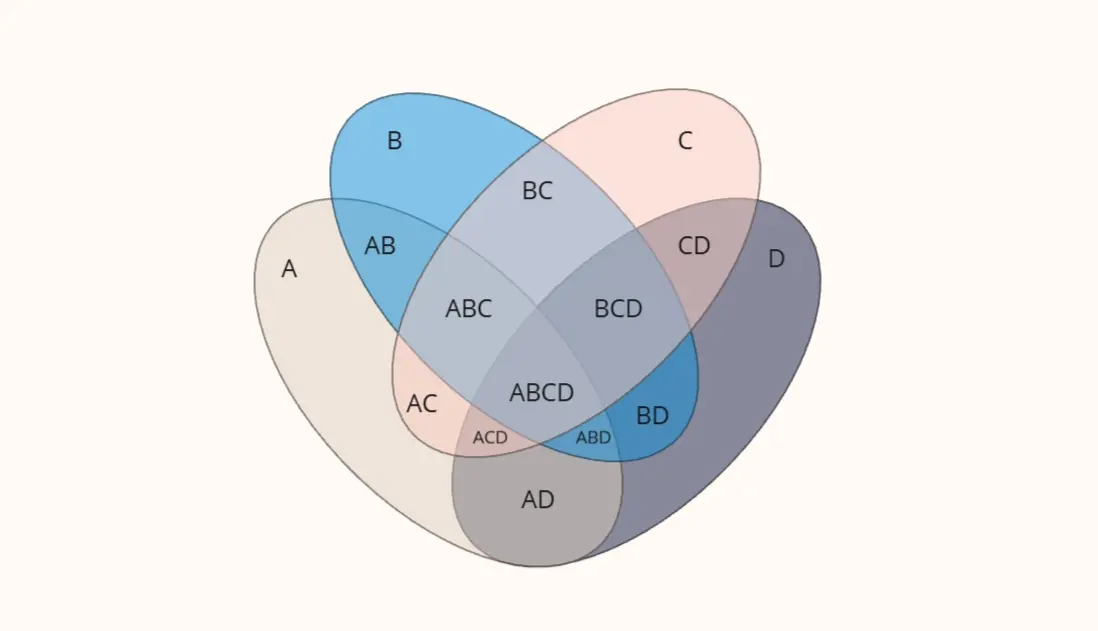
Basic Venn Diagram
18 likes132 uses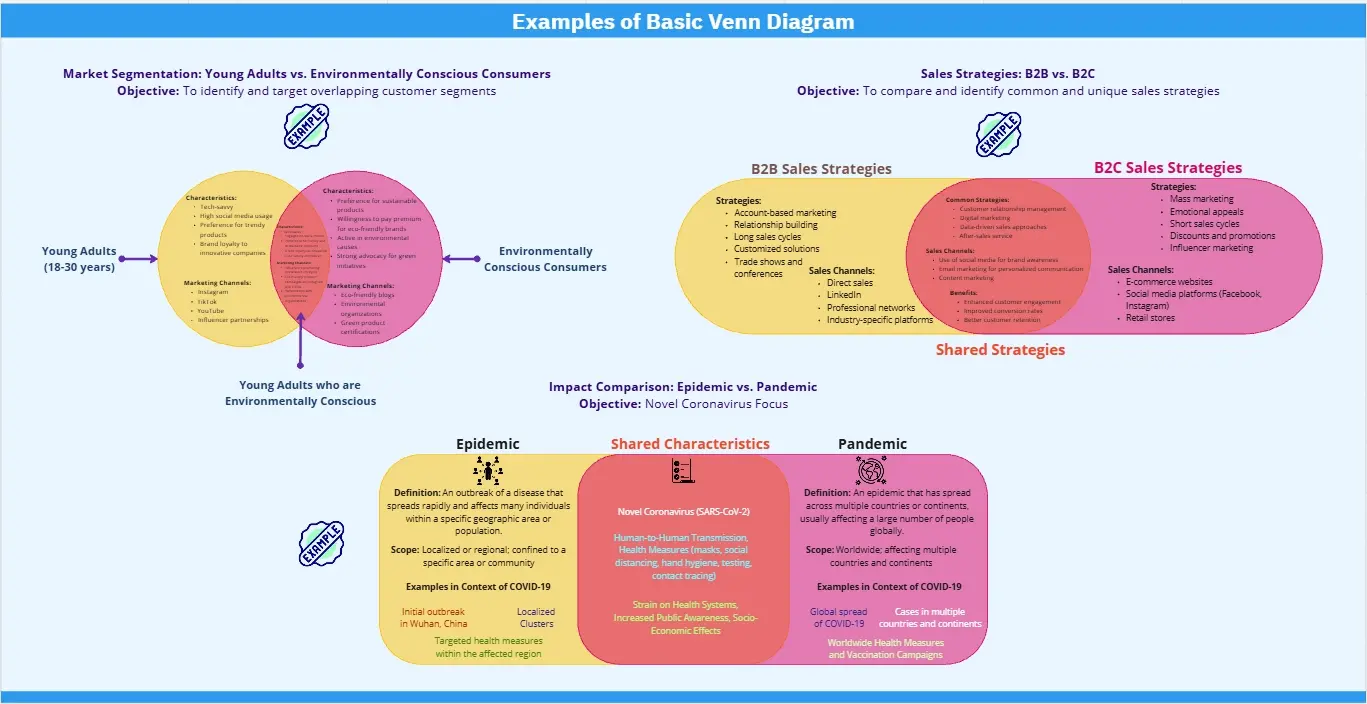
4-Circle Venn Diagram Template
1 likes127 uses5-Set Venn Diagram
5 likes90 usesVenn Diagram for Research
11 likes83 uses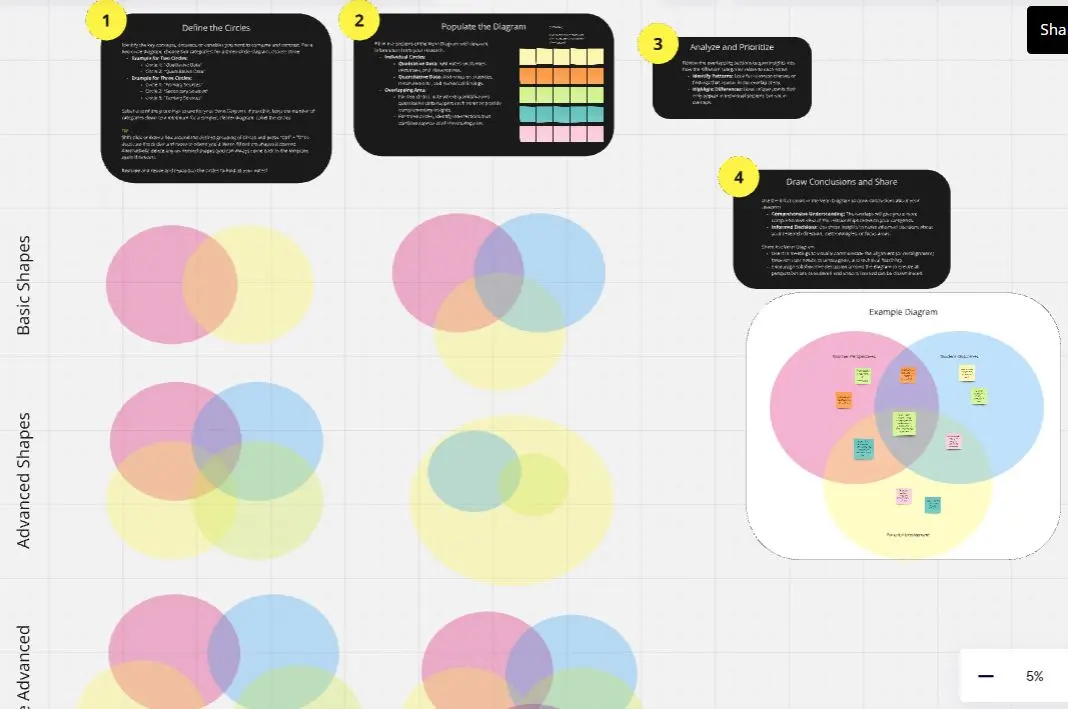
The Working & Stuck Venn Diagram
12 likes67 uses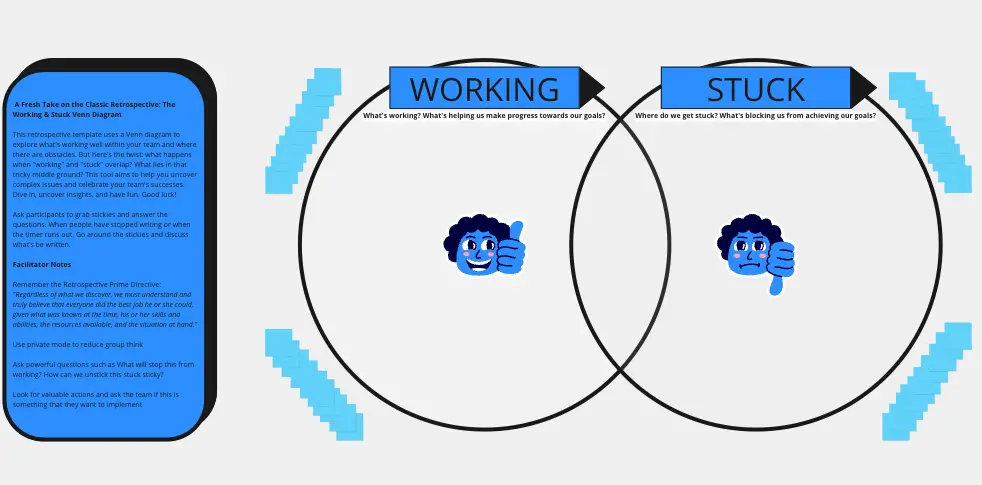
Three-Circle Venn Diagram
8 likes57 uses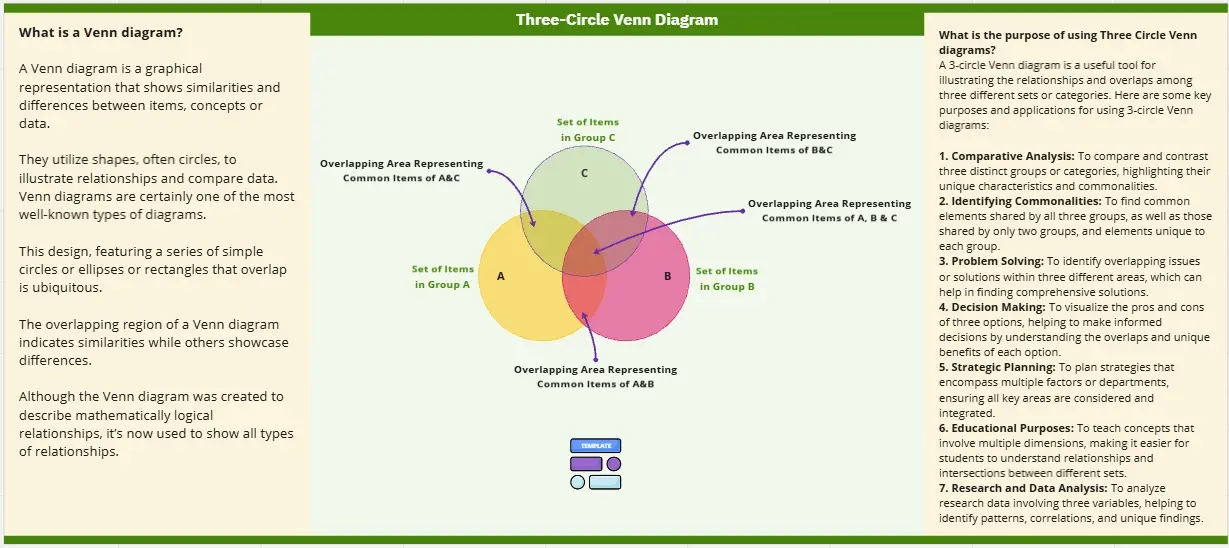
Venn Diagram for Learning and Education
20 likes56 uses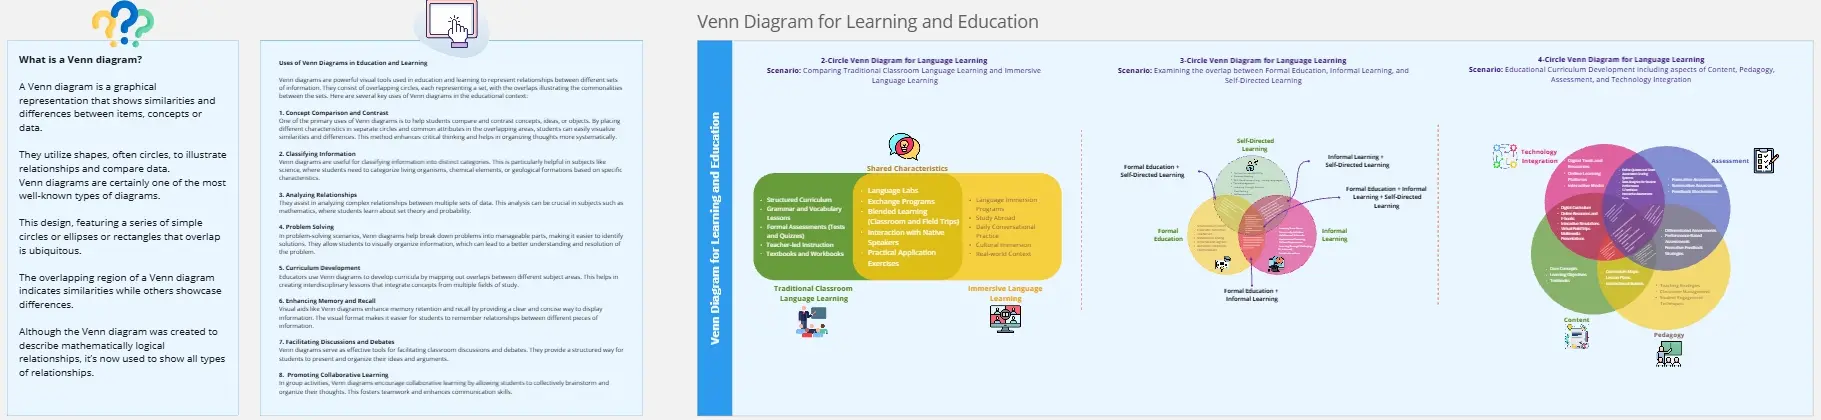
2-Circle Venn Diagram Template
0 likes55 uses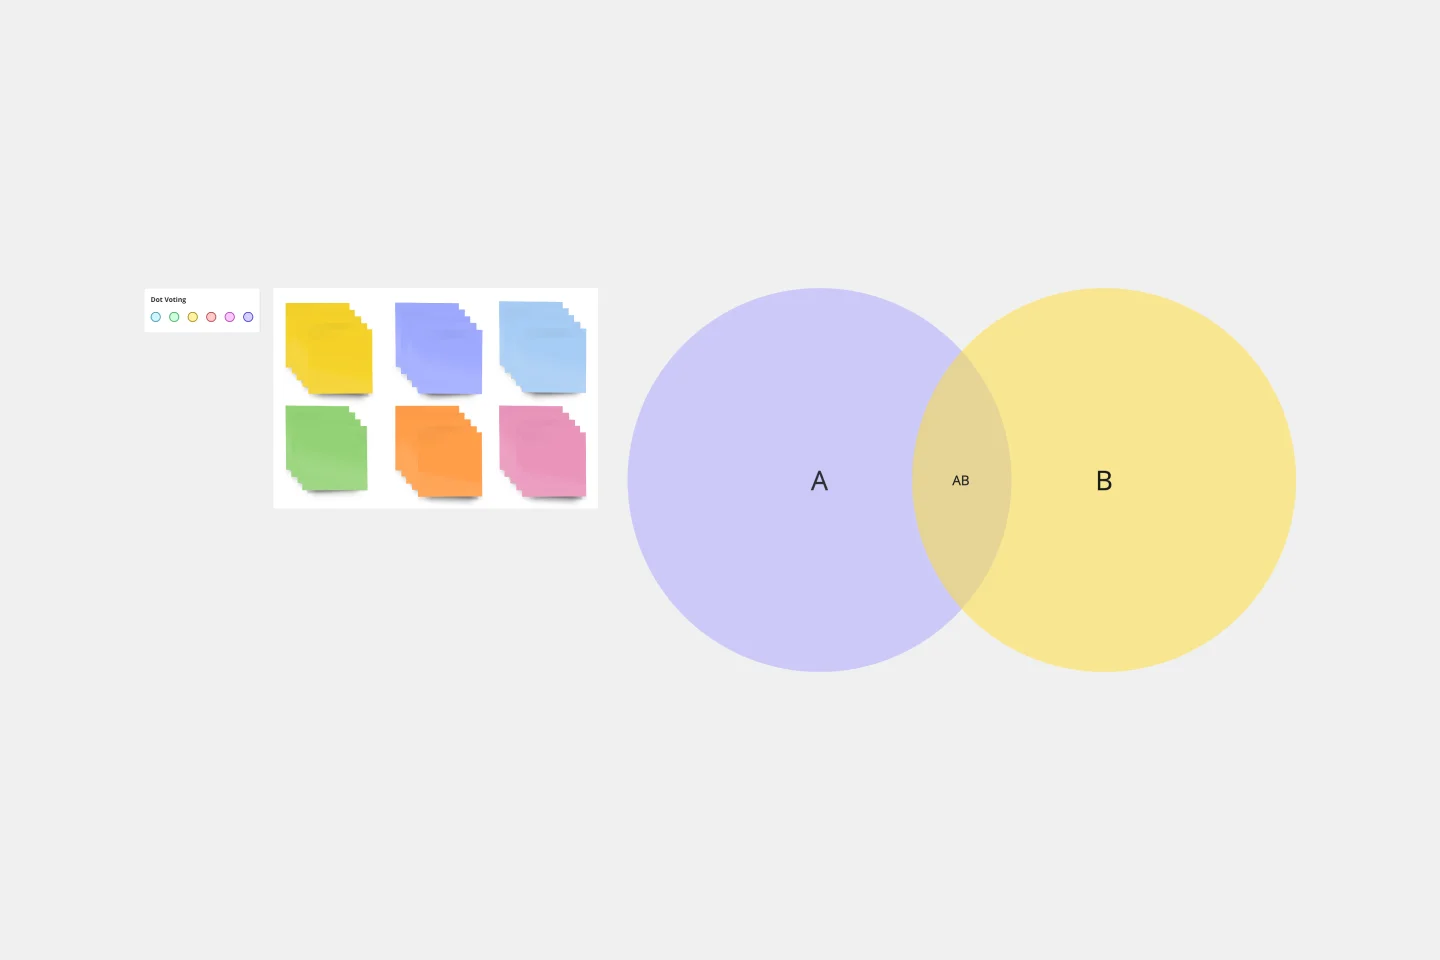
Product Feature Venn Diagram
3 likes50 uses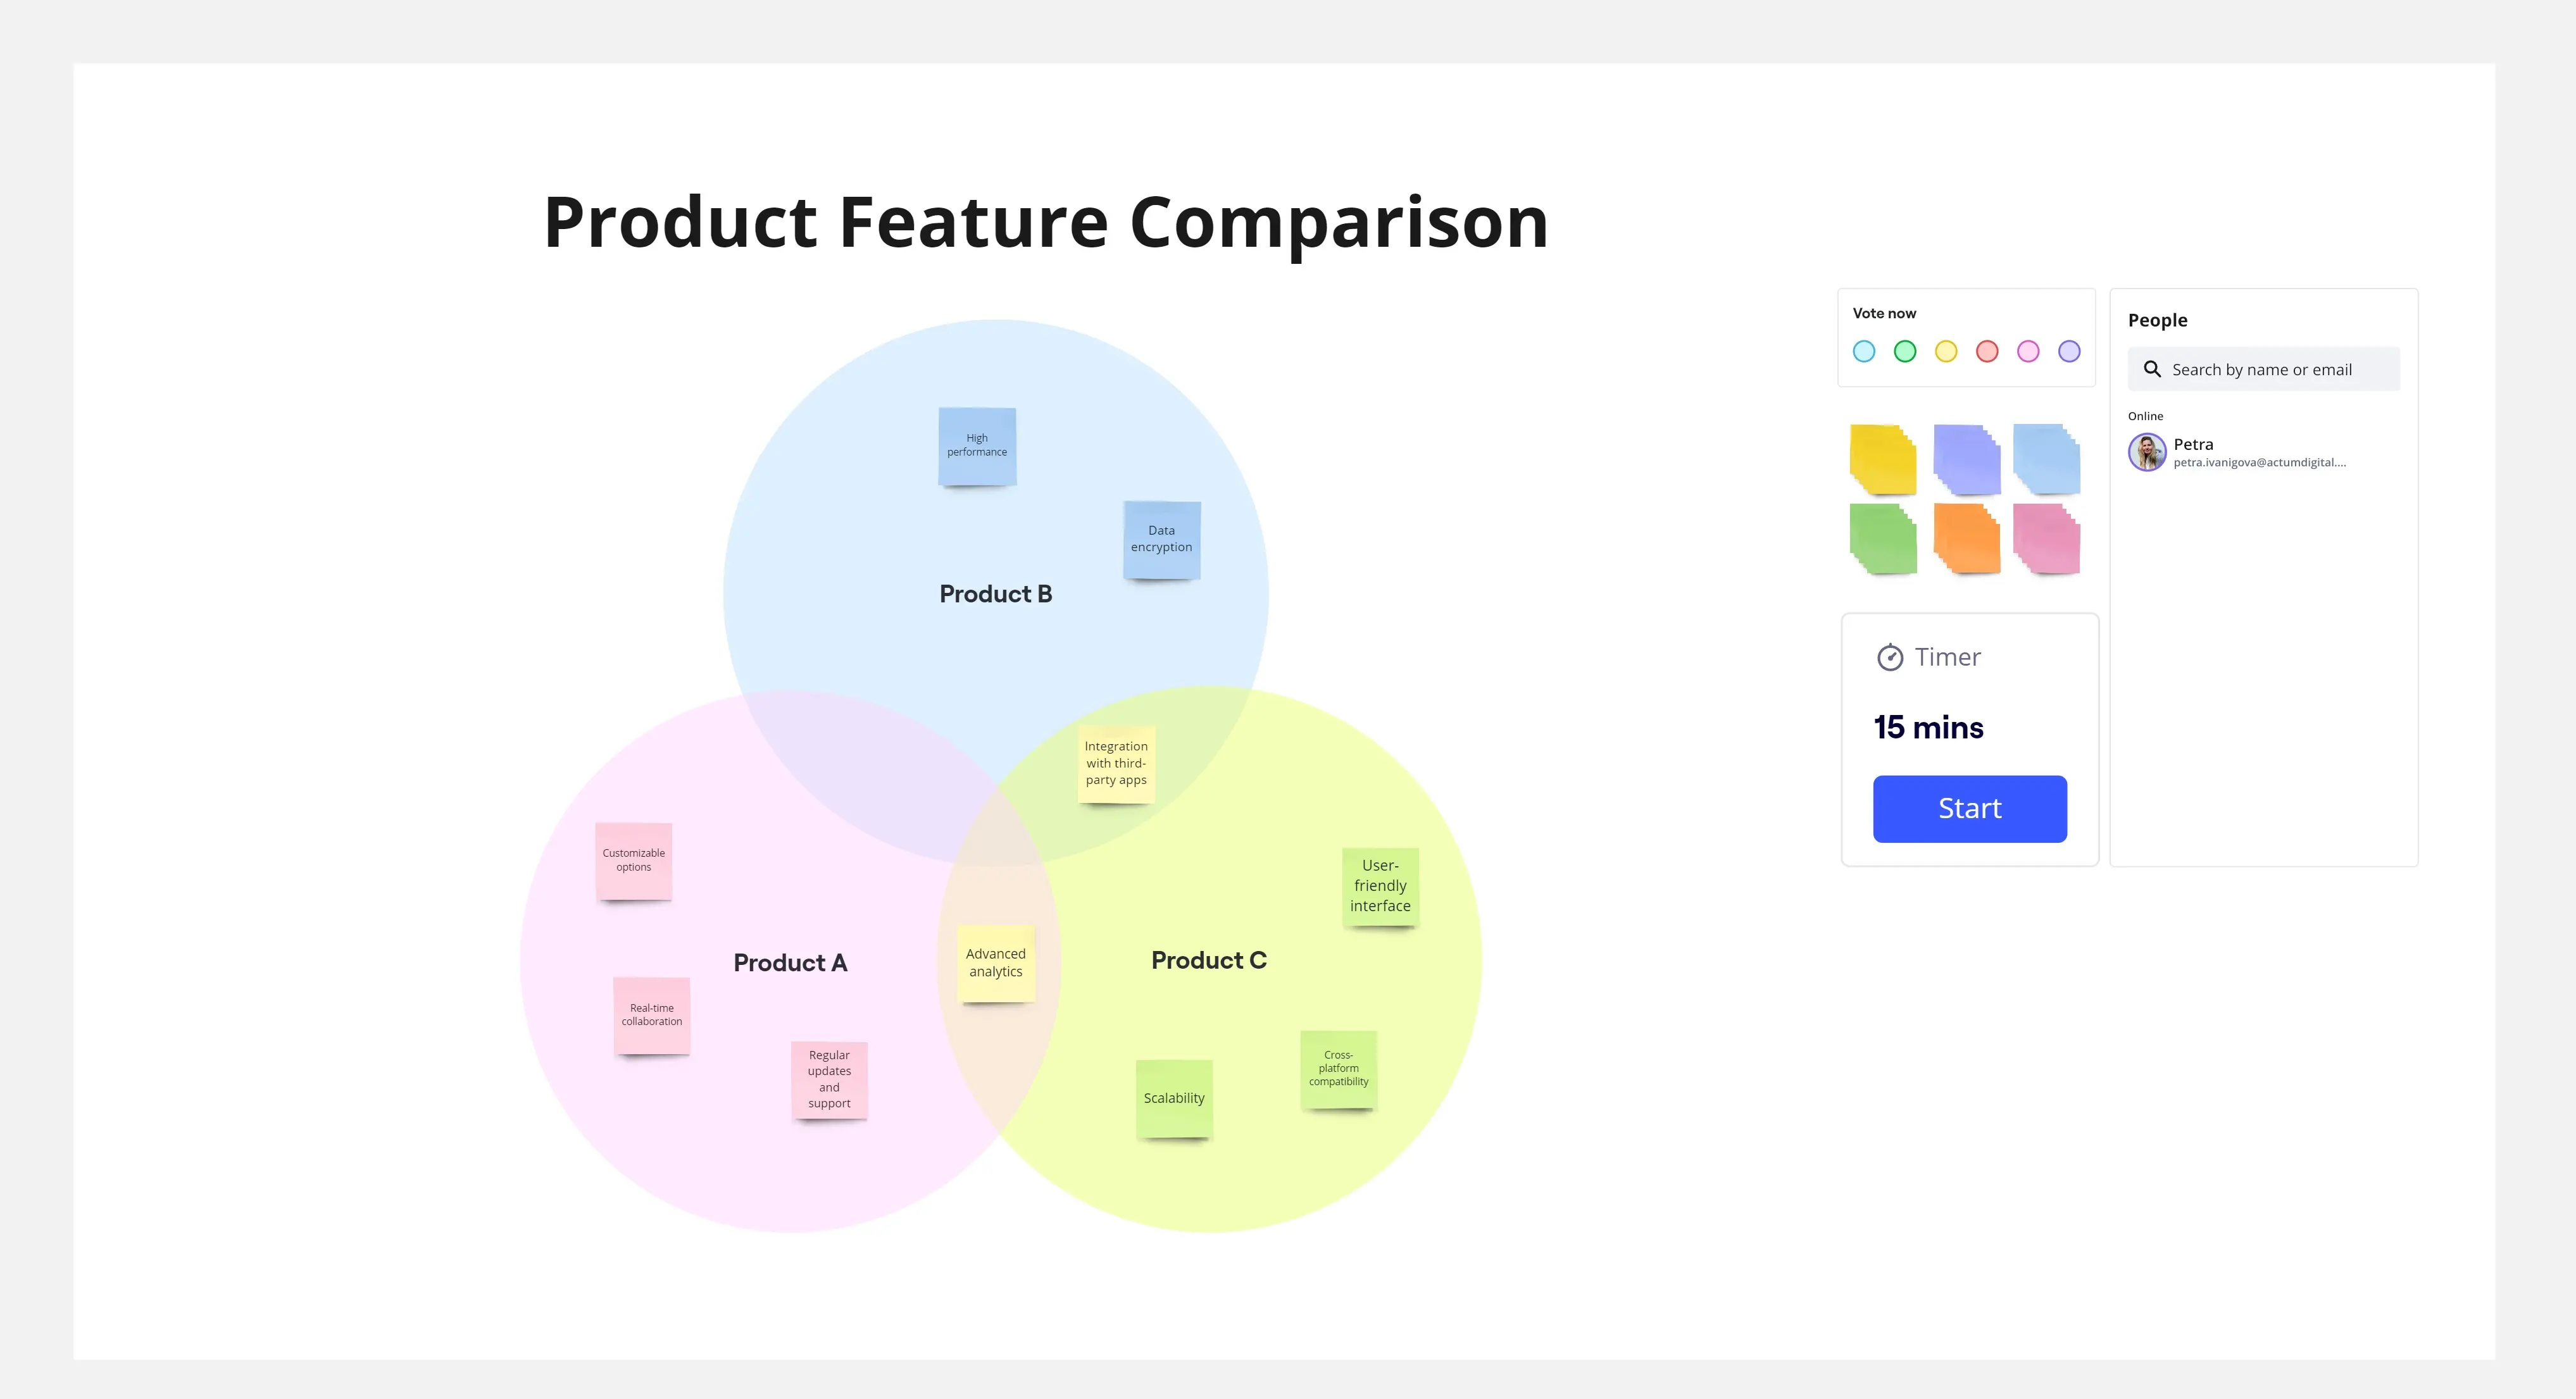
Venn Diagram for Product Development
4 likes39 uses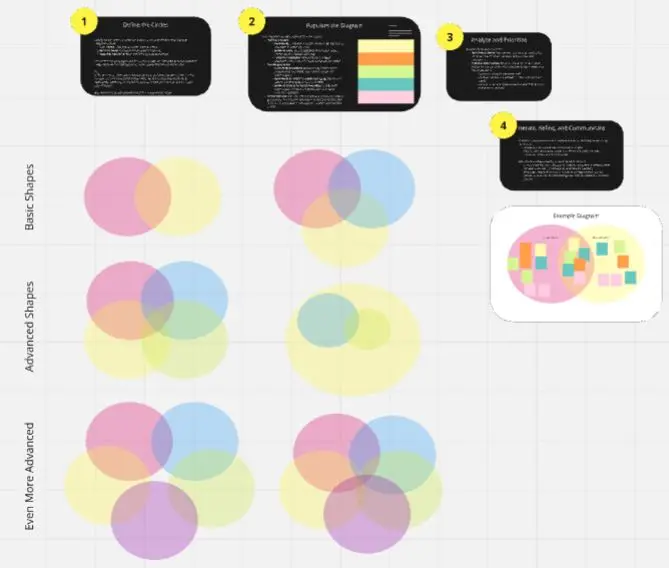
Four-Circle Venn Diagram
3 likes38 uses
Euler Diagram Template
0 likes38 uses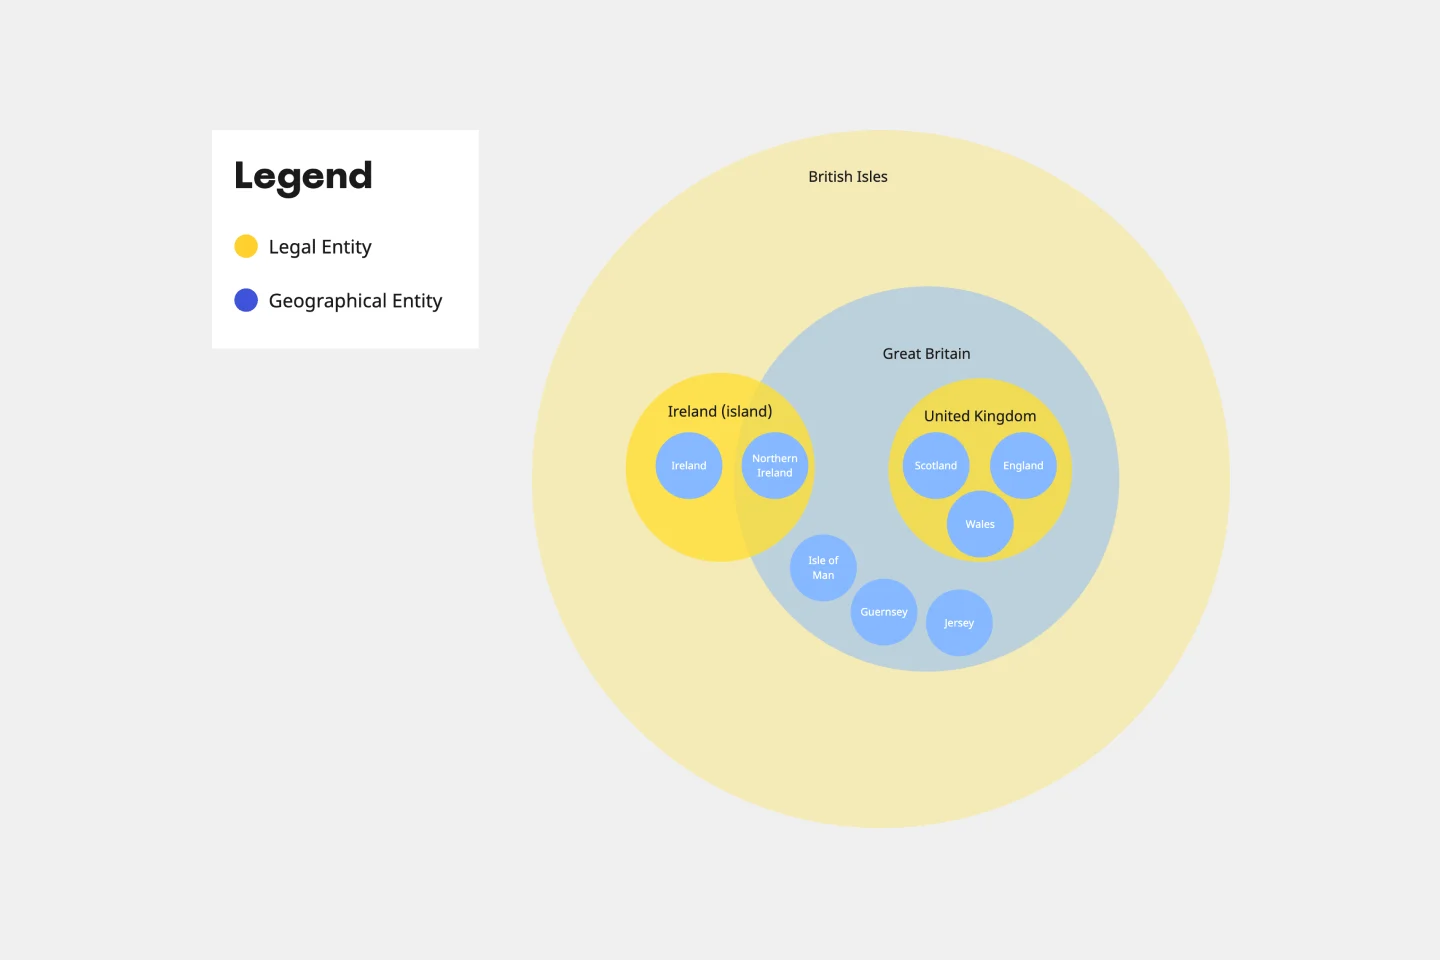
Venn Diagram for Marketing Analysis
23 likes34 uses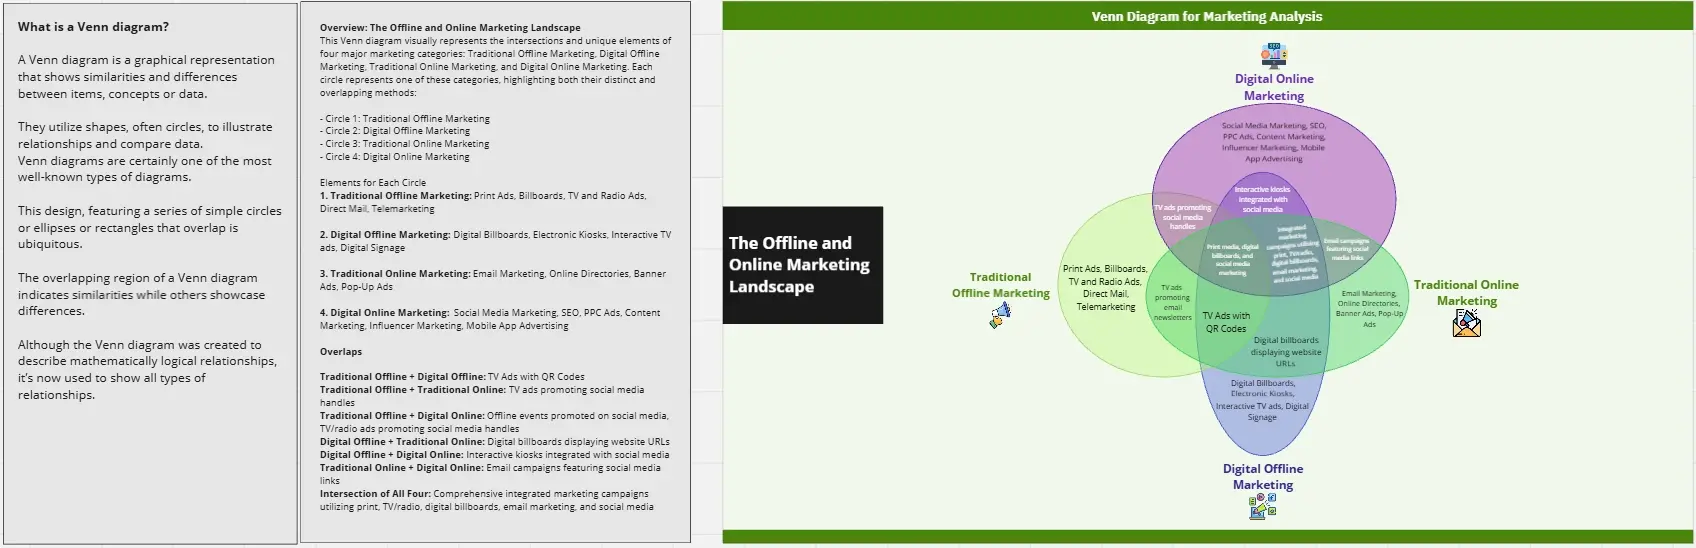
Venn Diagram Practical Applications
8 likes24 uses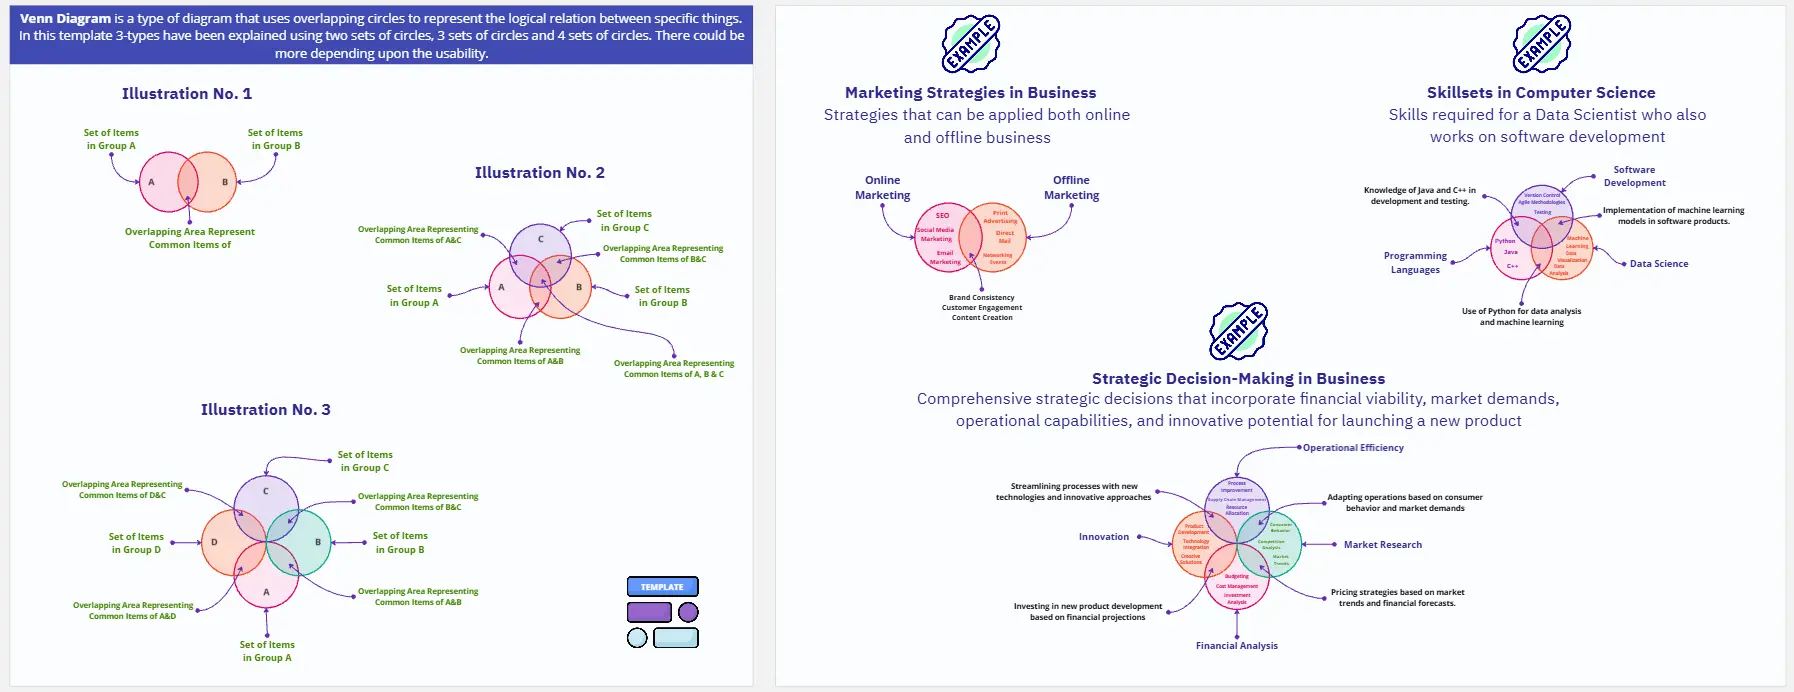
Venn Diagram for Non-Fiction Books
4 likes17 uses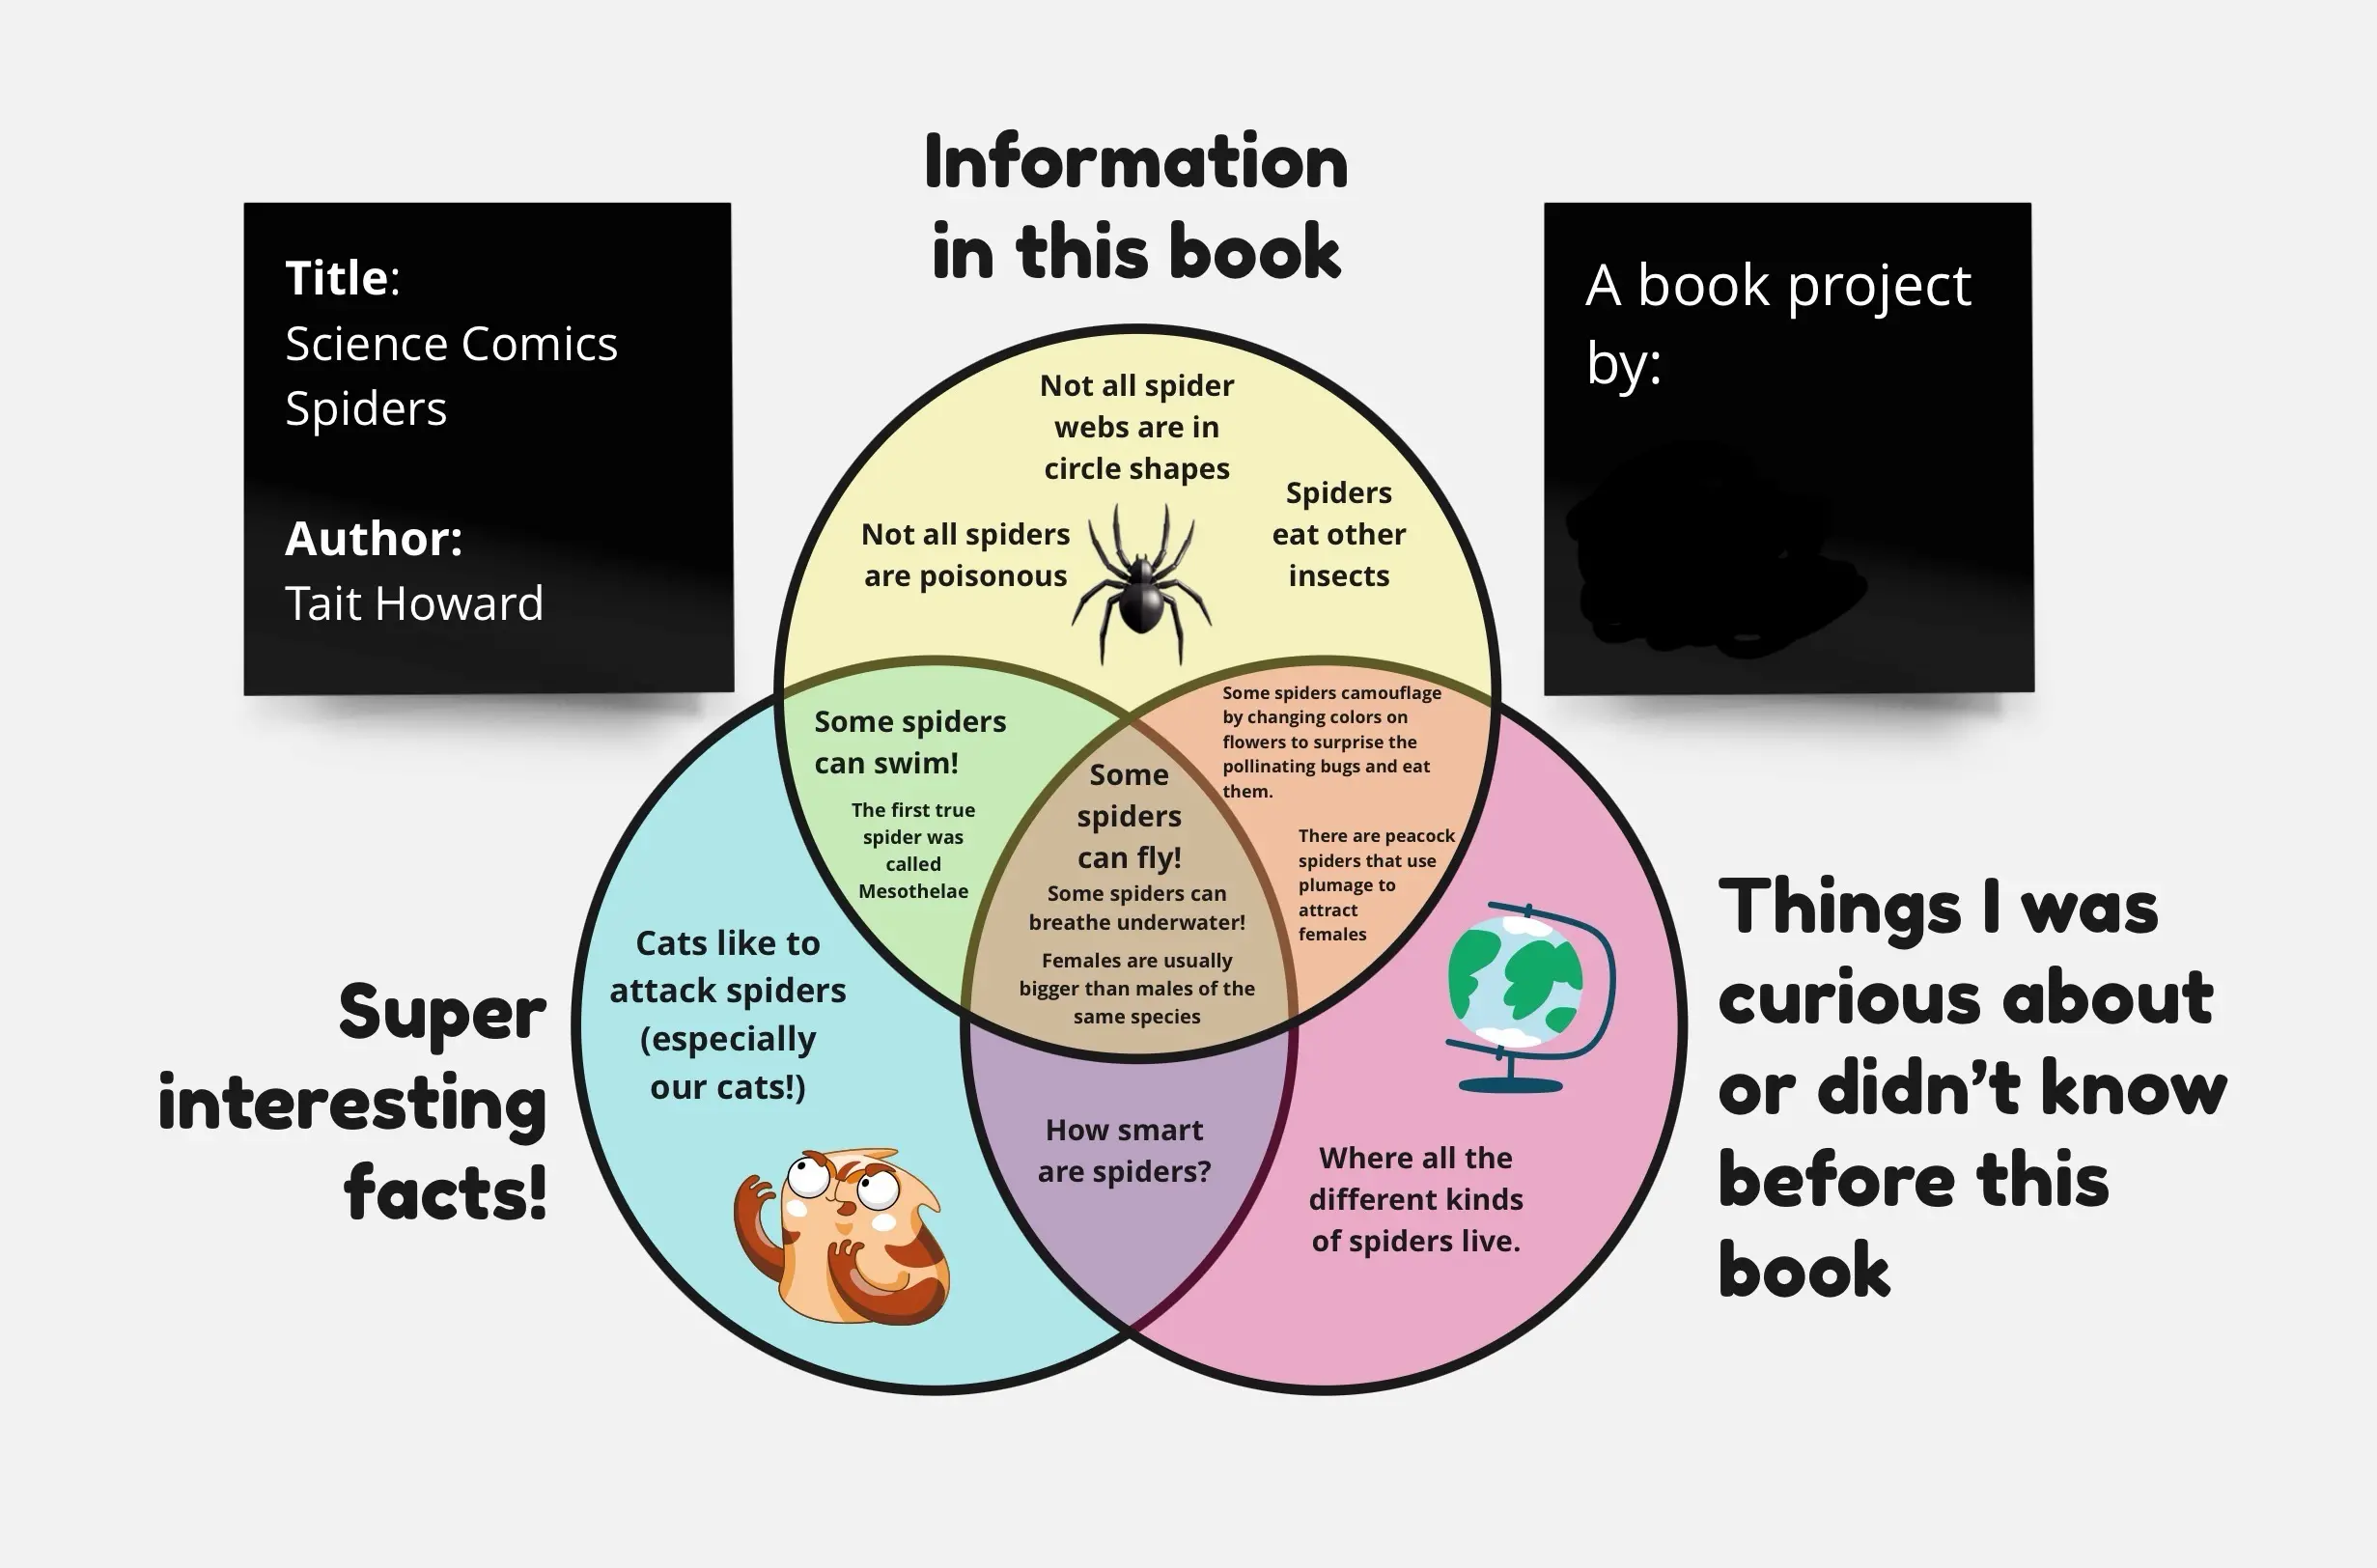
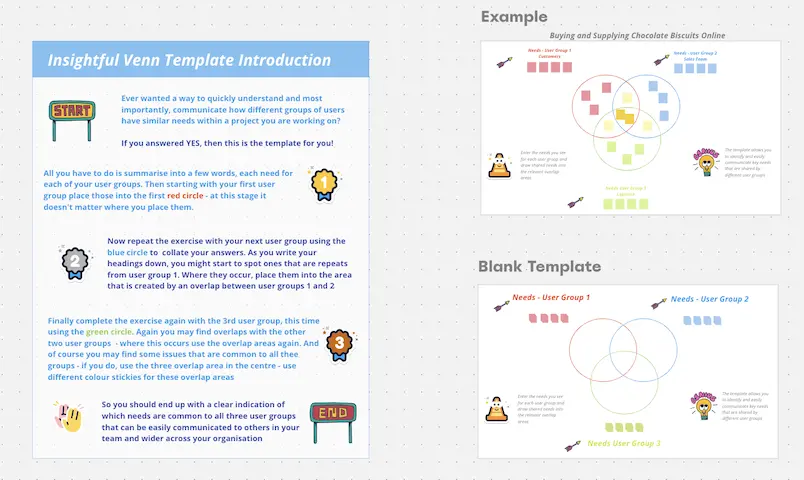
Insightful Venn
5 likes8 uses