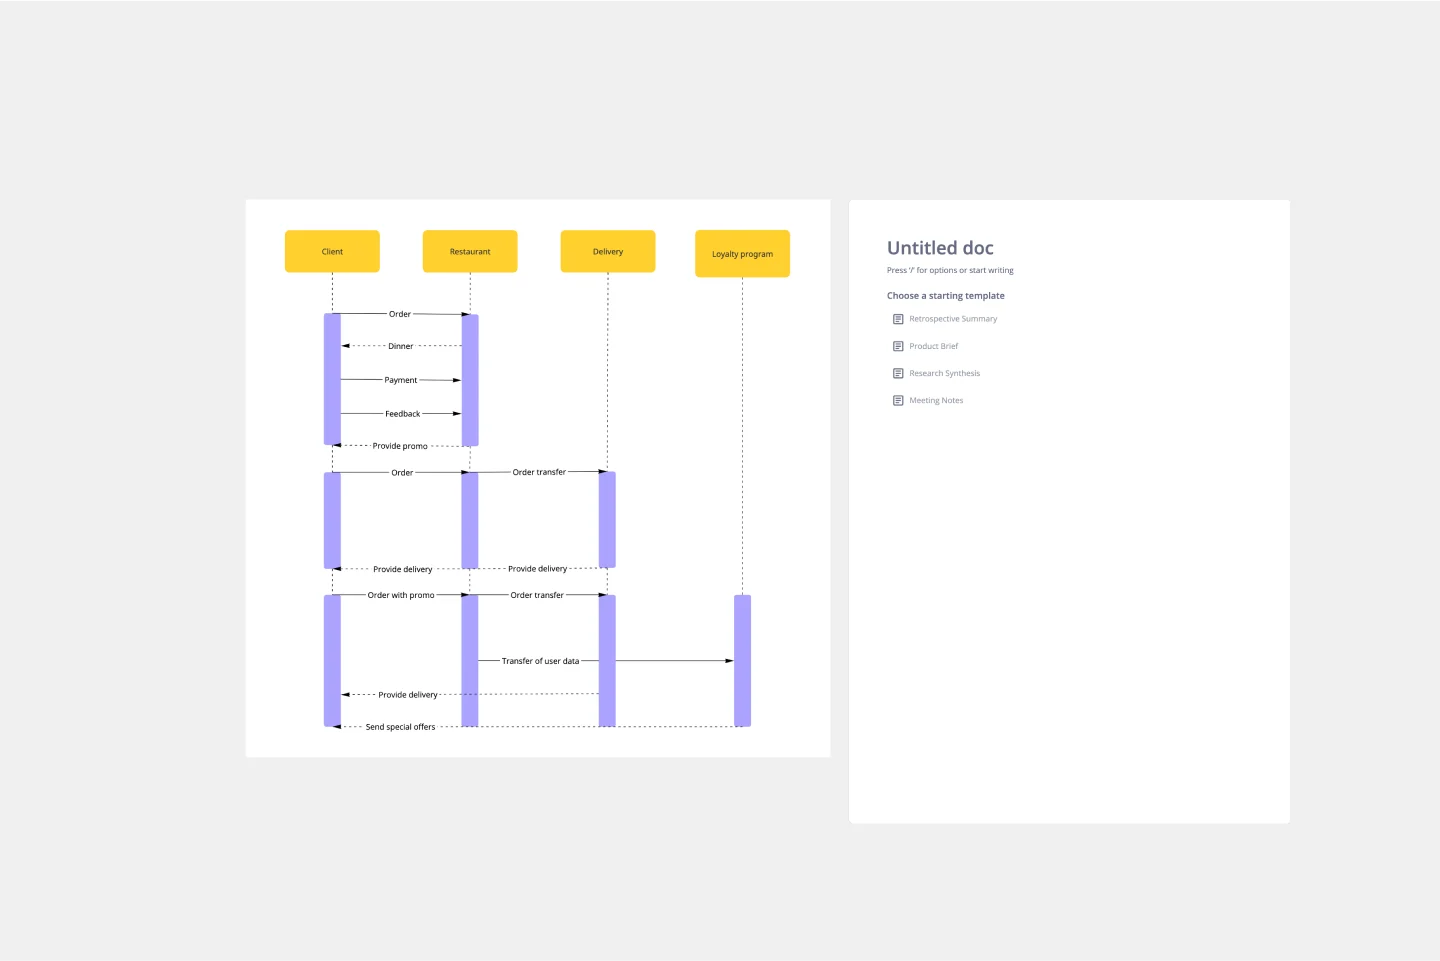
UML Sequence Rental Booking System Template
Streamline the documentation and visualization process of interactions within rental booking systems with the UML Sequence Rental Booking System Template.
Available on Enterprise, Business, Education plans.
About the UML Sequence Rental Booking System Template
The UML Sequence Rental Booking System Template in Miro is designed to streamline the process of documenting and visualizing the interactions within a car rental booking system. This template aids in mapping out the communication flow between the customer, user interface, payment service, and vehicle allocation system, ensuring a smooth and efficient workflow. By using this template, teams can understand the sequence of interactions necessary for a successful rental booking process.
How to use the UML Sequence Rental Booking System Template
Customize the template: Once the template is open on your board, you can start customizing it to fit your specific project needs. Miro allows you to add, remove, or modify the elements within the template easily. For more complex diagrams, use Miro's UML shape packs or integrate with text-to-diagram apps like PlantUML and Mermaid.
Collaborate in real time: Invite your team members to collaborate on the diagram in real-time. Miro's collaborative features enable you to work together seamlessly, regardless of your physical location. Use comments, @mentions, and live editing to gather input and make decisions efficiently.
Iterate and refine: As your project evolves, so too will your understanding of the necessary interactions within the rental booking system. Use Miro to iterate on your diagram, refining it to accurately reflect the system's architecture and flow.
Share and present: Once your diagram is complete, share it with stakeholders directly from Miro. You can also present your diagram during meetings using Miro's presentation mode, ensuring everyone is aligned on the system's design.
Why use the UML Sequence Rental Booking System Template
Clarity and understanding: The template offers a visual representation of the interactions within a rental booking system. This visual aid helps team members and stakeholders easily understand the system's flow and requirements, promoting a clear understanding of complex systems.
Efficiency: Utilizing a pre-made template saves time that would otherwise be spent on creating diagrams from scratch. This efficiency allows teams to focus more on refining the system's architecture and interactions rather than on the mechanics of diagramming.
Collaboration: Miro's collaborative environment enhances teamwork by enabling multiple users to contribute to the diagram simultaneously. This feature is especially beneficial for remote or distributed teams, as it supports real-time communication and iteration, ensuring that everyone is aligned and can contribute effectively, regardless of their location.
Get started with this template right now. Available on Enterprise, Business, Education plans.
LUMINAI Refinery Advisor on AWS Template
Works best for:
AWS
The LUMINAI Refinery Advisor on AWS template streamlines and optimizes refinery operations through AWS. It provides a structured approach to setting up and managing AWS services, tailored specifically for engineers, developers, and data scientists in the refinery sector. This template not only saves time and effort by offering a predefined structure and best practices but also allows for customization to meet specific operational needs. With its focus on enhancing data processing capabilities, the LUMINAI Refinery Advisor on AWS template is an invaluable resource for improving the efficiency, effectiveness, and optimization of refinery processes on the AWS platform.
UML Communication Diagram Template
Works best for:
Software Development, Mapping, Diagrams
Most modern programs consist of many moving parts working to a precise set of instructions. With a communication diagram, you can visualize exactly how those parts work together, giving you a clearer understanding of your program as a whole. What’s more, the diagram leaves spaces for expanding the network of relationships as your product grows and evolves. A communication diagram is a vital tool in any software designer’s arsenal.
UML Class E-Commerce System Template
Works best for:
UML
The UML Class E-Commerce System Template streamlines the process of creating and visualizing the class structure of an e-commerce system. It provides a comprehensive framework that includes typical online shop features such as product listings, inventory management, shopping carts, orders, payments, and shipping details. This template facilitates a clear understanding of how these elements interact during an online sales transaction, making it an invaluable tool for teams working on e-commerce projects. By using this template, teams can save time, enhance collaboration, and ensure that their system architecture is robust and efficient, ready to adapt to their business's evolving needs.
Data Org Chart
Works best for:
Org Charts, Operations, Mapping
The Data Org Chart template provides a visual representation of data-related roles and relationships within an organization. By mapping out data management responsibilities and dependencies, teams can enhance data governance and improve collaboration. With features for customizing data roles and connections, this template empowers teams to optimize data processes and ensure data integrity and compliance.
Crowd Sourced Cause and Effect
Works best for:
Fishbone Diagram, Problem solving
The Crowd Sourced Cause and Effect template leverages collective intelligence to identify root causes of problems. By involving multiple team members, you can gather diverse perspectives and uncover insights that might be overlooked. This collaborative approach ensures a comprehensive analysis and fosters team engagement.
Insightful Venn
Works best for:
Venn Diagram
Discover insights and visualize data relationships with the Insightful Venn template. This tool helps you compare multiple datasets, identify intersections, and understand unique and common elements. Use it for data analysis, research, and presentations to communicate complex information effectively. Perfect for analysts, educators, and researchers aiming to convey data-driven insights visually.