About the Tier List Template
A tier list template is a tool that enables teams to categorize and prioritize ideas, tasks, or even competitive players visually, which can promote transparent and productive discussions.
Use this template to bring clarity to complex scenarios, fostering meaningful conversations and helping decision-making processes. It provides teams with an intuitive and interactive chart-like tier ranking for insights.
What's a tier list template?
A ranking template allows teams to categorize items into specific categories or "tiers." It functions like a chart where people can place items into levels based on their importance or performance. From project management tasks to gaming rankings, the versatility of this template makes it a must-have addition to any Miro board.
How to use the tier list template in Miro
Click on the Template Library and search for "Tier List Template" in the search bar. Or click on the "Use Template" button on this page to use the template for your chosen Miro board in your browser.
1. Editing the tier list
The template, once selected, is ready for use. Type in the items directly on the board or use the drag-and-drop feature to move sticky notes into the template. The latter helps transition from brainstorming sessions to organizing thoughts or ideas.
2. Ranking the items
Items are then arranged into different tiers based on the chosen criteria. The drag-and-drop feature lets users move items between tiers quickly, facilitating adjustments as discussions evolve or when new information is available.
3. Customize your template
The tier list template is flexible and easy to edit. Use the context menu bar to rename or add more tiers, change the colors of the items, and customize your font style and size as you see fit.
4. Collaborate and share
Invite team members to join you on the board and work in real time. Or share your work by sending your board link or downloading your Tier List Template as an image or PDF.
Discover also Miro's brainstorming tool to capture additional ideas.
Tier List Template FAQs
Is it possible to customize the names of the tiers in the template?
Yes, the tier list in Miro lets you rename tiers to match your project's needs.
Can multiple people collaborate on the tier list simultaneously?
Yes, Miro supports real time collaboration, allowing multiple users to work on the same board at the same time.
Is it possible to share the tier list with people who do not have a Miro account?
Yes, a public link to the Miro board can be shared with non-Miro users for viewing the tier list. If editing rights are required, a free Miro account must be created.

Miro
Your virtual workspace for innovation
Miro is an innovation workspace designed for teams of every size, everywhere, to dream, design, and build the future together. Our mission? To empower these teams to create the next big thing, powered by AI at every step of the way. Over 90 million users around the world rely on Miro to untangle complex ideas, put customer needs first, and deliver products and services faster. All supported by best-in-class security, compliance, and scalability.
Categories
Similar templates
Alignment Chart Template

Alignment Chart Template
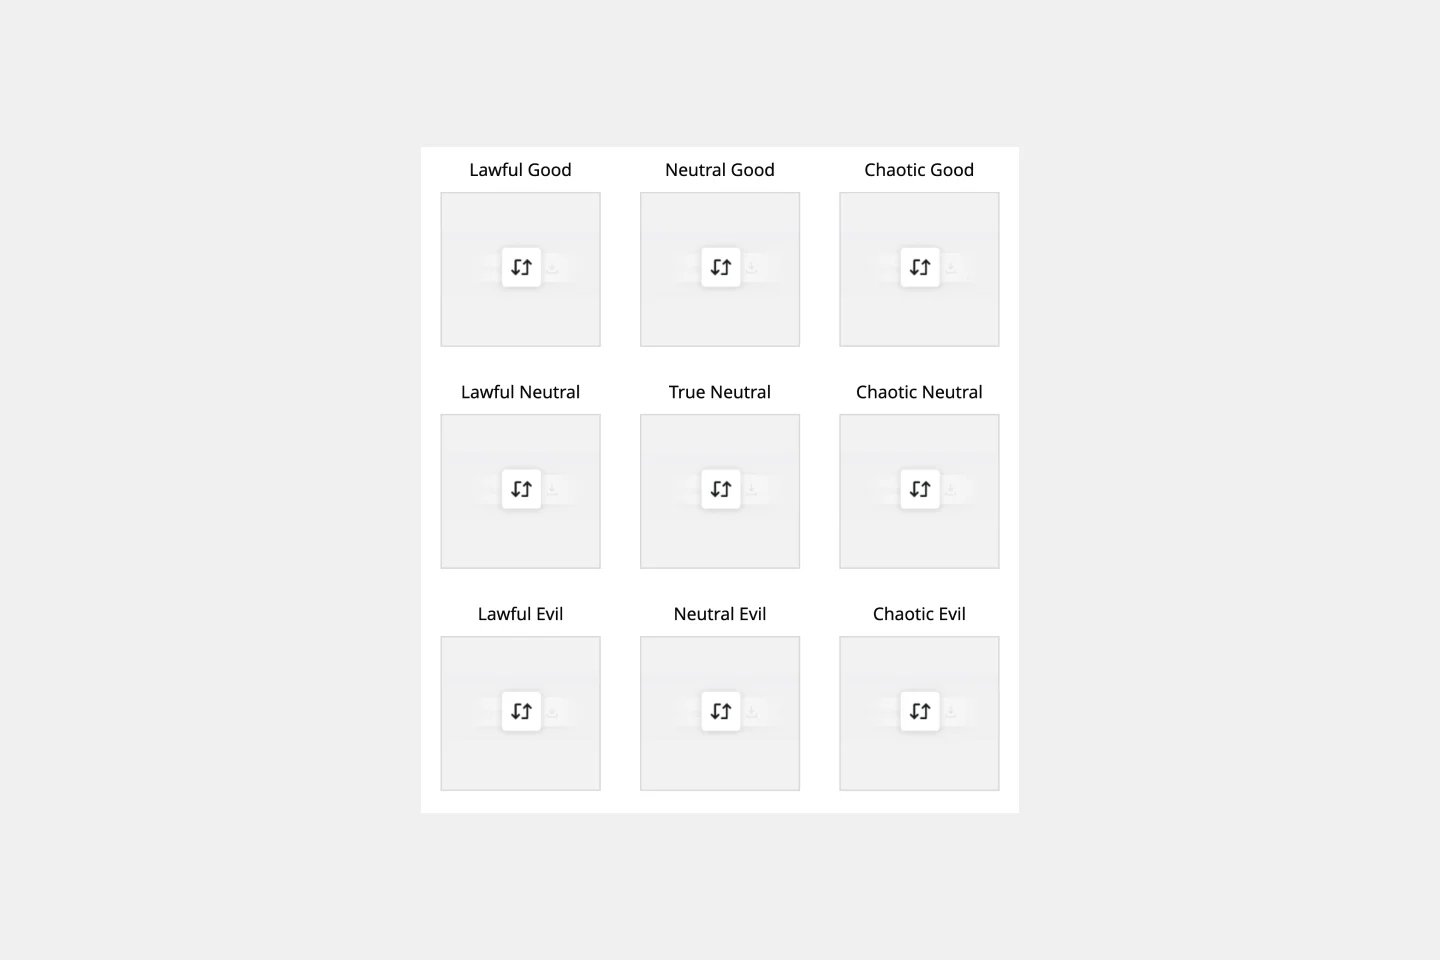
The alignment chart originated in the Dungeons & Dragons (D&D) fantasy role-playing game to allow players to categorize their characters according to their ethical and moral perspectives. Since then, people around the world have begun to use the alignment chart as a fun way to describe their own characteristics and personas, as well as fictional characters, famous people, and much more. In the conventional set-up, you figure out your placement in the alignment chart based on your views on law, chaoss, good, and evil. But you can adapt the alignment chart to reflect any characteristics you wish to use to create personas.
Milestone Chart Template

Milestone Chart Template
When your team is collaborating on a large project, keeping track of the many tasks and multiple timelines can be a challenge. That’s why you need a milestone chart. These visual representations of important project events will make it simple for your team to stay on schedule and reach goals on time. And it’s so easy to get started — just determine the major milestones, use our template to create a milestone chart, and define the key dates and deliverables each milestone will require.
T-Chart Template

T-Chart Template
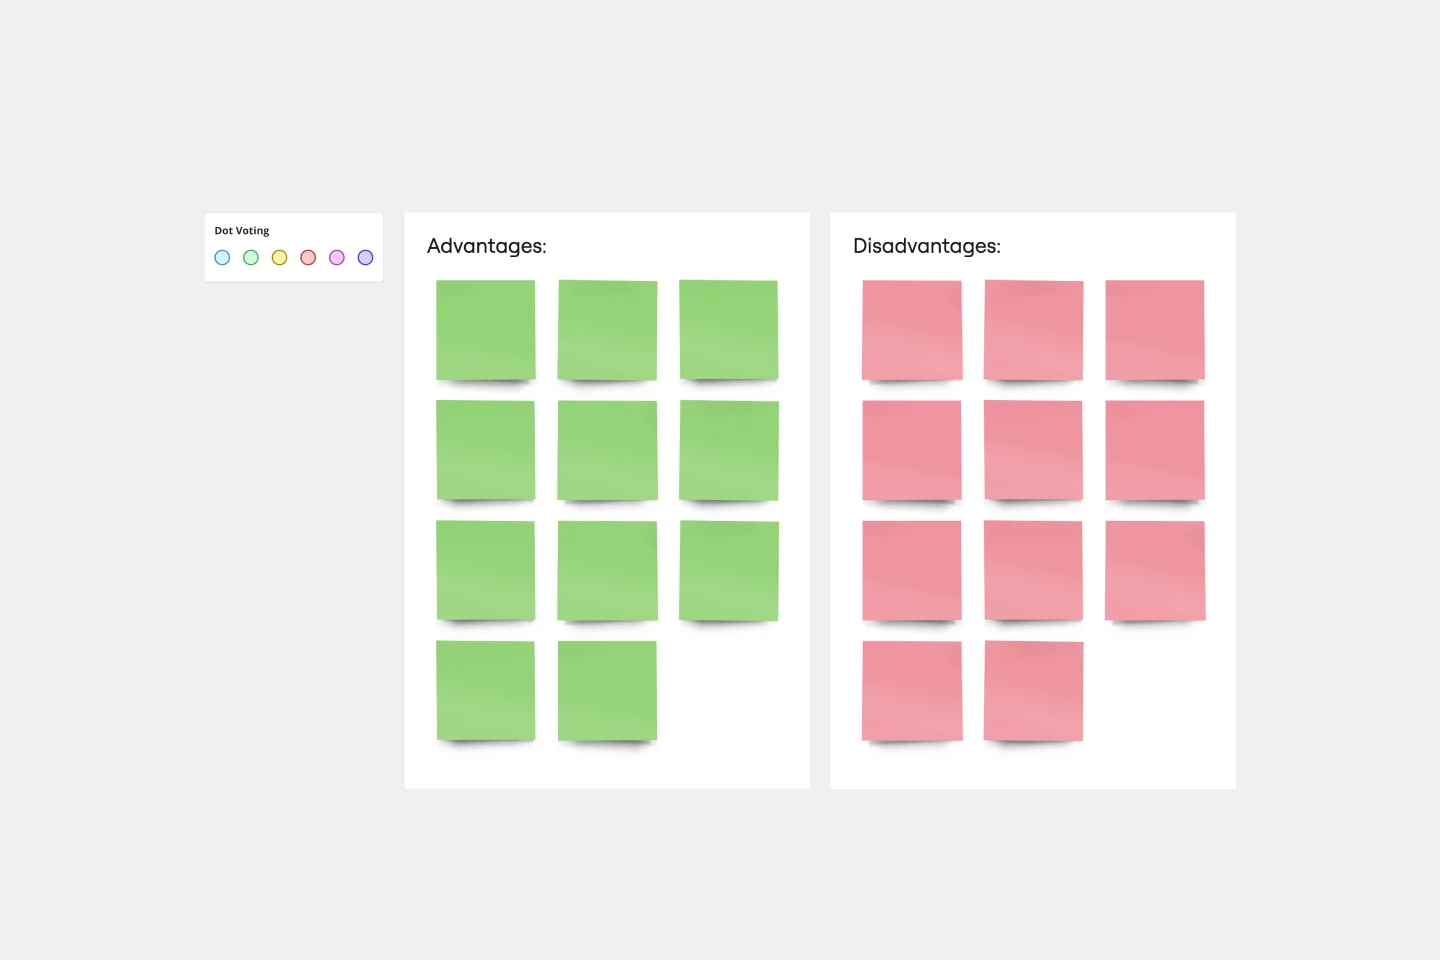
T-Charts can help you compare and contrast two different ideas, group information into different categories, and prove a change through “before” and “after” analysis. T-Charts are visual organizational tools that enable you to compare ideas, so you can evaluate pros and cons, facts and opinions, strengths and weaknesses, or big-picture views versus specific details. Designers and content creators can use T-Charts to turn possibilities into actionable ideas. T-Charts are useful for discussing differences and similarities with your team or clients and can help you to reach a decision together.
KWL Chart Template

KWL Chart Template
Sharing and learning new knowledge is the fuel in the tank of any ambitious team or organization. A KWL chart is a graphical organizer that powers the learning process. This easy template lets you design and use a KWL, with three columns: Know, Want to Know, and Learned. Then you and your team will fill in each column by following three steps: Take stock of what you know, document what you want to get out of your session, and finally, record what you’ve learned.
Comparison Chart Template

Comparison Chart Template
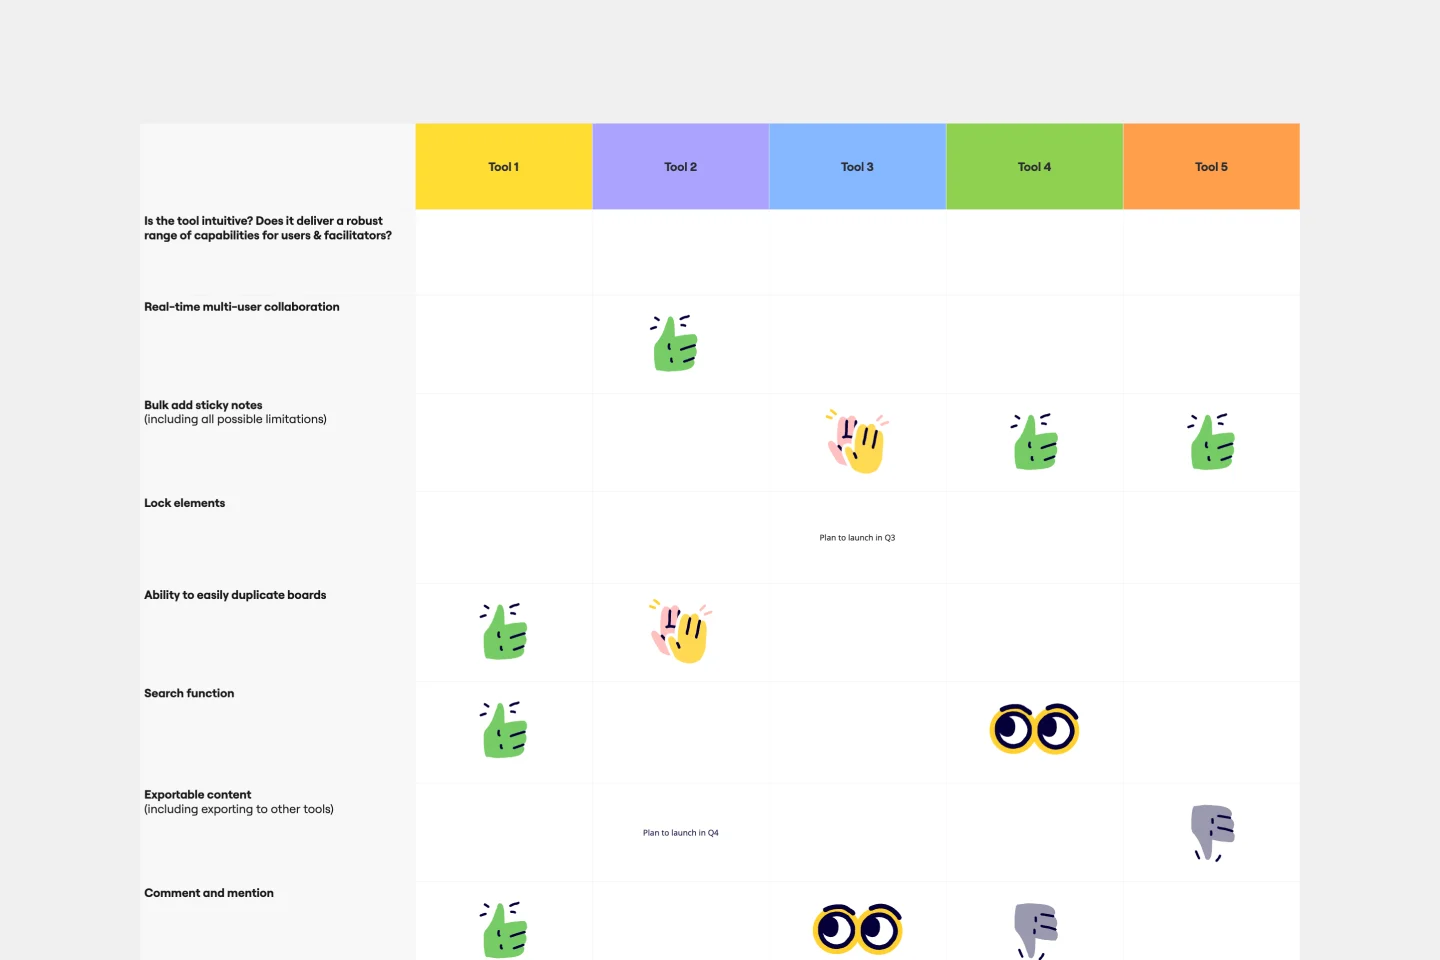
Eliminate wasted time and learn to make snap decisions both with your team and on your own. Comparison charts are perfect for collaboration, as they allow you to establish differences between ideas or products and get a full picture of the risks and benefits that come with them.
Alignment Chart Template

Alignment Chart Template
The alignment chart originated in the Dungeons & Dragons (D&D) fantasy role-playing game to allow players to categorize their characters according to their ethical and moral perspectives. Since then, people around the world have begun to use the alignment chart as a fun way to describe their own characteristics and personas, as well as fictional characters, famous people, and much more. In the conventional set-up, you figure out your placement in the alignment chart based on your views on law, chaoss, good, and evil. But you can adapt the alignment chart to reflect any characteristics you wish to use to create personas.
Milestone Chart Template

Milestone Chart Template
When your team is collaborating on a large project, keeping track of the many tasks and multiple timelines can be a challenge. That’s why you need a milestone chart. These visual representations of important project events will make it simple for your team to stay on schedule and reach goals on time. And it’s so easy to get started — just determine the major milestones, use our template to create a milestone chart, and define the key dates and deliverables each milestone will require.
T-Chart Template

T-Chart Template
T-Charts can help you compare and contrast two different ideas, group information into different categories, and prove a change through “before” and “after” analysis. T-Charts are visual organizational tools that enable you to compare ideas, so you can evaluate pros and cons, facts and opinions, strengths and weaknesses, or big-picture views versus specific details. Designers and content creators can use T-Charts to turn possibilities into actionable ideas. T-Charts are useful for discussing differences and similarities with your team or clients and can help you to reach a decision together.
KWL Chart Template

KWL Chart Template
Sharing and learning new knowledge is the fuel in the tank of any ambitious team or organization. A KWL chart is a graphical organizer that powers the learning process. This easy template lets you design and use a KWL, with three columns: Know, Want to Know, and Learned. Then you and your team will fill in each column by following three steps: Take stock of what you know, document what you want to get out of your session, and finally, record what you’ve learned.
Comparison Chart Template

Comparison Chart Template
Eliminate wasted time and learn to make snap decisions both with your team and on your own. Comparison charts are perfect for collaboration, as they allow you to establish differences between ideas or products and get a full picture of the risks and benefits that come with them.