About the Supply Chain Diagram Template
The supply chain diagram template is essential for businesses to visualize the movement of goods, information, and finances from supplier to customer. This visual representation plays a crucial role in optimizing operations, identifying bottlenecks, and improving the overall efficiency of the supply chain. The template itself is a pre-designed framework that outlines the critical components of the supply chain, providing a starting point for a detailed analysis.
This template for supply chain management includes various areas such as suppliers, manufacturers, distribution centers, and retail outlets, all of which are linked by transport. Each area can be further detailed with specific processes, timelines, and resources. The template can be used to break down each part of the supply chain to better understand and improve the complexities of product flow, communication channels, and financial transactions.
How to use the supply chain diagram template in Miro
Begin by selecting the Supply Chain Diagram Template from the template gallery.
Place the template on the board with just one click and immediately start customizing the diagram.
Edit text within pre-existing nodes to reflect the specific elements of your supply chain, from suppliers to end consumers.
Expand the template effortlessly by dragging new branches from the automated diagramming tools to add additional nodes.
Connect these nodes with connector lines to depict the flow and relationships within your supply chain.
Integrate artifacts such as images, documents, or links onto the board to provide deeper context and enrich the diagram with more information.
The ease of editing and customizing the template with just a few clicks allows for a streamlined approach to creating a detailed supply chain diagram, making it an efficient and intuitive experience.
Why should you use a supply chain diagram template?
There are several key benefits to using a Supply Chain Diagram Template:
The supply chain diagram template offers several benefits that can streamline the process of creating visual representations of complex supply chain structures.
Clarity: The template provides a clear visual representation of the supply chain process, making it easier to comprehend and communicate the process in a straightforward manner.
Efficiency: The template saves valuable time in designing and laying out the supply chain diagram, accelerating the process of creating it.
Customization: The template is highly customizable, which allows businesses to tailor the diagram to their specific needs and highlight particular areas of interest.
Optimization: The template helps identify bottlenecks and inefficiencies within the supply chain, making it more straightforward to pinpoint areas requiring targeted improvements.
Collaboration: The template facilitates real-time collaboration among team members who can view, edit, and comment on the diagram, leading to more cohesive planning and decision-making.
If you'd prefer to start from scratch, Miro's diagramming tools are easy to use and come with a wide range of diagramming shapes in Miro's extensive library, so you'll find just what you need.
Supply Chain Diagram Template FAQs
Can the supply chain diagram template accommodate multiple layers of suppliers and distributors?
The template is designed to be scalable. It can be extended to include as many layers as needed, providing a comprehensive view of extended supply networks.
Is technical expertise required to use this template effectively?
Not at all. The template is user-friendly and designed for people at all skill levels. Anyone can use it with minimal guidance, making it accessible to all professionals.
How can multiple users collaborate on the same supply chain diagram?
The template supports real-time collaboration. Multiple users can access and edit the diagram simultaneously, with changes being reflected instantly for all to see.
Are there limitations to how much I can customize the supply chain diagram template?
The template is highly flexible, allowing for extensive customization. You can change the colors, shapes, and sizes of nodes and connectors and add detailed descriptions, links, or other pertinent information to each diagram element.

Miro
Your virtual workspace for innovation
Miro is an innovation workspace designed for teams of every size, everywhere, to dream, design, and build the future together. Our mission? To empower these teams to create the next big thing, powered by AI at every step of the way. Over 90 million users around the world rely on Miro to untangle complex ideas, put customer needs first, and deliver products and services faster. All supported by best-in-class security, compliance, and scalability.
Categories
Similar templates
Block Diagram Template

Block Diagram Template
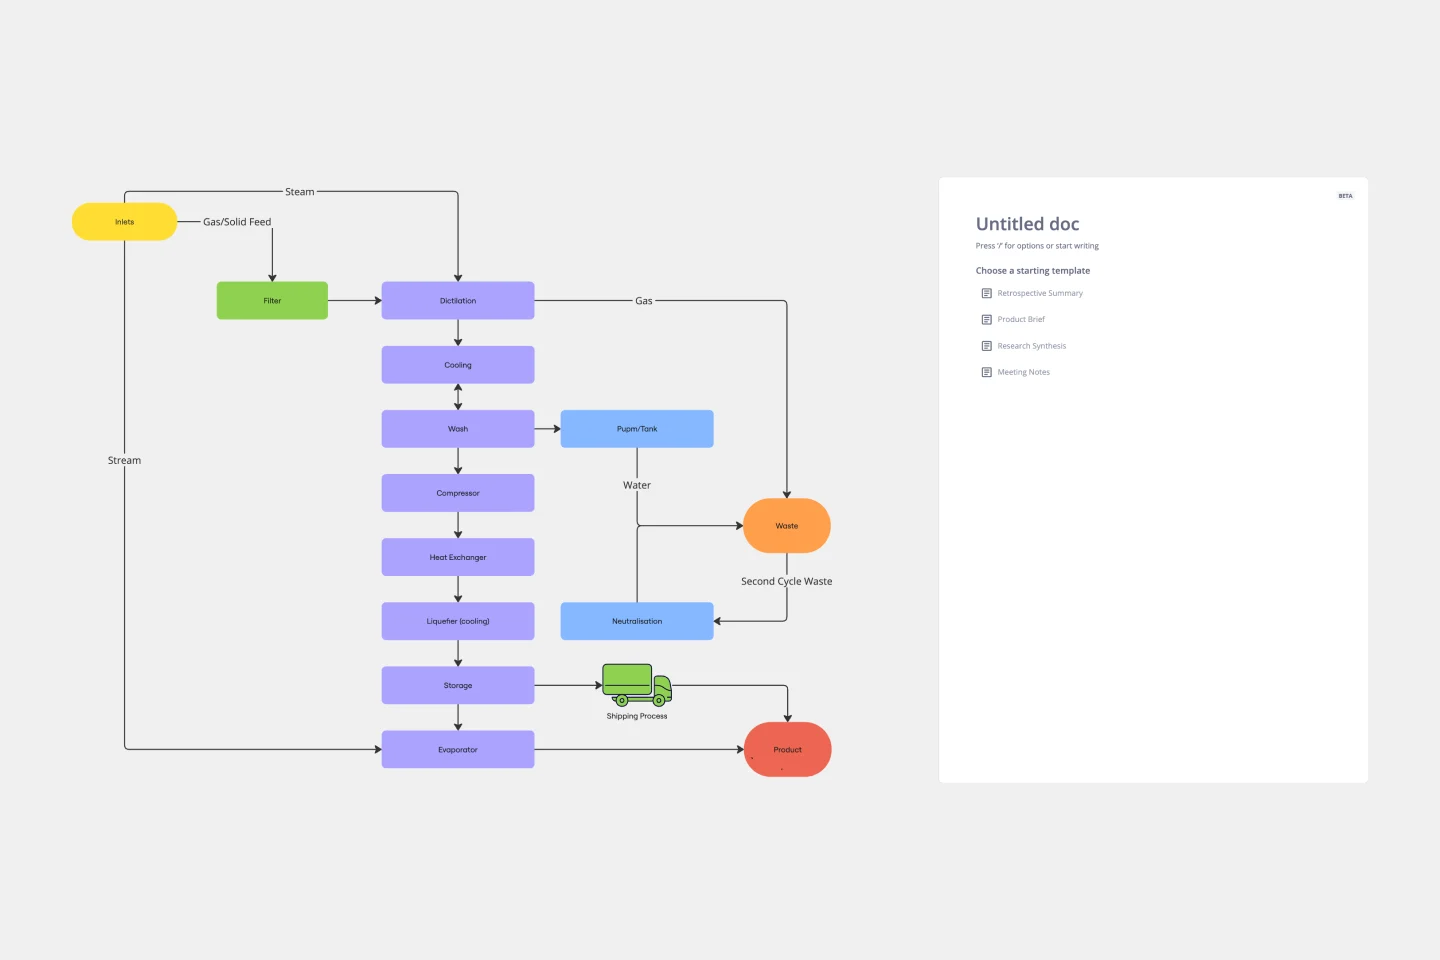
Use this template to illustrate technical systems. Blocks represent important objects in the system, and arrows demonstrate how the objects relate to each other. Perfect for engineers, workflow managers, or anyone trying to build a better process.
UML Diagram Template

UML Diagram Template
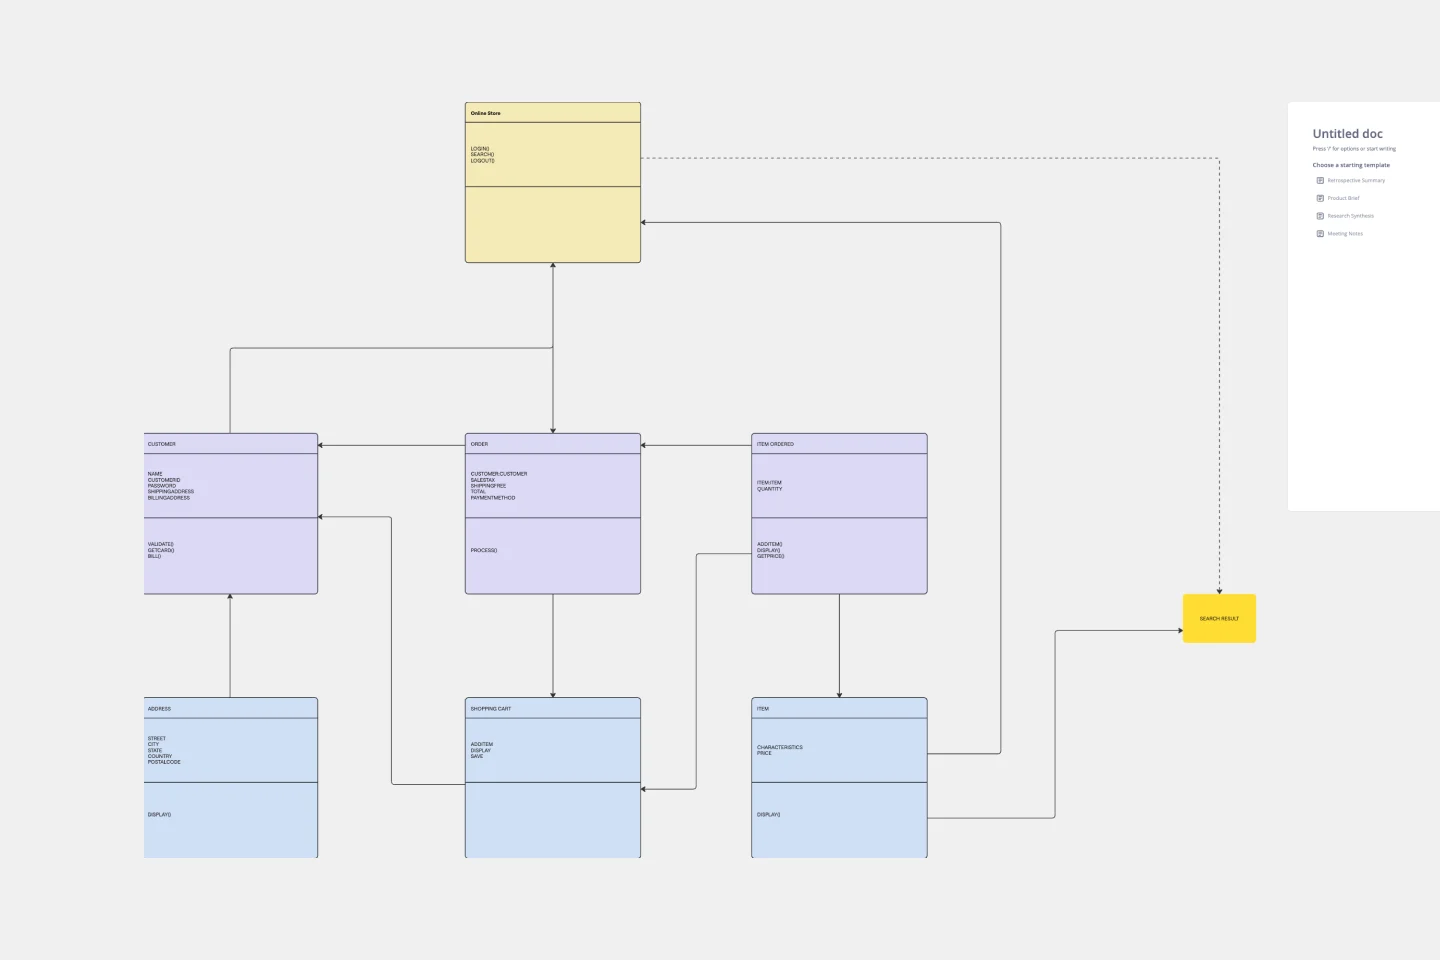
Originally used as a modeling language in software engineering, UML has become a popular approach to application structures and documenting software. UML stands for Unified Modeling Language, and you can use it to model business processes and workflows. Like flowcharts, UML diagrams can provide your organization with a standardized method of mapping out step-by-step processes. They allow your team to easily view the relationships between systems and tasks. UML diagrams are an effective tool that can help you bring new employees up to speed, create documentation, organize your workplace and team, and streamline your projects.
Company Organizational Chart

Company Organizational Chart
An org chart is a visual guide that sums up a company’s structure at a glance—who reports to whom and who manages what teams. But it does more than just display the chain of command. It also showcases the structure of different departments and informs employees who to reach out to with issues and concerns. That makes it an especially valuable tool for new hires who are getting familiar with the company. Our templates make it easy for you to add your entire team and customize the chart with colors and shapes.
Azure Data Flow Template

Azure Data Flow Template
The Azure Data Flow is a diagram that will allow you to combine data and build and deploy custom machine learning models at scale. Azure is Microsoft’s cloud computing platform, designed to provide many cloud-based services like remote storage, database hosting, and centralized account management. Azure also offers new capabilities like AI and the Internet of Things (IoT).
Azure Architecture Diagram Template

Azure Architecture Diagram Template
The Azure Architecture Diagram Template is a diagram that will help you visualize the combination of any data and build and deploy custom machine learning models at scale. Azure is Microsoft’s cloud computing platform, designed to provide cloud-based services such as remote storage, database hosting, and centralized account management. Use Azure Architecture Diagram template to build sophisticated, transformational apps.
UML Activity Diagram Template

UML Activity Diagram Template
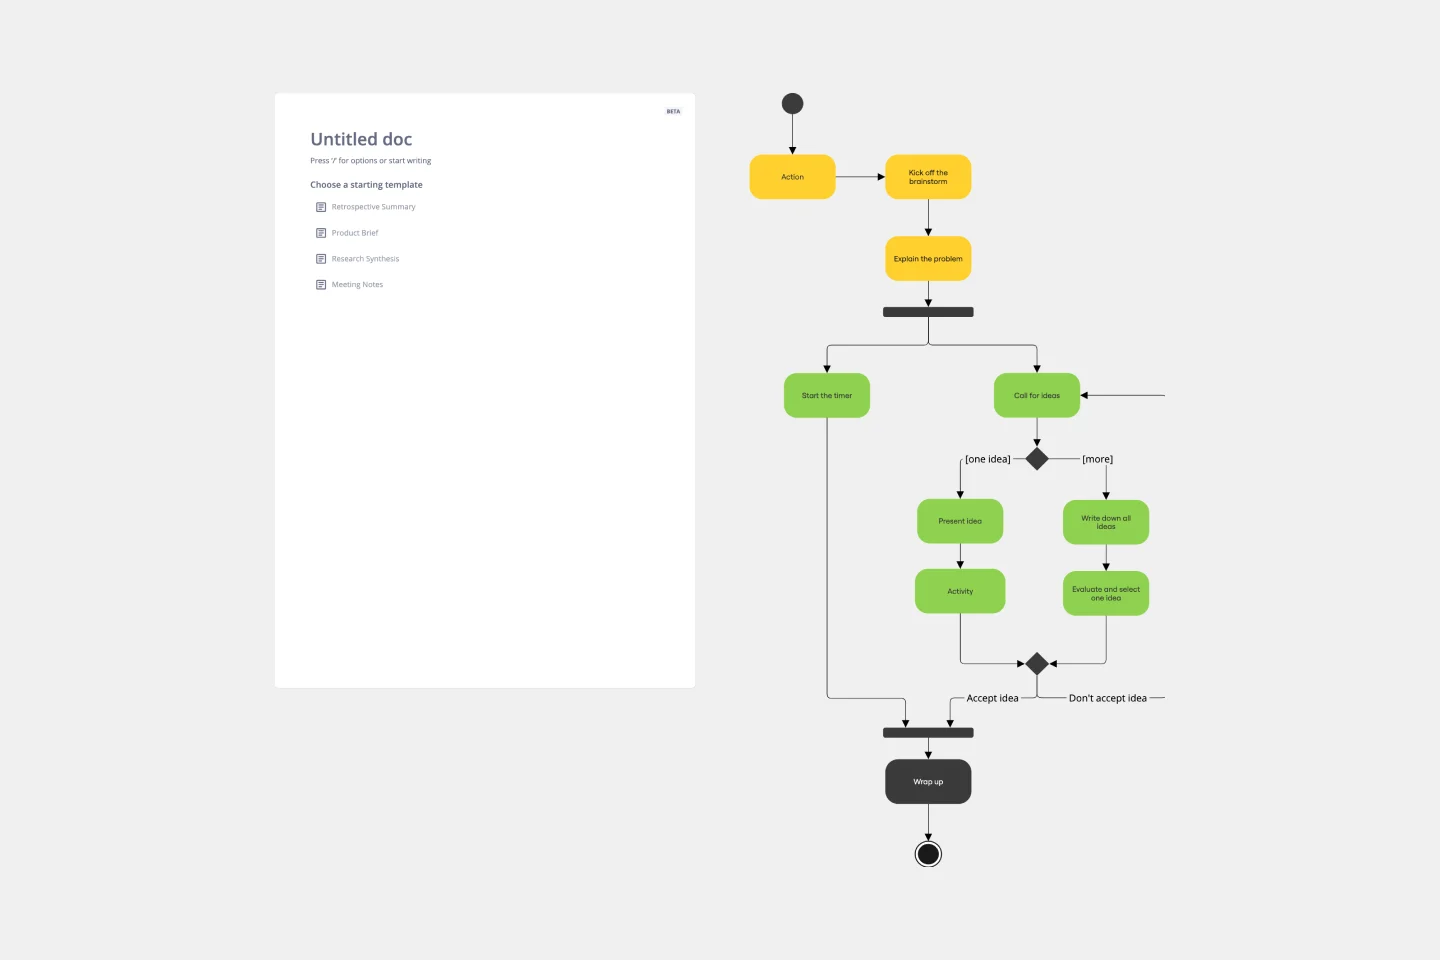
Use our Activity Diagram template to break down activities into smaller decisions and subprocesses. Improve and optimize systems and processes in I.T., business management, and more.
UML Component Diagram Template

UML Component Diagram Template
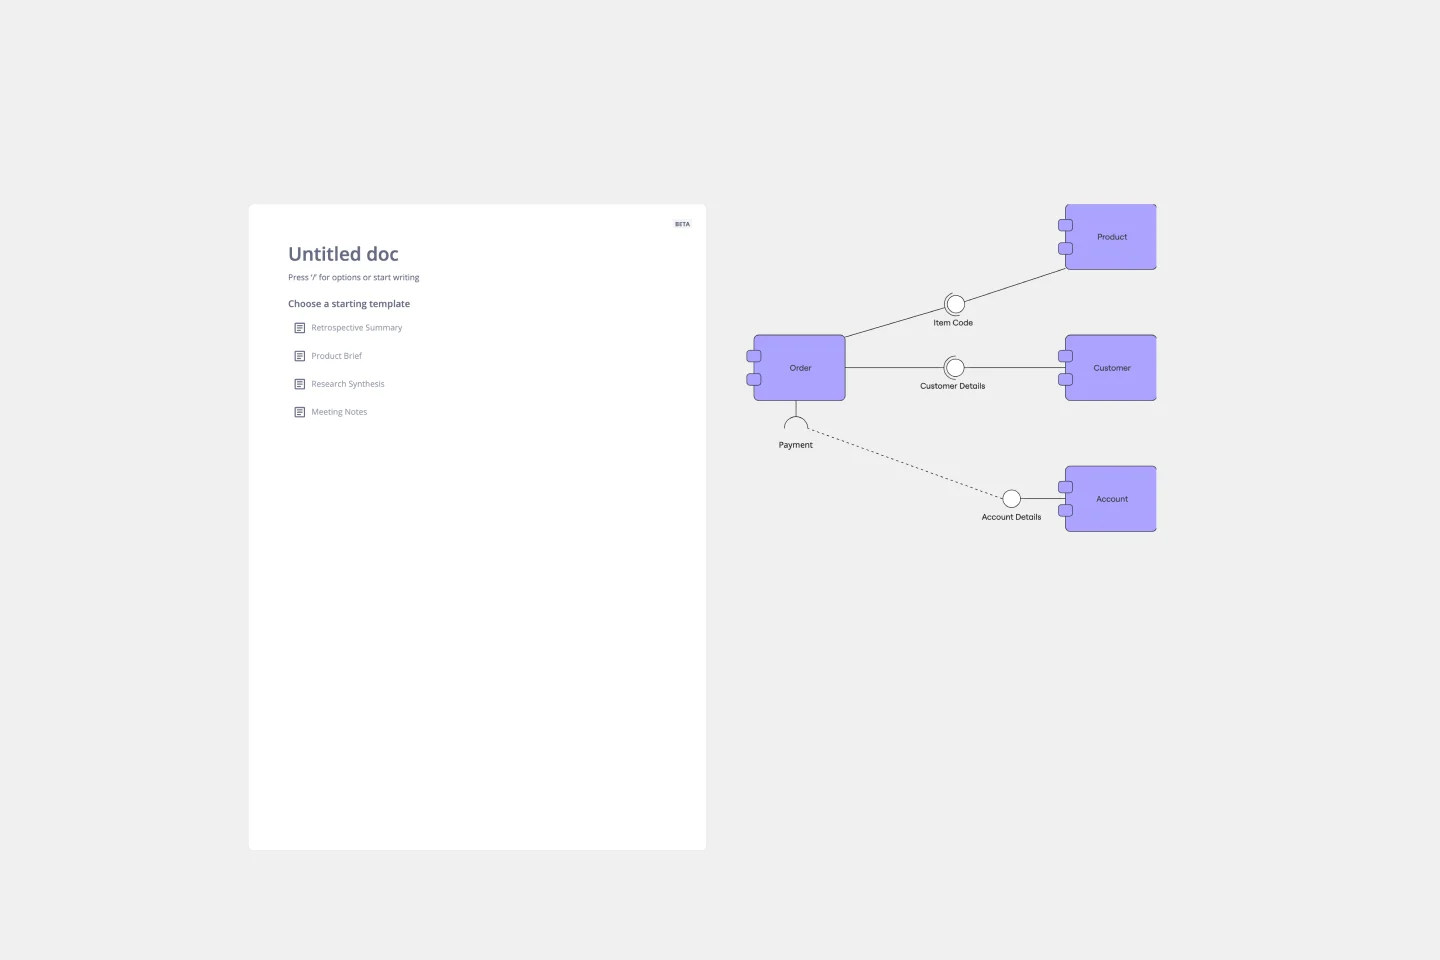
Use our Component Diagram template to show how a system’s physical components are organized and wired together. Visualize implementation details, make sure planned development matches system needs, and more — all in a collaborative environment.
Block Diagram Template

Block Diagram Template
Use this template to illustrate technical systems. Blocks represent important objects in the system, and arrows demonstrate how the objects relate to each other. Perfect for engineers, workflow managers, or anyone trying to build a better process.
UML Diagram Template

UML Diagram Template
Originally used as a modeling language in software engineering, UML has become a popular approach to application structures and documenting software. UML stands for Unified Modeling Language, and you can use it to model business processes and workflows. Like flowcharts, UML diagrams can provide your organization with a standardized method of mapping out step-by-step processes. They allow your team to easily view the relationships between systems and tasks. UML diagrams are an effective tool that can help you bring new employees up to speed, create documentation, organize your workplace and team, and streamline your projects.
Company Organizational Chart

Company Organizational Chart
An org chart is a visual guide that sums up a company’s structure at a glance—who reports to whom and who manages what teams. But it does more than just display the chain of command. It also showcases the structure of different departments and informs employees who to reach out to with issues and concerns. That makes it an especially valuable tool for new hires who are getting familiar with the company. Our templates make it easy for you to add your entire team and customize the chart with colors and shapes.
Azure Data Flow Template

Azure Data Flow Template
The Azure Data Flow is a diagram that will allow you to combine data and build and deploy custom machine learning models at scale. Azure is Microsoft’s cloud computing platform, designed to provide many cloud-based services like remote storage, database hosting, and centralized account management. Azure also offers new capabilities like AI and the Internet of Things (IoT).
Azure Architecture Diagram Template

Azure Architecture Diagram Template
The Azure Architecture Diagram Template is a diagram that will help you visualize the combination of any data and build and deploy custom machine learning models at scale. Azure is Microsoft’s cloud computing platform, designed to provide cloud-based services such as remote storage, database hosting, and centralized account management. Use Azure Architecture Diagram template to build sophisticated, transformational apps.
UML Activity Diagram Template

UML Activity Diagram Template
Use our Activity Diagram template to break down activities into smaller decisions and subprocesses. Improve and optimize systems and processes in I.T., business management, and more.
UML Component Diagram Template

UML Component Diagram Template
Use our Component Diagram template to show how a system’s physical components are organized and wired together. Visualize implementation details, make sure planned development matches system needs, and more — all in a collaborative environment.