Back to Strategy & planning
Stakeholder map templates
Navigate relationships and priorities with ease using our stakeholder map templates. Equip your team with the tools to identify, analyze, and engage stakeholders effectively, ensuring alignment and collaboration throughout your projects.
41 templates
Stakeholder Mapping Template
3 likes196 uses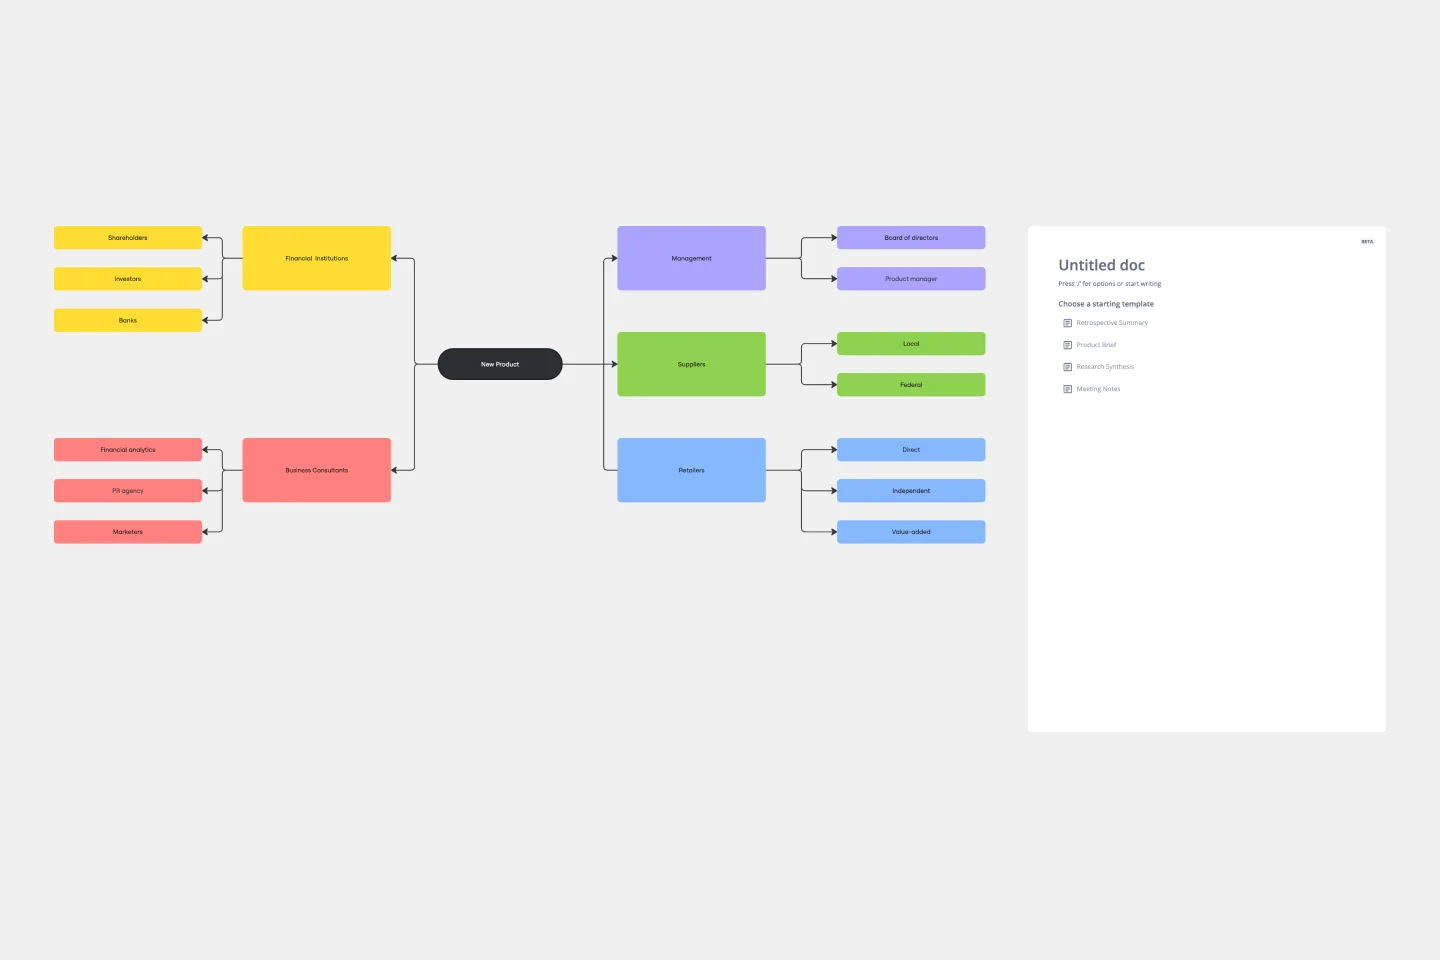
Stakeholder Analysis Template
5 likes251 uses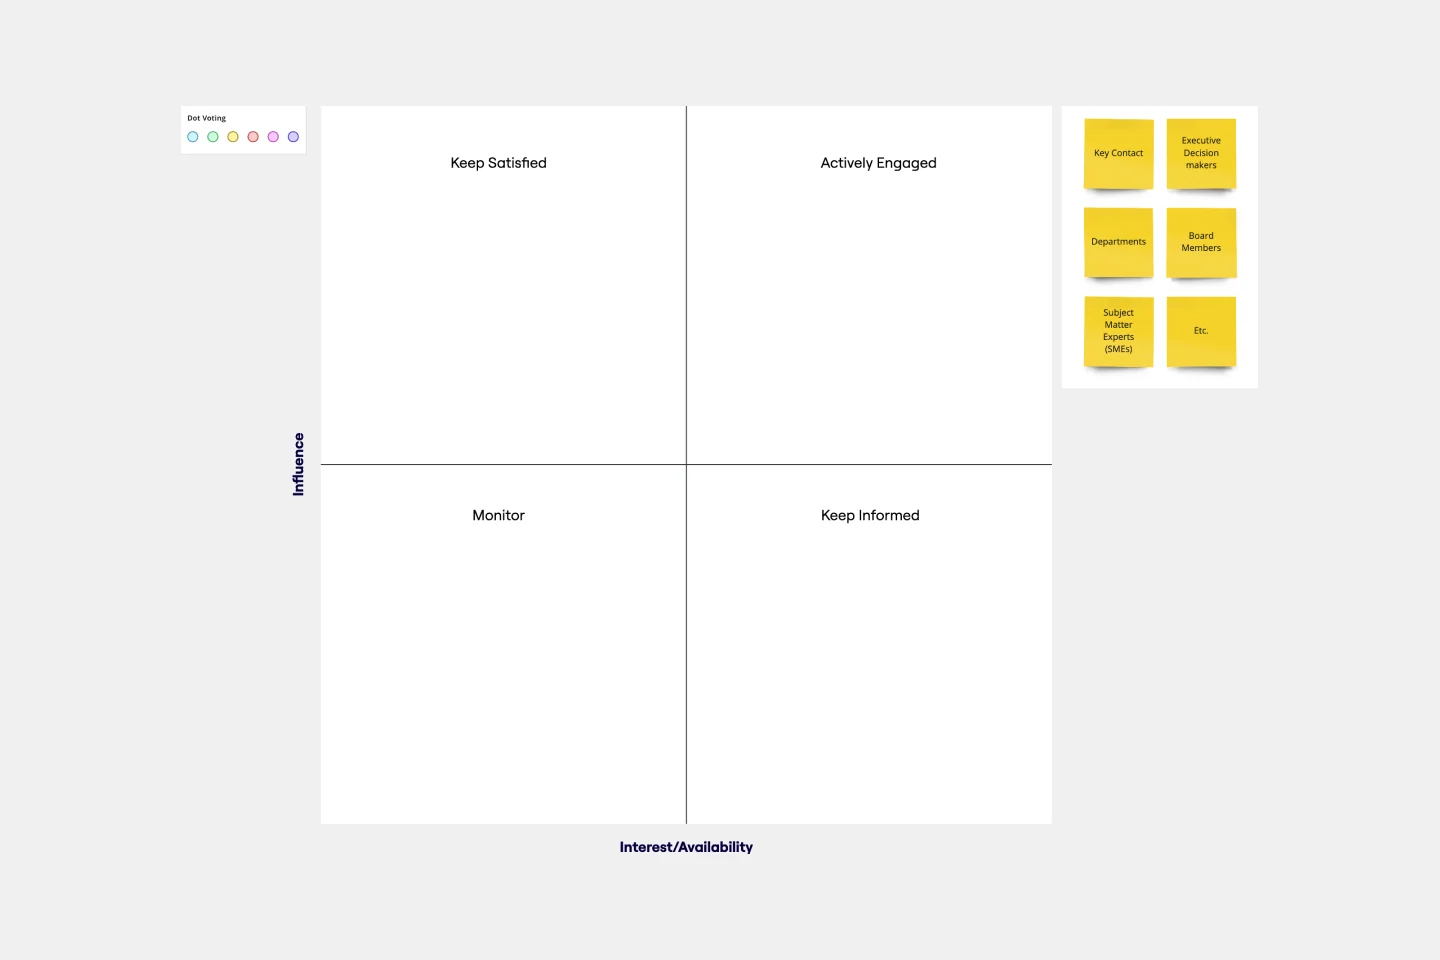
Stakeholder Analysis Template
1 likes18 uses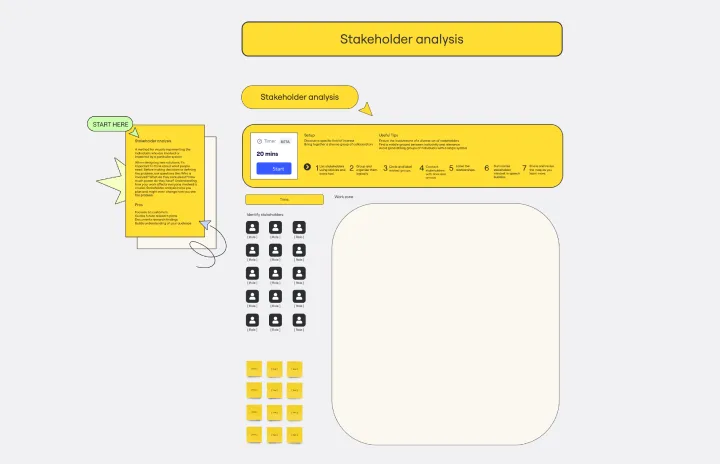
Stakeholder RACI Map
513 likes3.5K uses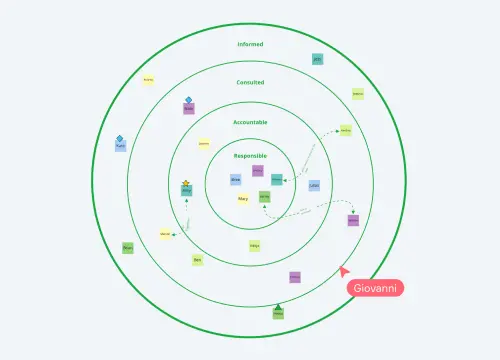
Stakeholder Map
368 likes3.1K uses
Stakeholder Map
122 likes1K uses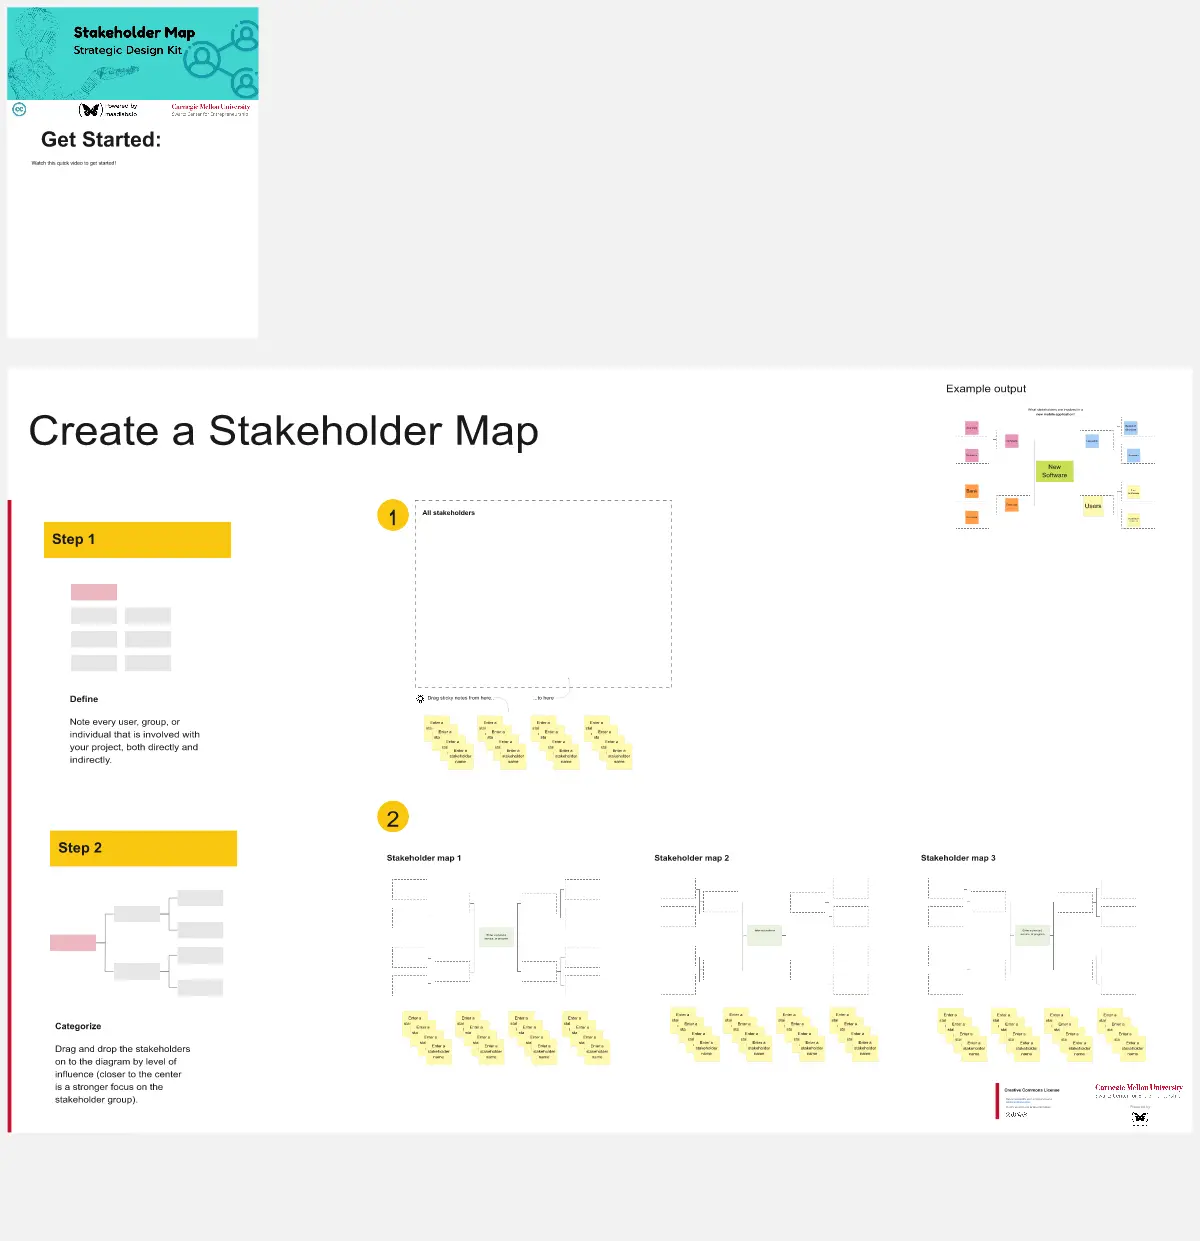
Stakeholder Canvas
47 likes516 uses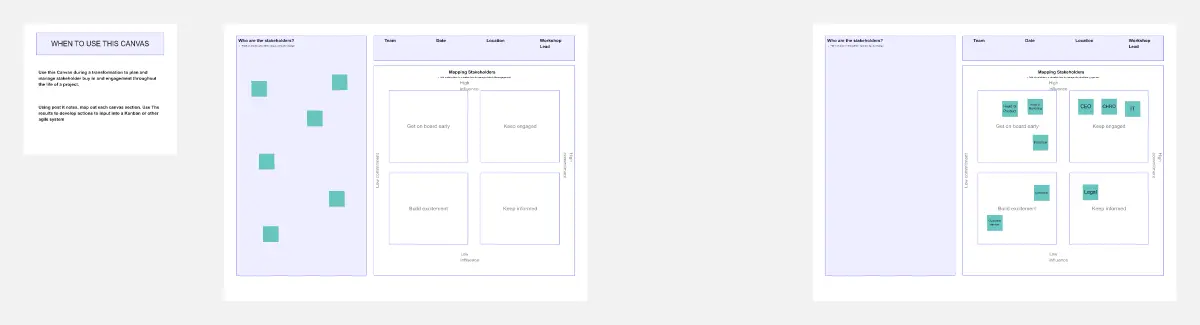
Climate Adaptation Stakeholder Map
38 likes387 uses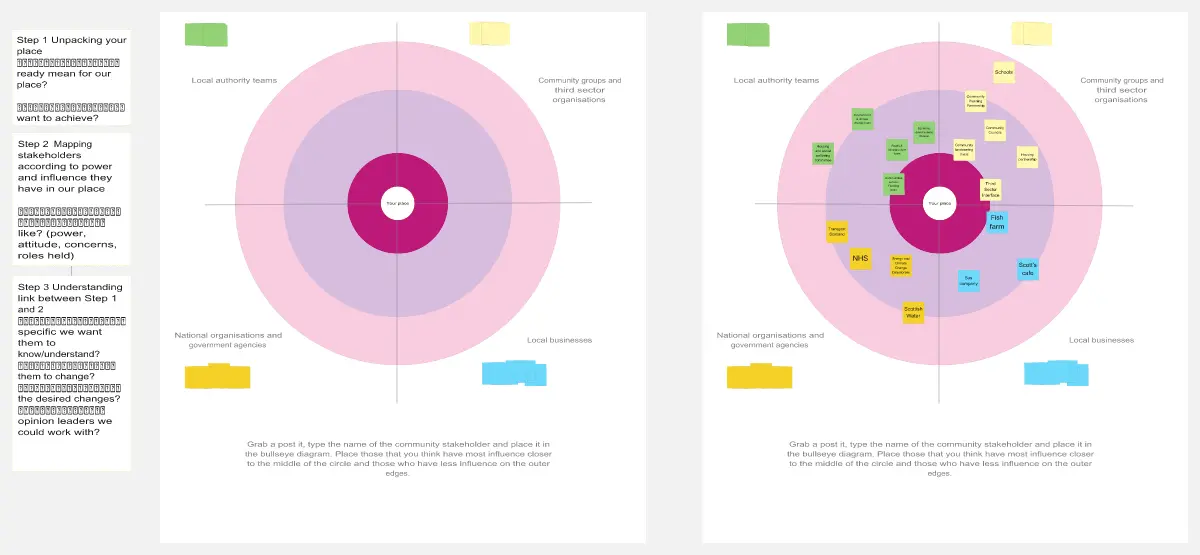
Stakeholders Alignment Session
61 likes280 uses
Stakeholder Map
36 likes252 uses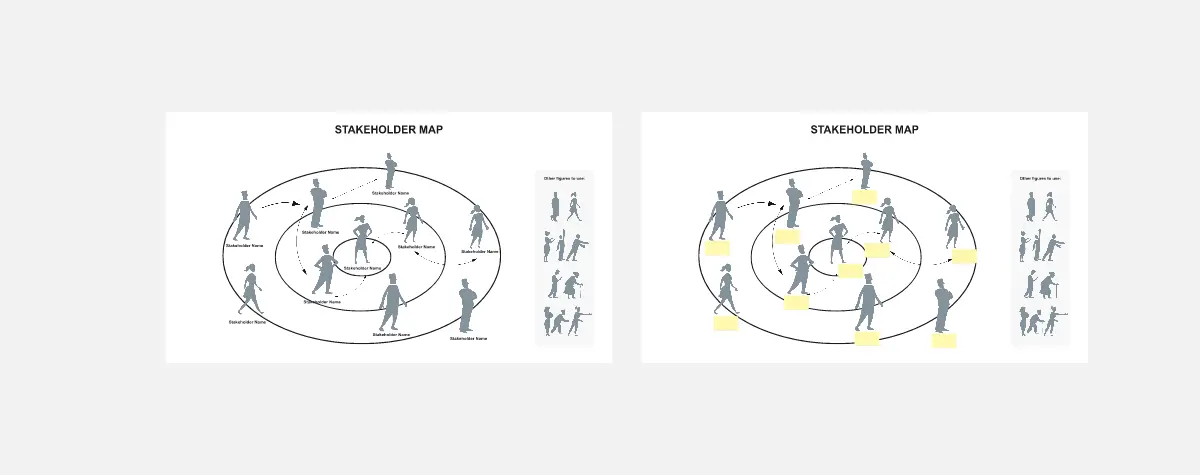
Stakeholder Analysis Template
5 likes251 usesStakeholder Mapping
35 likes231 uses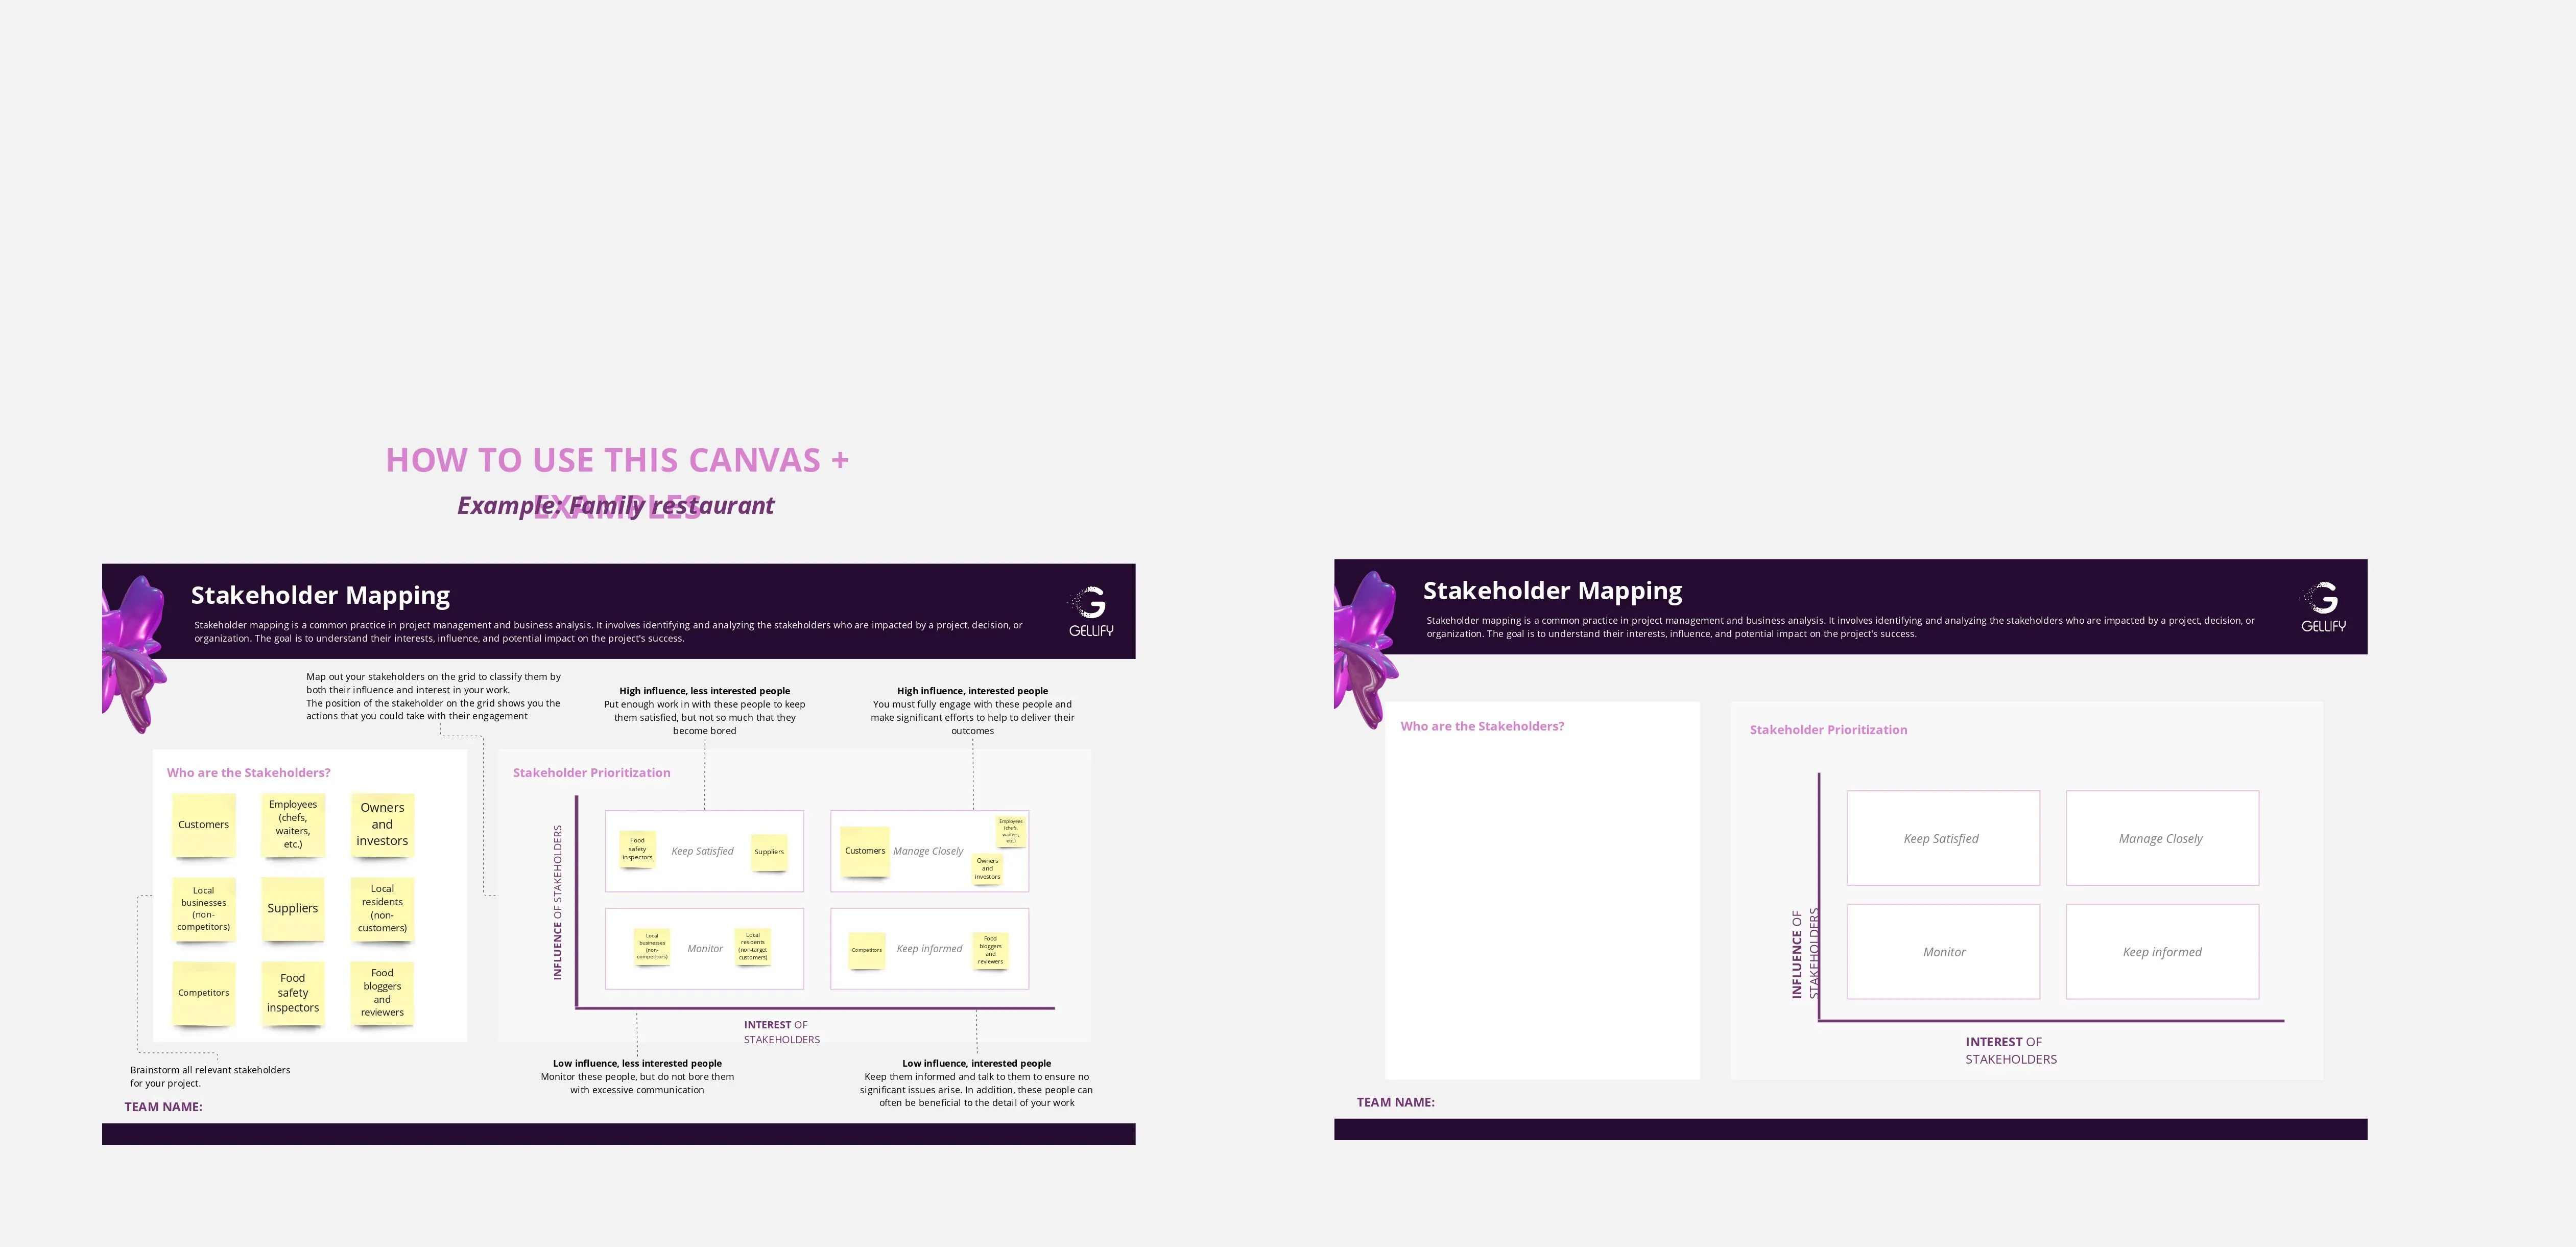
Stakeholder Engagement Plan
42 likes229 uses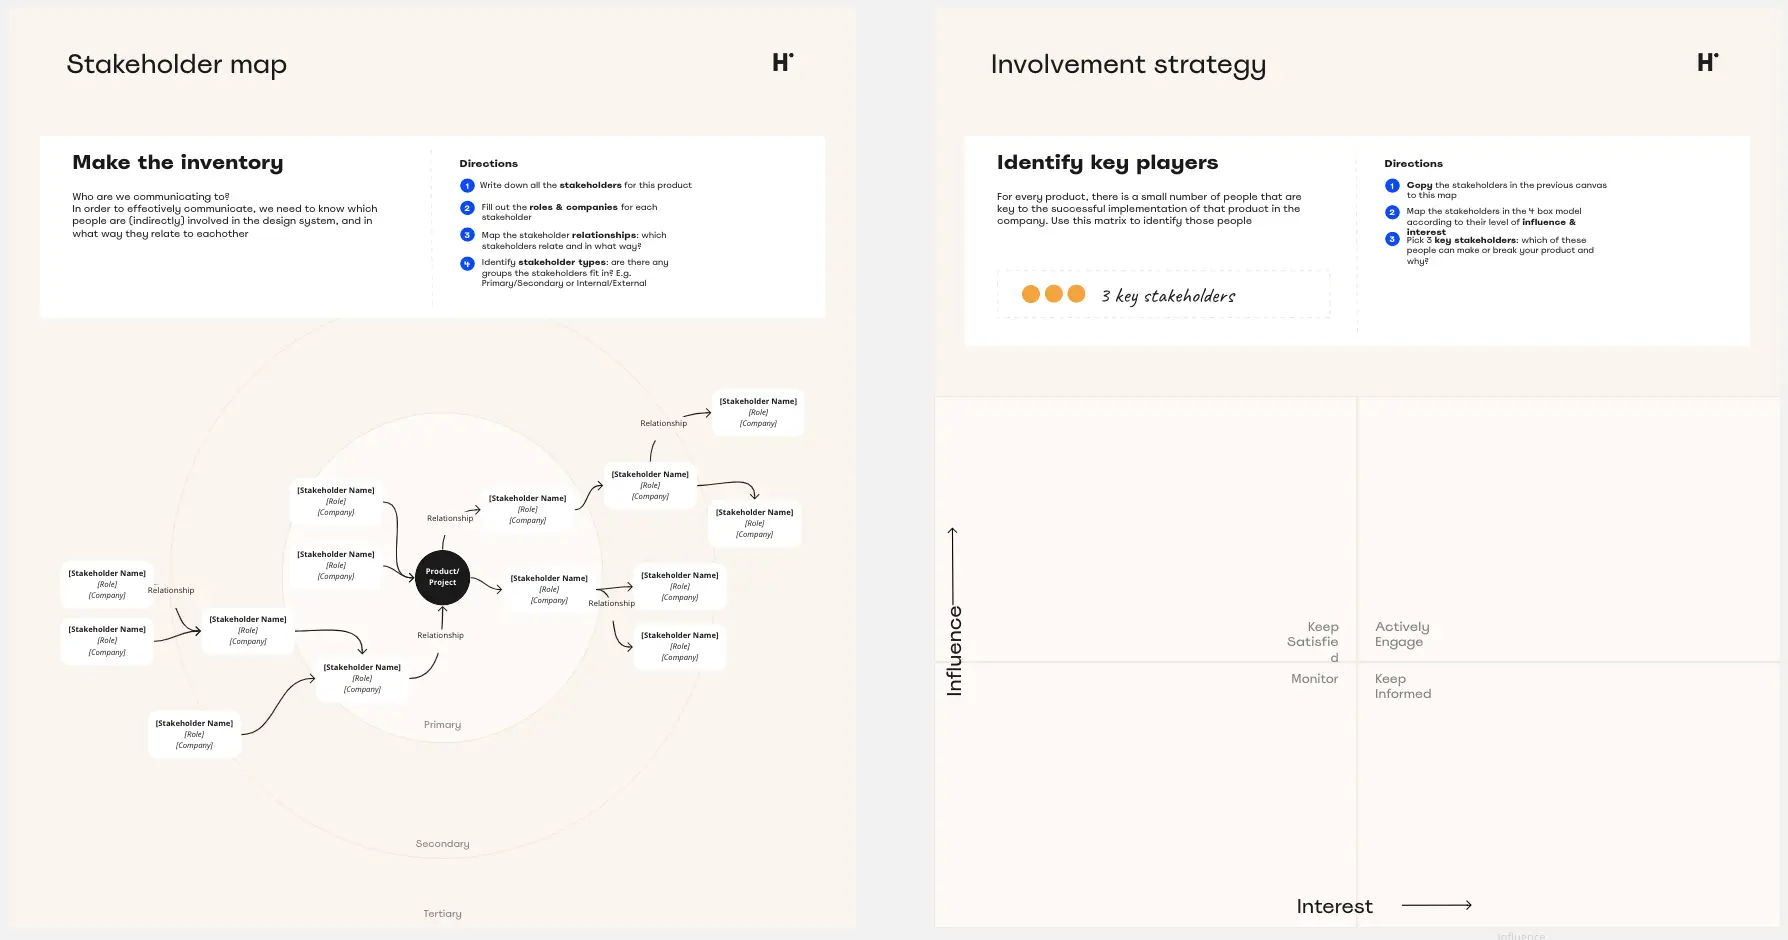
RACI Matrix Template
1 likes223 uses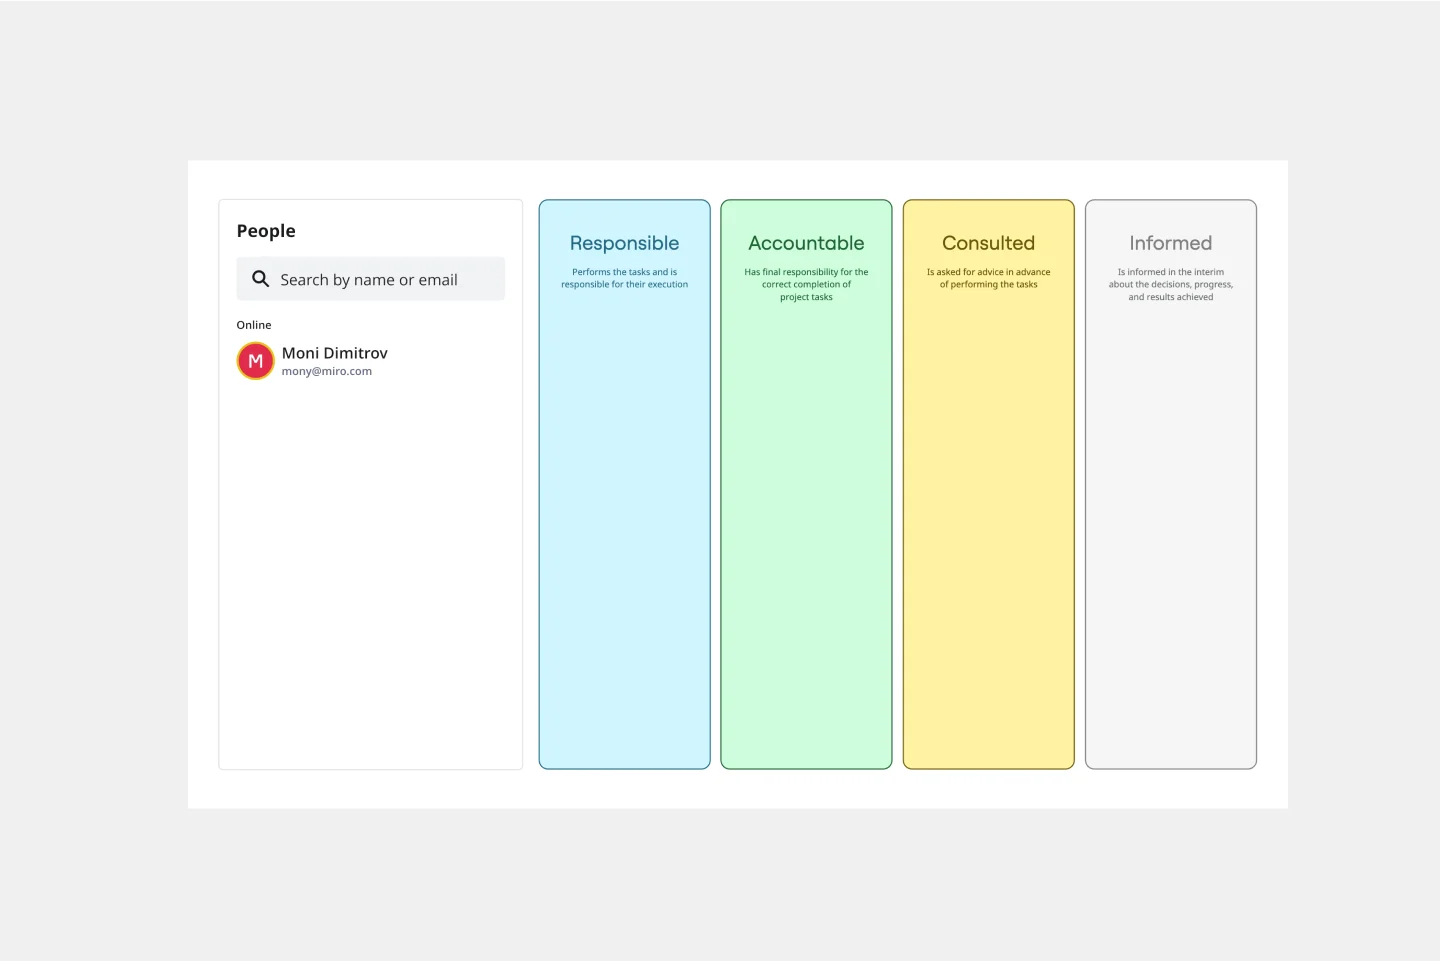
Business Organizational Chart Template
4 likes221 uses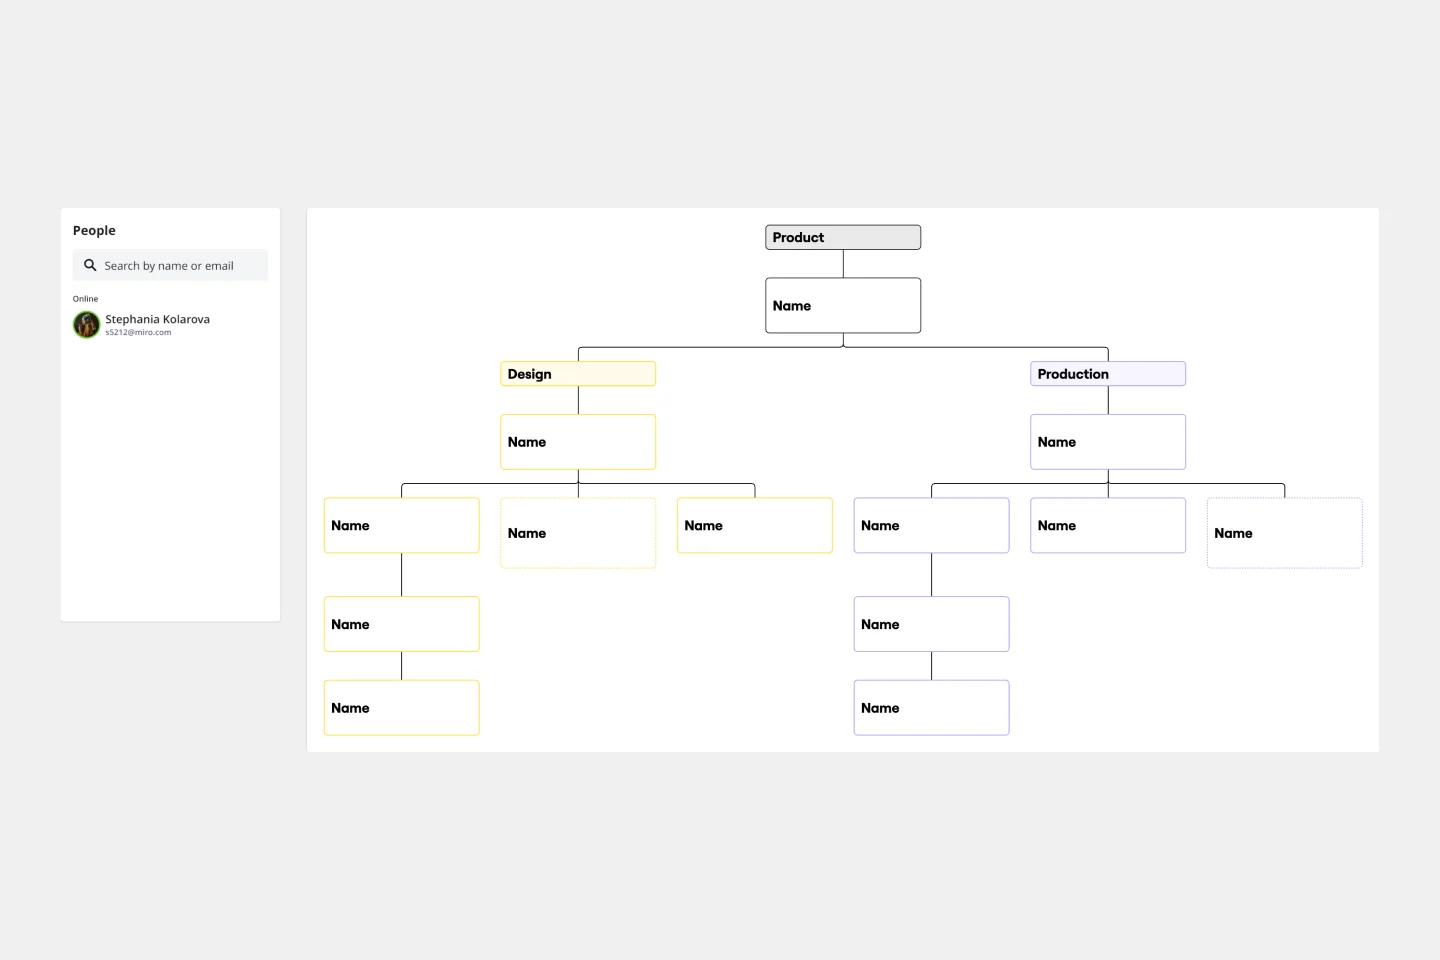
Stakeholder Mapping Template
3 likes196 usesICS Org Chart Template
3 likes196 uses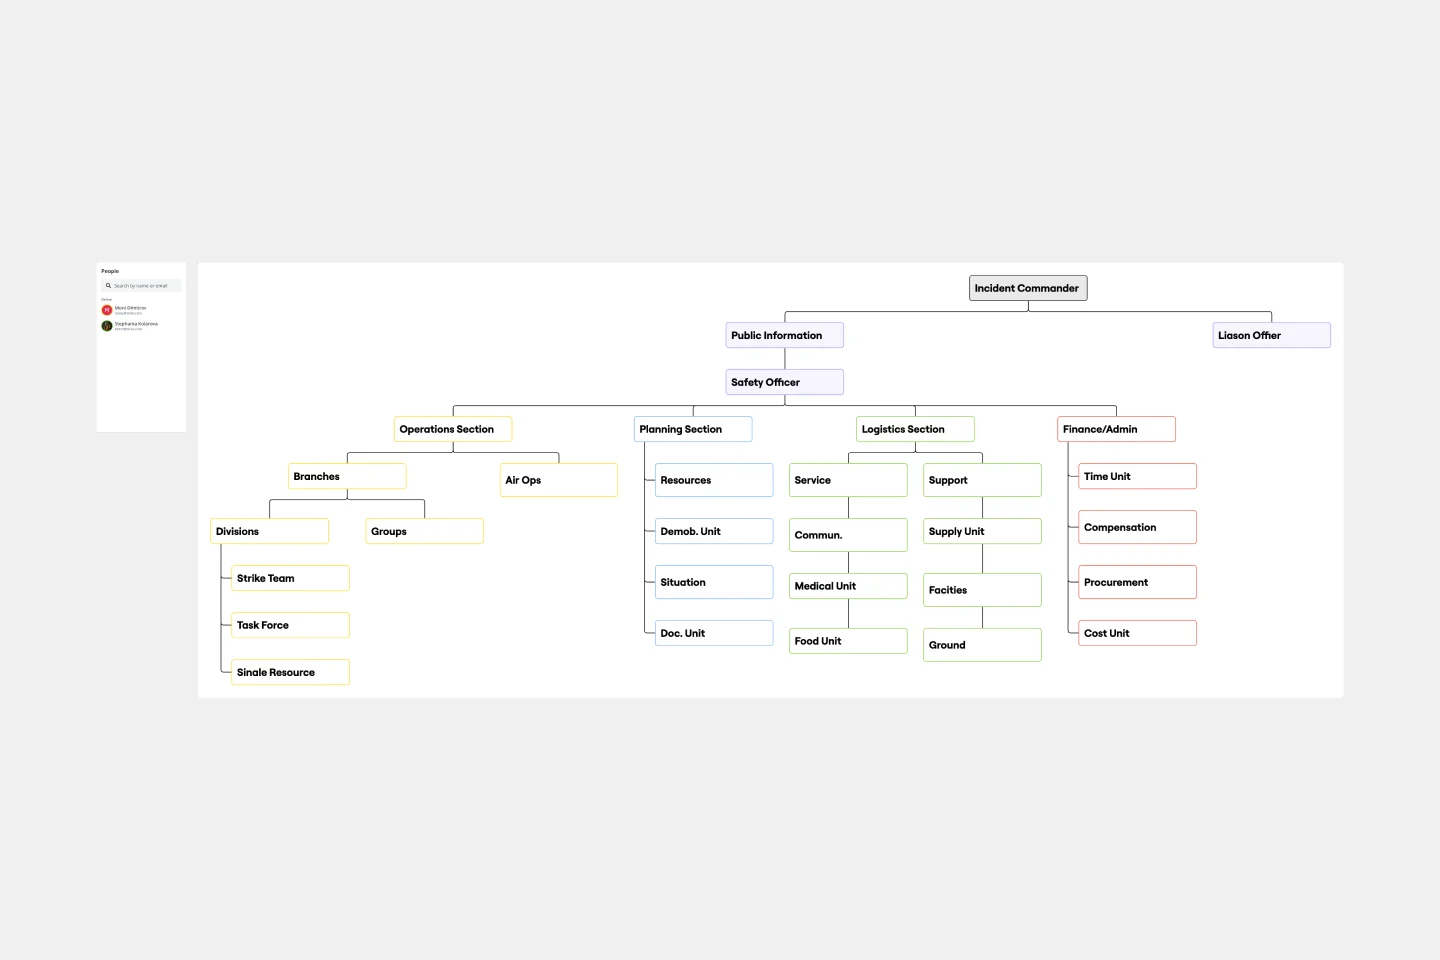
Future Wheel Example (With Stakeholders)
27 likes173 uses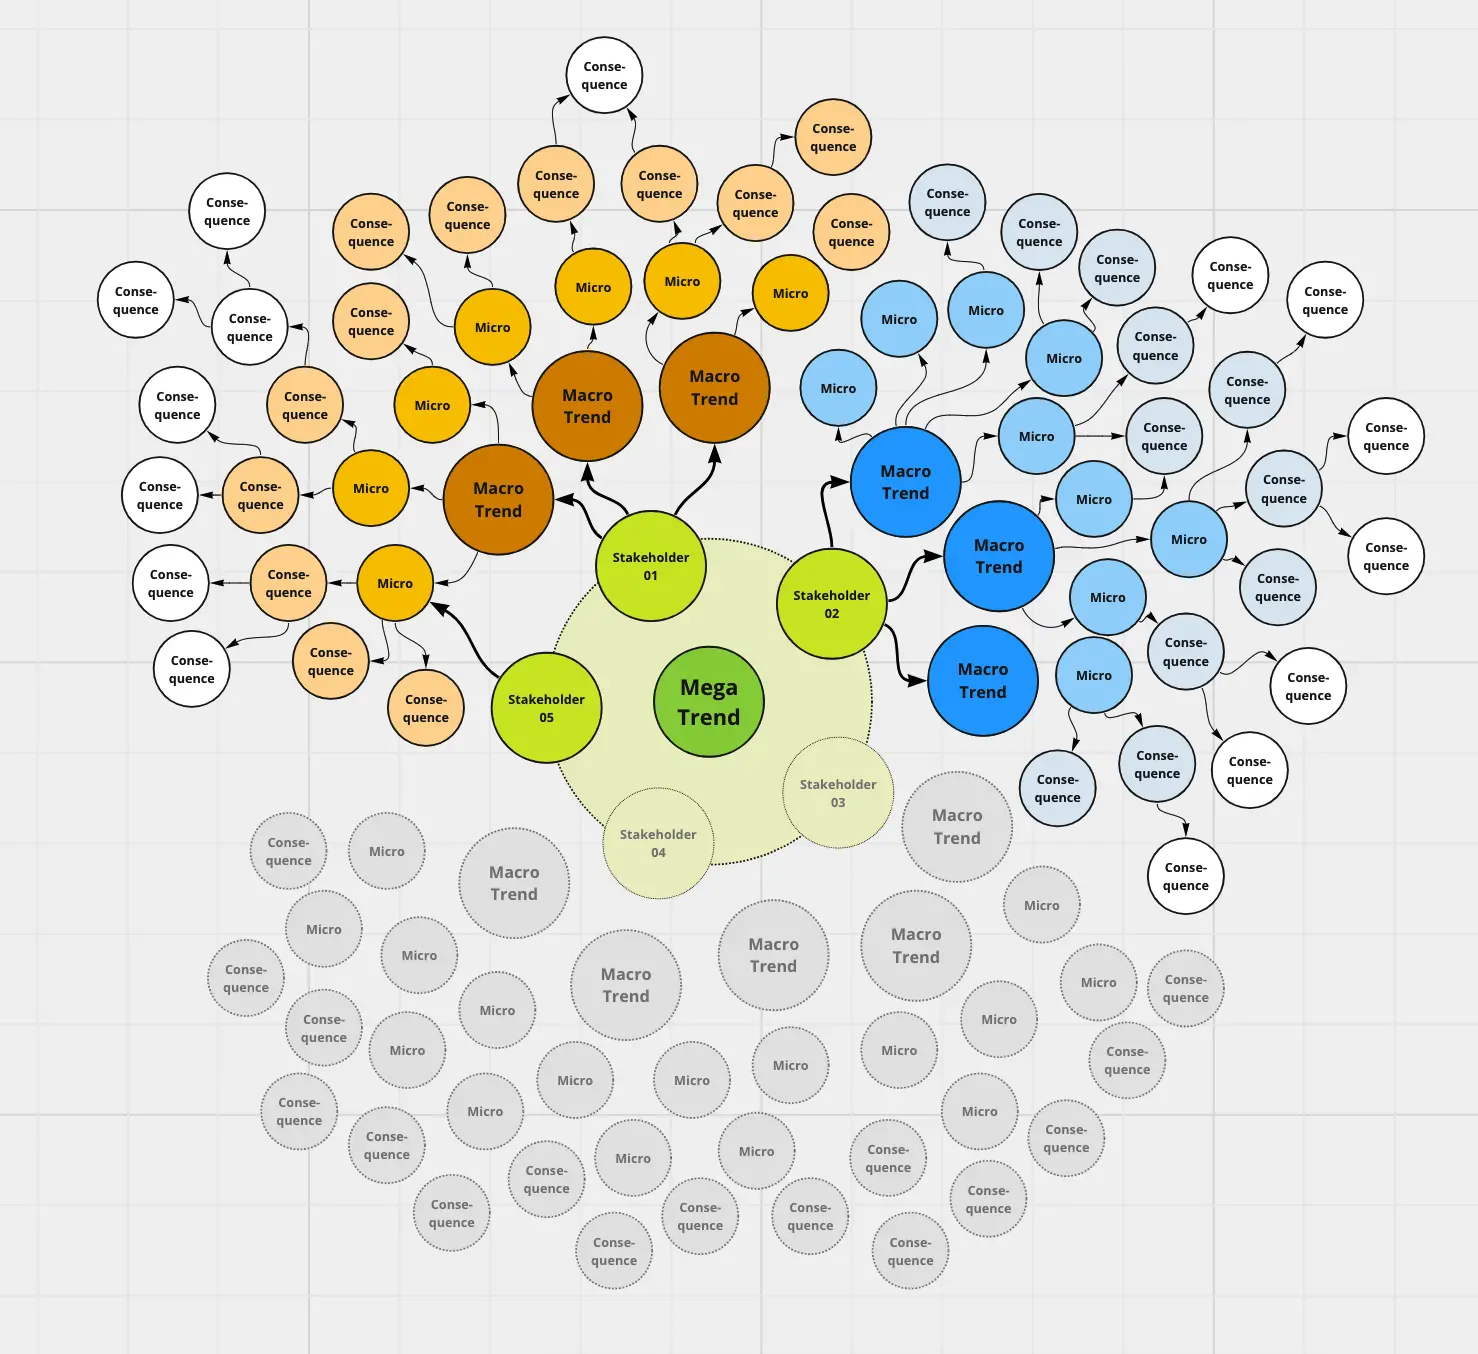
The Stakeholder Management Framework
20 likes143 uses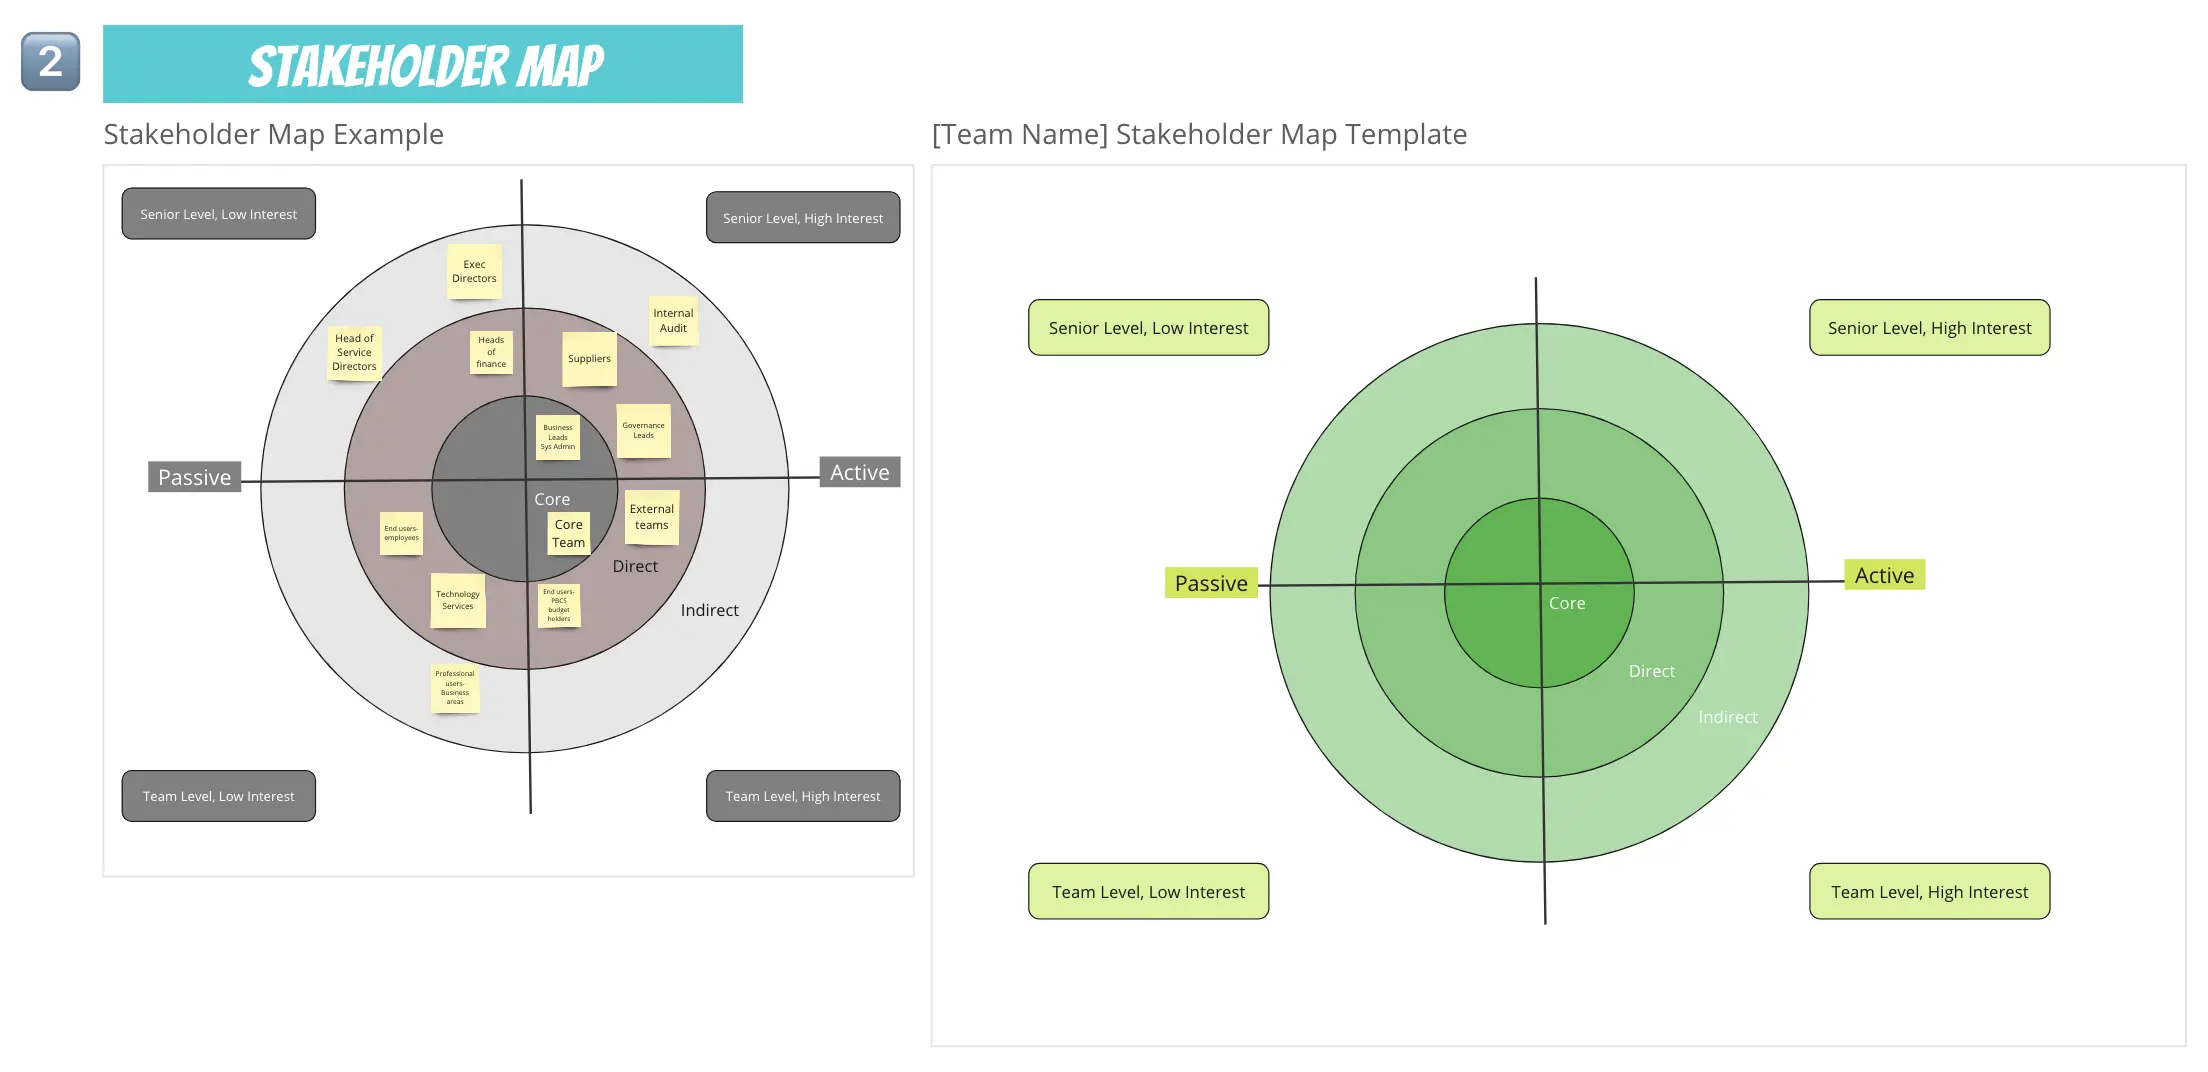
Stakeholder Analysis
12 likes141 uses
Published - Aligned - Stakeholder Canvas
10 likes109 uses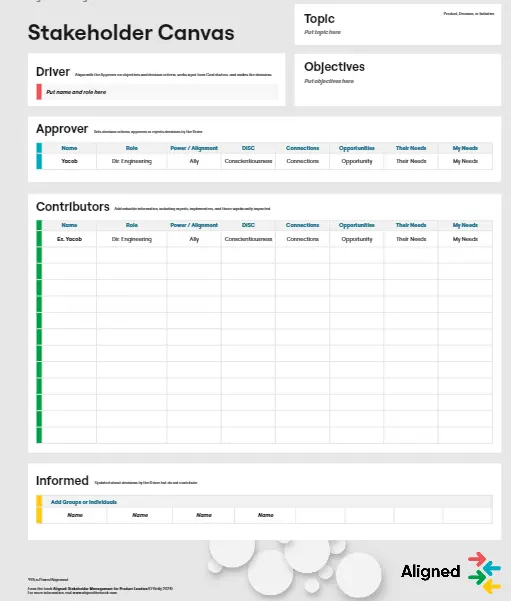
10 Step Stakeholder Management
36 likes108 uses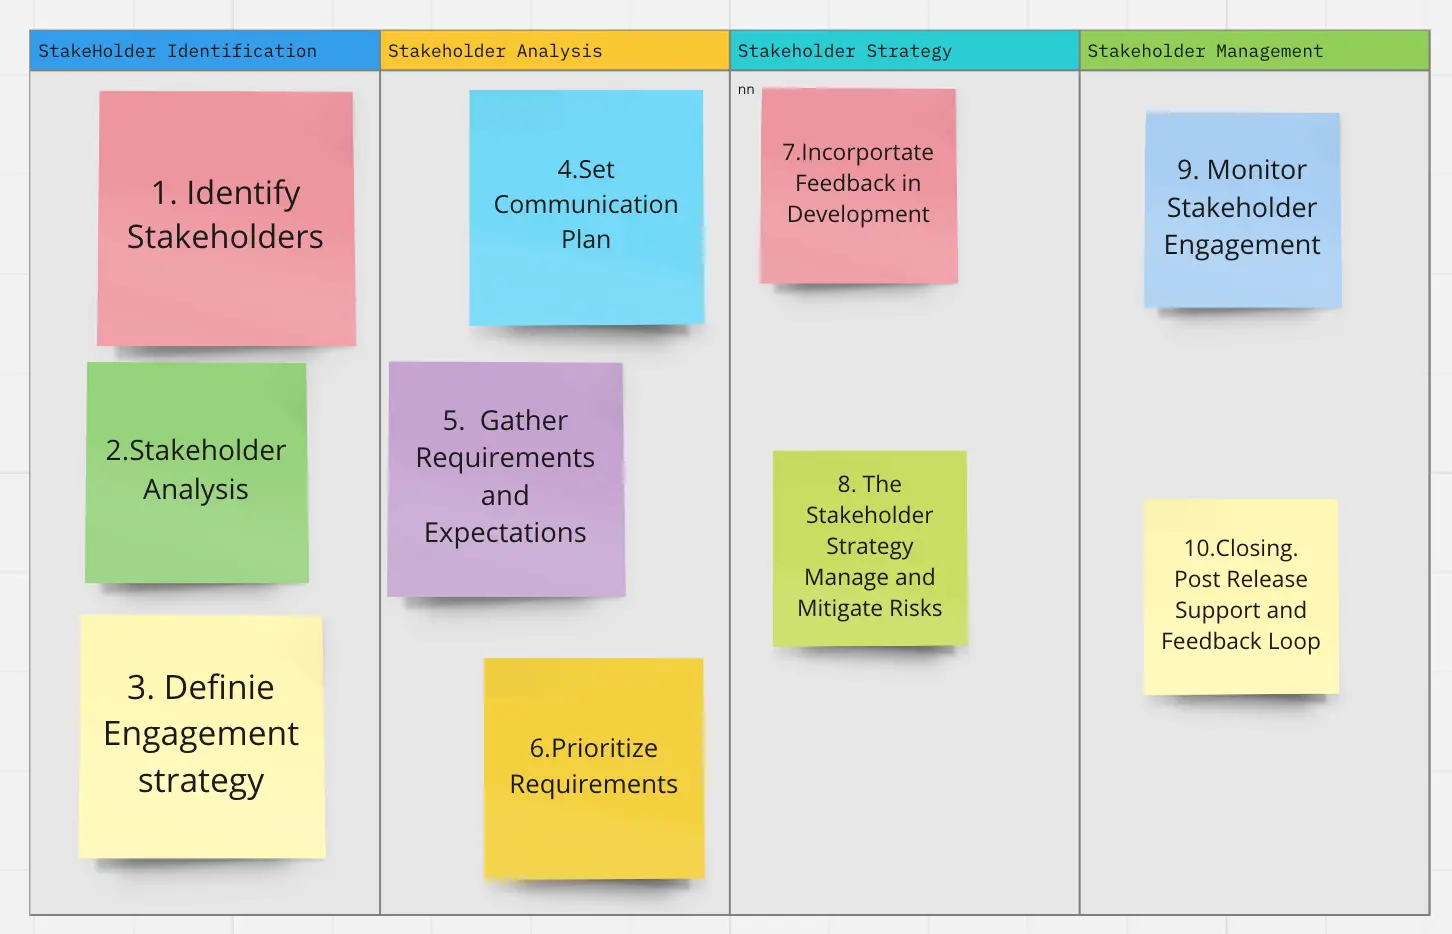
Stakeholder Followup
21 likes104 uses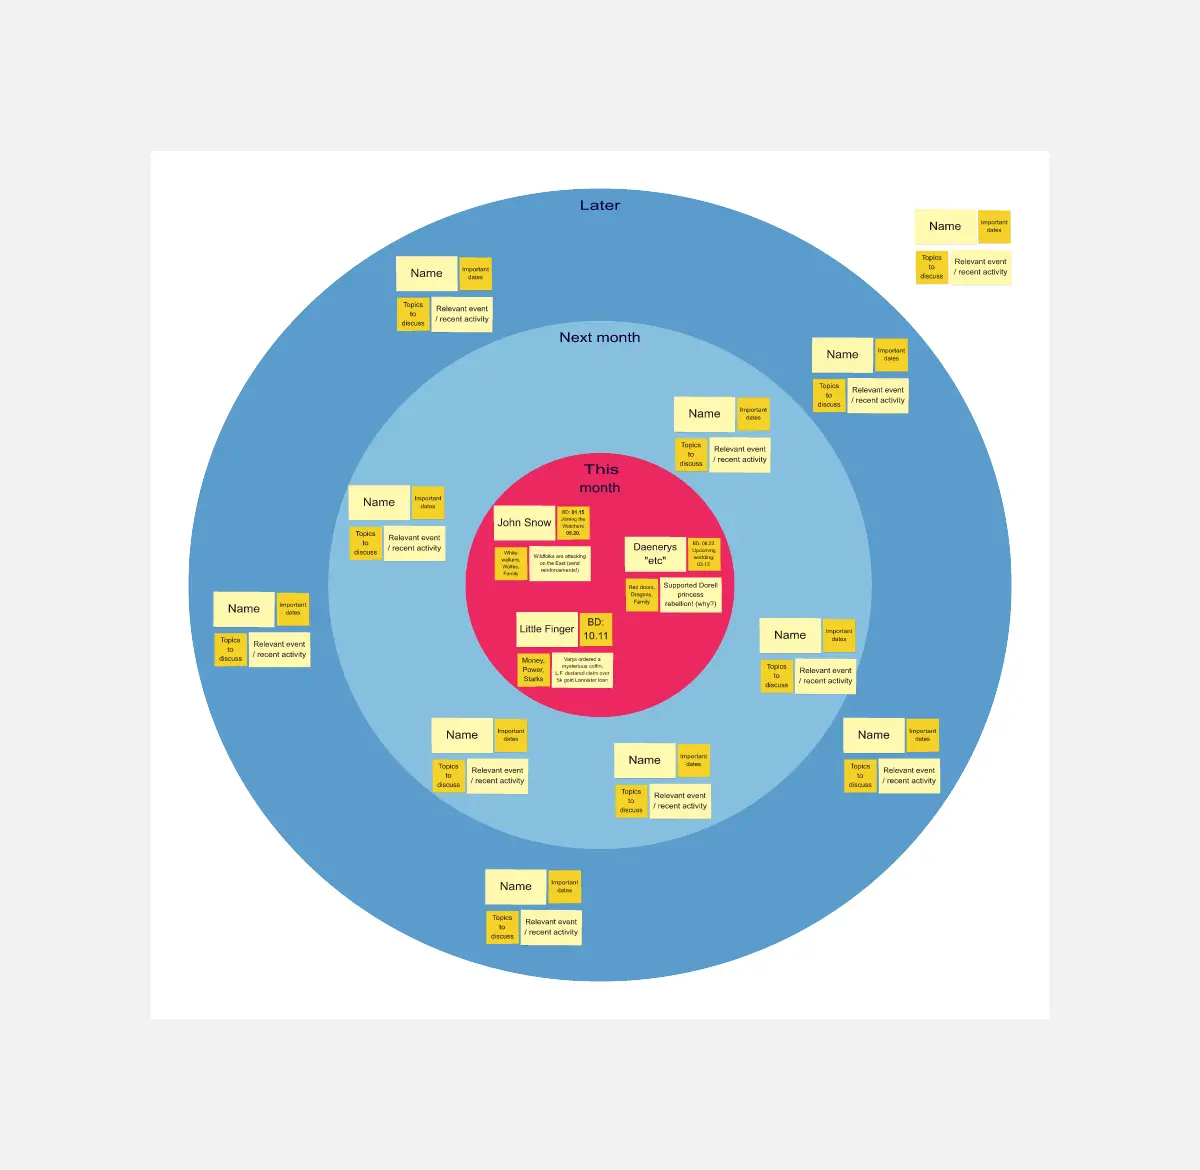
IASA - Stakeholder Empathy Map
22 likes97 uses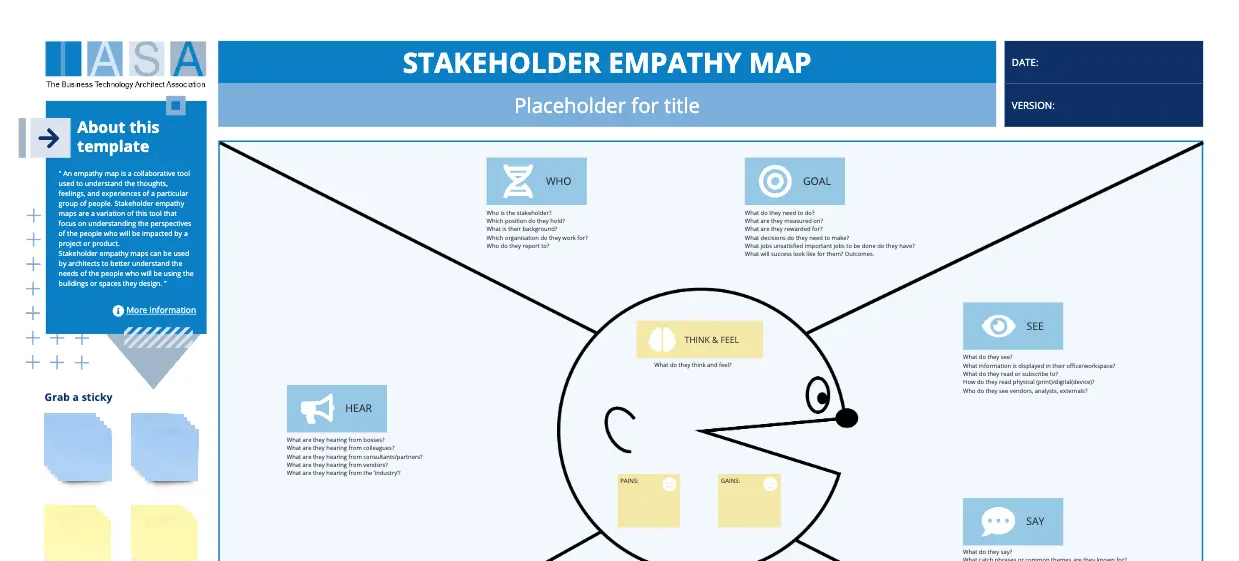
Roles and Responsibilities Template
1 likes90 uses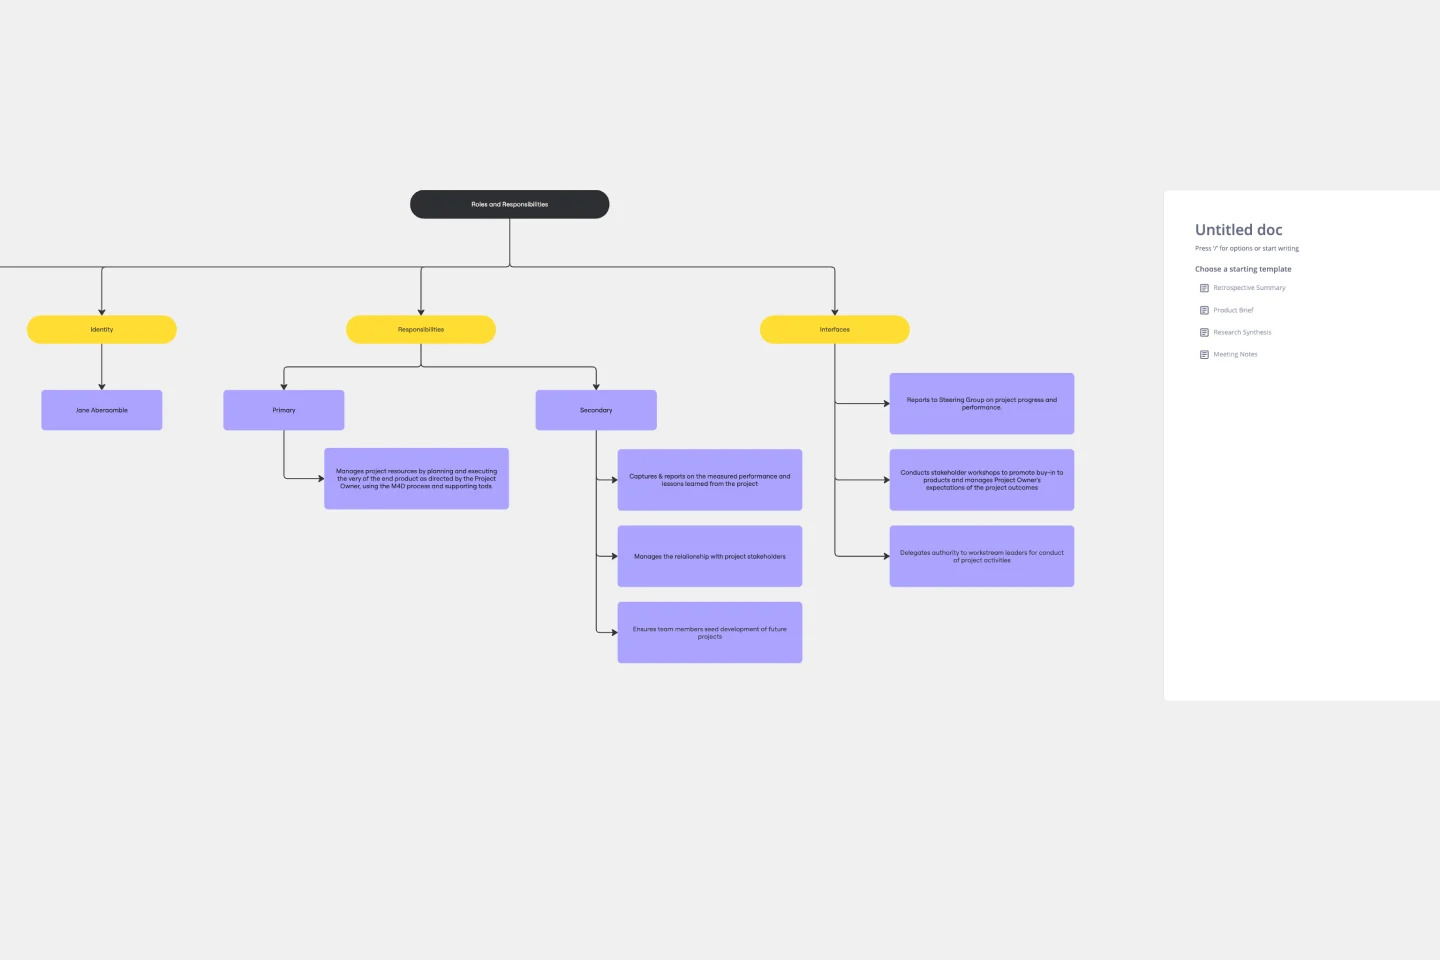
Stakeholder Interaction Storyboard
23 likes89 uses
Accountability Chart Template
0 likes67 uses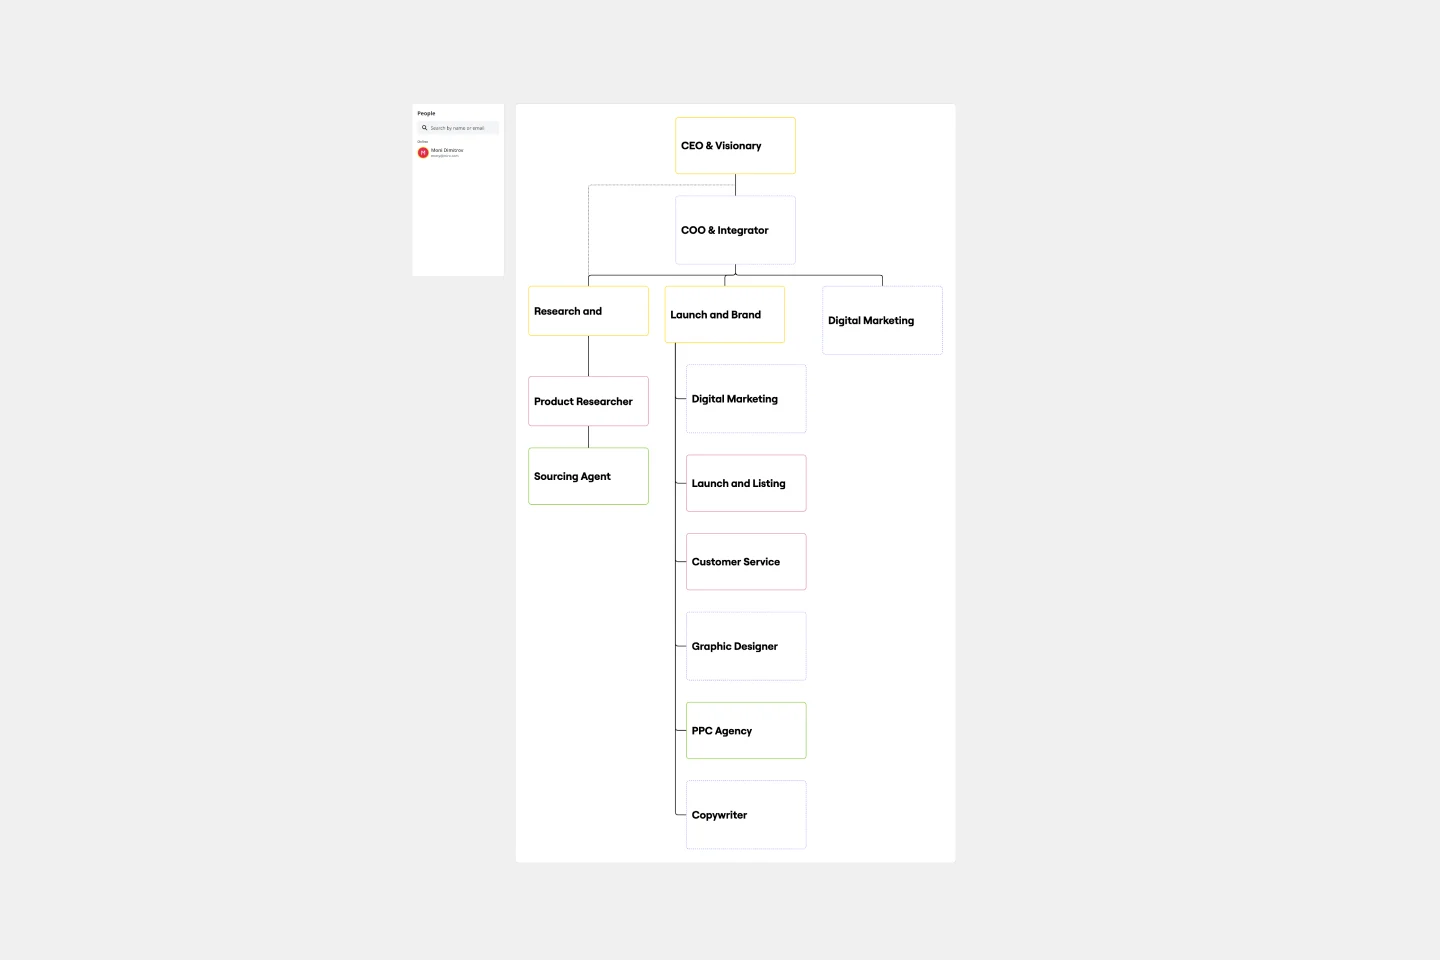
AI Stakeholder Map for Schools
6 likes61 uses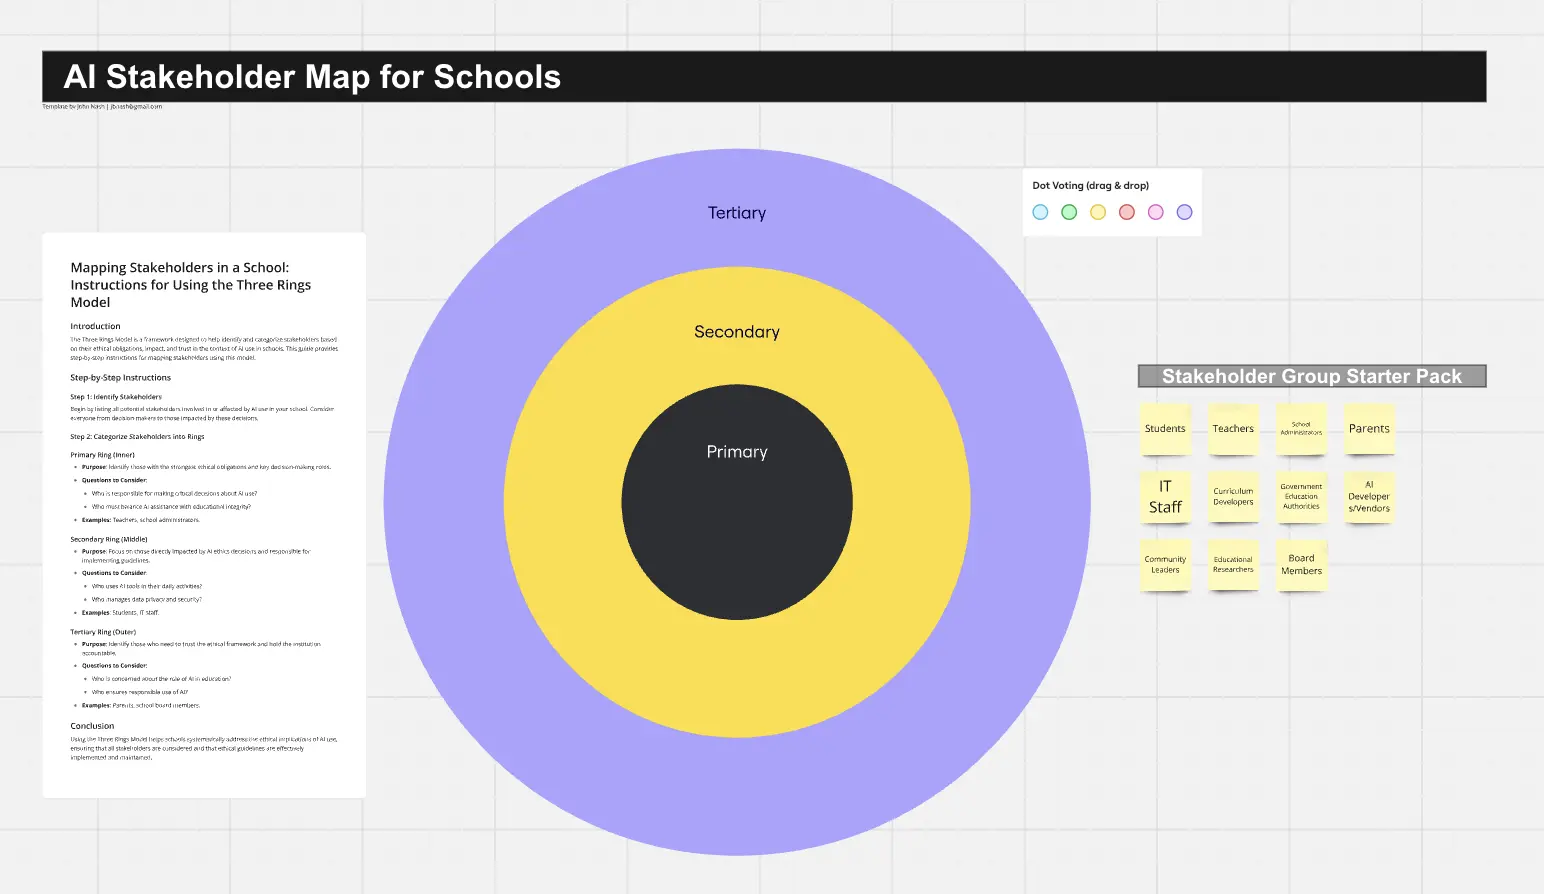
P2R Identify Stakeholders
6 likes61 uses
Empathy Map for Stakeholders
9 likes51 uses
Stakeholder Mapping
10 likes49 uses
Stakeholder Map [Research]
15 likes48 uses
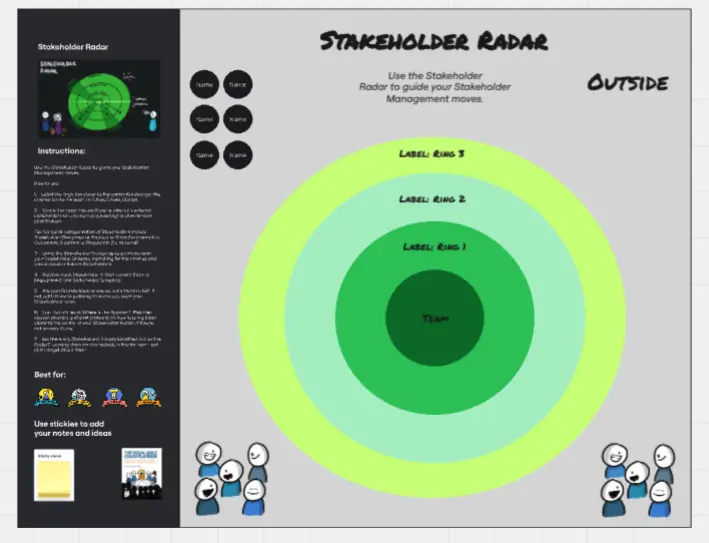
Stakeholder Map - Influence Compass
6 likes43 uses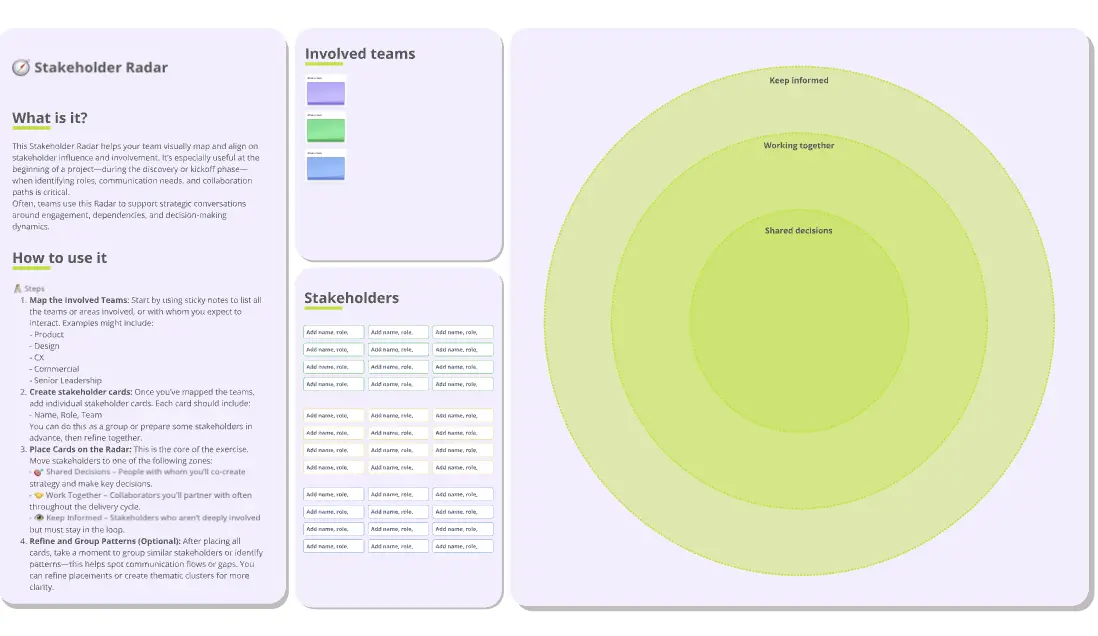
PAC-GANNT - Stakeholder Engagement
42 likes42 uses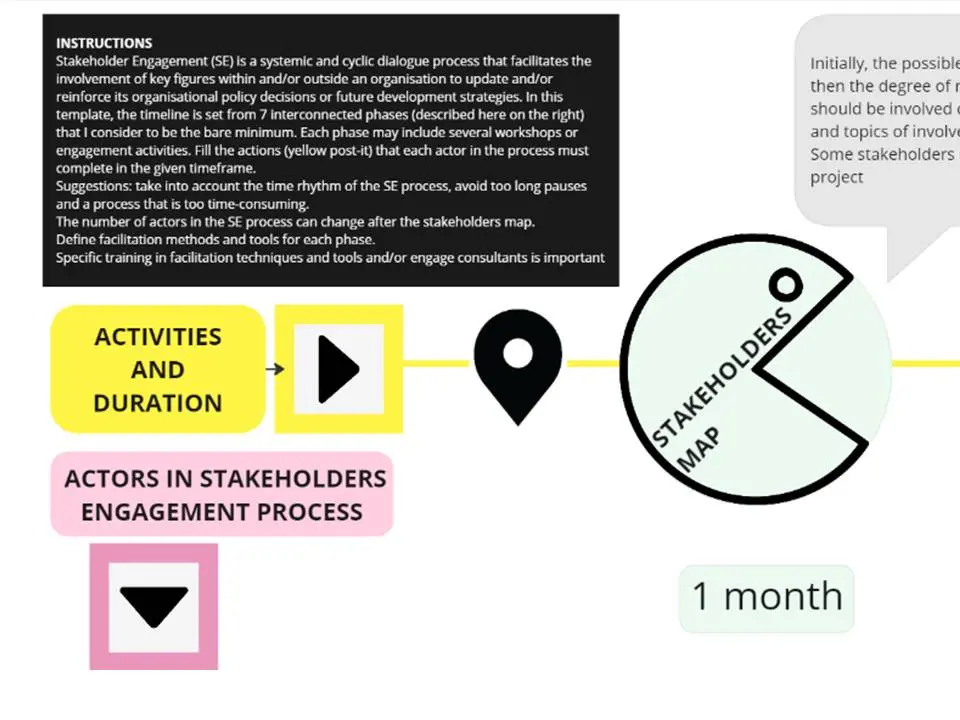
IASA - Architects Stakeholder Canvas
11 likes41 uses
L&D Stakeholder Analysis Template
7 likes39 uses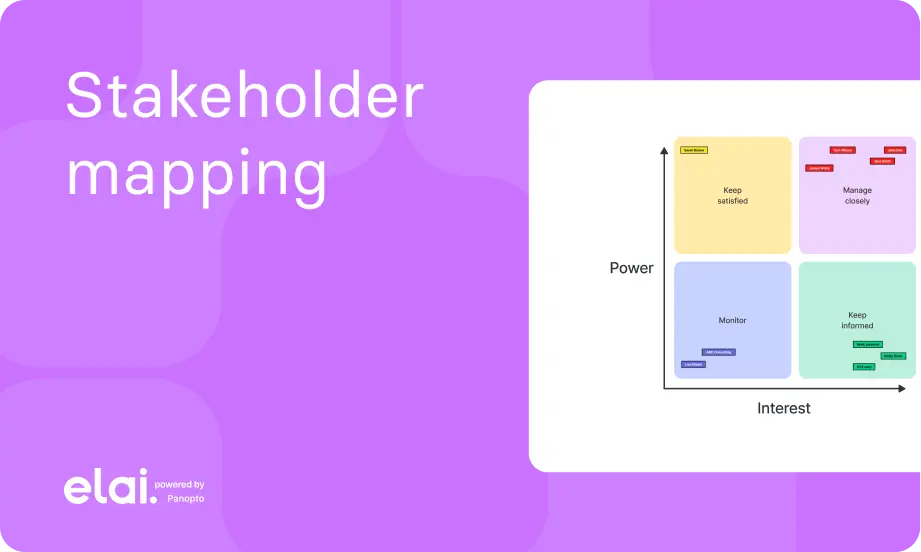
OKR Timeline Template
1 likes37 uses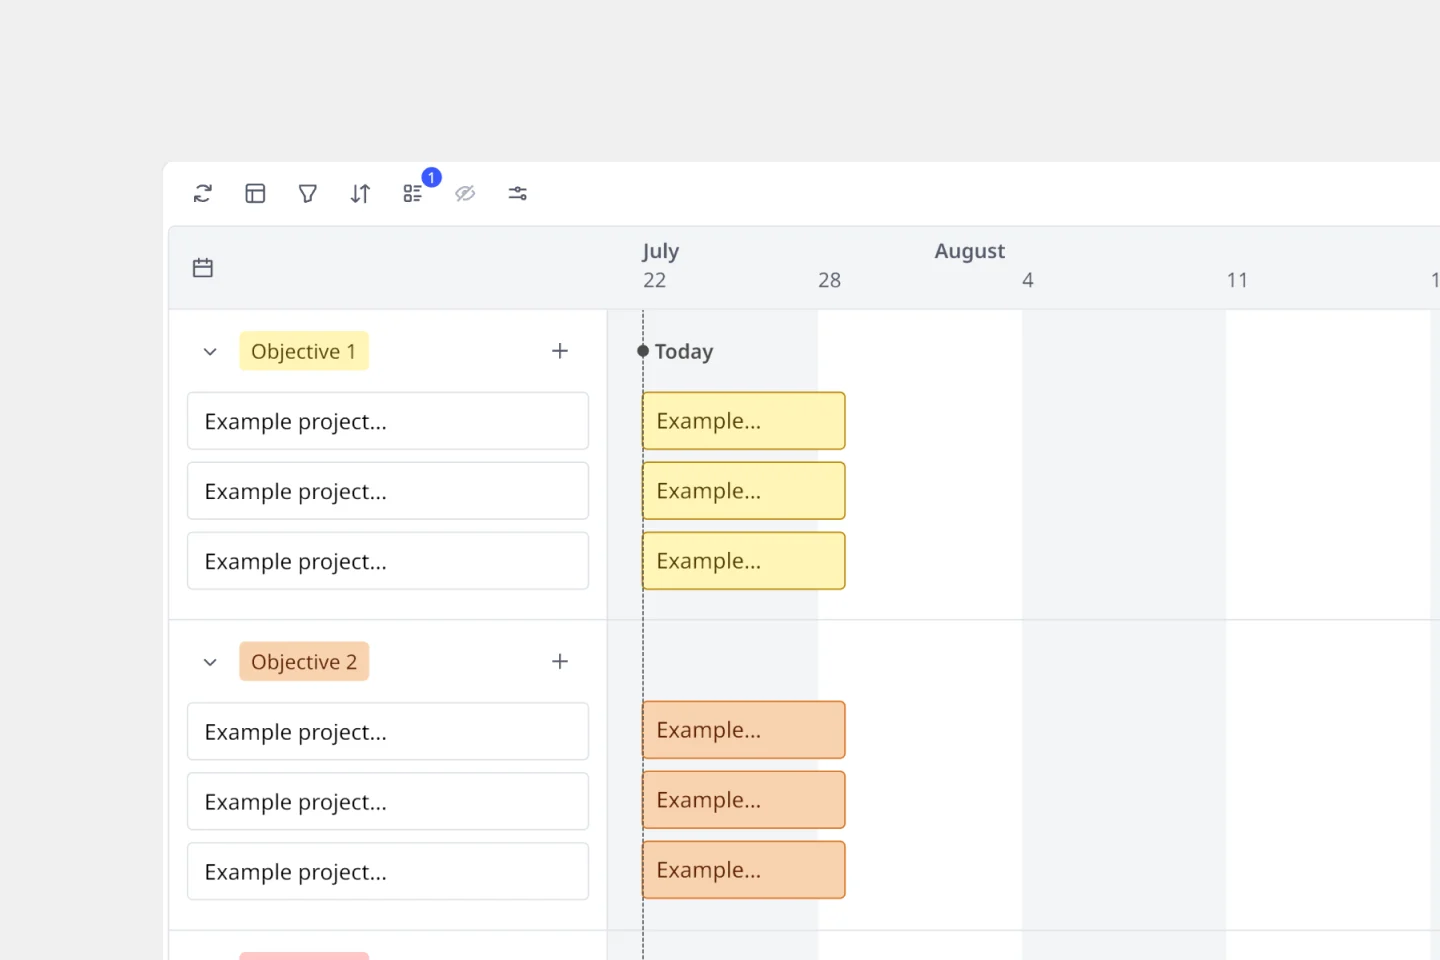
Stakeholder Alignment Gauge
7 likes26 uses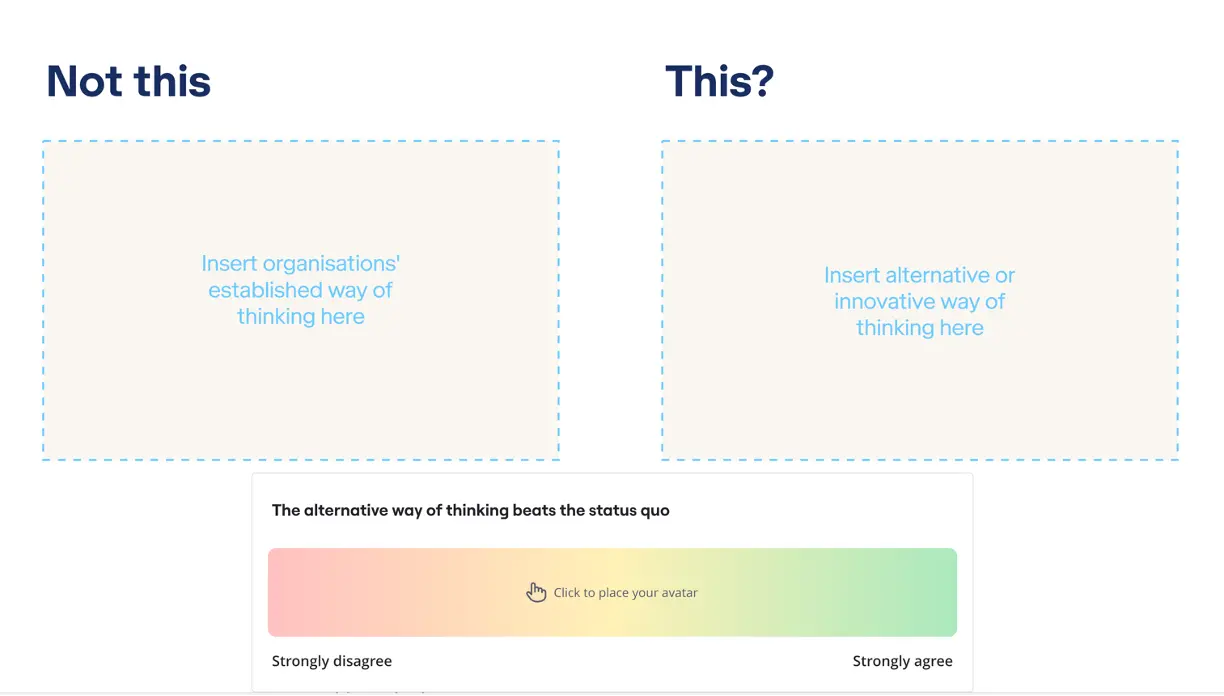
Explore more
Action PlanBusiness PlanCalendarChange ManagementCompetitive AnalysisCost Benefit Analysis templatesDaily schedule templatesDecision MakingDecision MatrixGap AnalysisGoal Setting TemplatesMarket analysis templatesMarketing PlanMarketing StrategyOKR templatesWeekly PlannerPlanningPriority Matrix TemplatesProblem StatementProduct Roadmap Templates Product Strategy TemplatesProject CharterProject Tracking Project Tracking Requirements GatheringResource PlanningRisk AssessmentRoadmapSmart GoalsSocial Media PlanningTimelineTo Do List Vertical TimelinesWhiteboardCustomer Journey Map