About the Stage-Gate Process Flowchart Template
The Stage-Gate Process Flowchart Template is a significant asset for project management, designed to simplify the advancement of projects through different stages. This template provides a systematic approach that helps teams efficiently manage and monitor each phase of a project, starting from the beginning to completion. It guides teams through a sequence of checkpoints or "gates" where decisions are made before moving on to the subsequent stage.
This template is divided into sections representing a project's various stages and decision points. Each stage signifies a key phase in the project, such as ideation, planning, execution, and review. The decision points, positioned between stages, serve as checkpoints where progress is evaluated, and a decision is made to either continue, change, or stop the project. Using this template, you can systematically track progress, identify potential issues early on, and ensure that each project phase aligns with the objectives.
How to use the Stage-Gate Process Flowchart Template in Miro
Customize the template: Easily edit the template with just a few clicks. Change the stage names and descriptions to suit the project's specific needs.
Expand with diagramming tools: Use Miro's automated diagramming features to add more shapes and connector lines, enriching the flowchart with additional details and complexities as needed.
Integrate artifacts: Enhance the flowchart by adding any relevant artifacts directly onto the Miro board. This could include documents, images, or links, providing context and information at each stage.
Collaborate and share: Invite team members to view, edit, and comment on the flowchart, fostering a collaborative environment where everyone stays informed and aligned.
Why should you use a Stage-Gate Process Flowchart Template?
Improved project clarity: Clearly define each project stage, ensuring team members understand their roles and responsibilities at every phase.
Informed decision-making: The gate checkpoints facilitate informed decisions based on thorough project progress and feasibility evaluations.
Risk mitigation: Early identification and management of potential risks and issues, reducing the likelihood of project delays or failures.
Efficient resource allocation: Allows for the best distribution and utilization of resources throughout the project lifecycle.
Facilitates communication: Provides a visual representation of the project plan, improving Communication and understanding among stakeholders.
Stage-Gate Process Flowchart FAQs
Can the template be customized for different project types?
Yes, the template is highly adaptable and can be tailored to fit a wide range of project types and industries.
How does the template assist in risk management?
The template allows for regular assessments at each gate, enabling teams to identify and address risks early in the project lifecycle.

Miro
Your virtual workspace for innovation
Miro is an innovation workspace designed for teams of every size, everywhere, to dream, design, and build the future together. Our mission? To empower these teams to create the next big thing, powered by AI at every step of the way. Over 90 million users around the world rely on Miro to untangle complex ideas, put customer needs first, and deliver products and services faster. All supported by best-in-class security, compliance, and scalability.
Categories
Similar templates
Design Process Flowchart Template
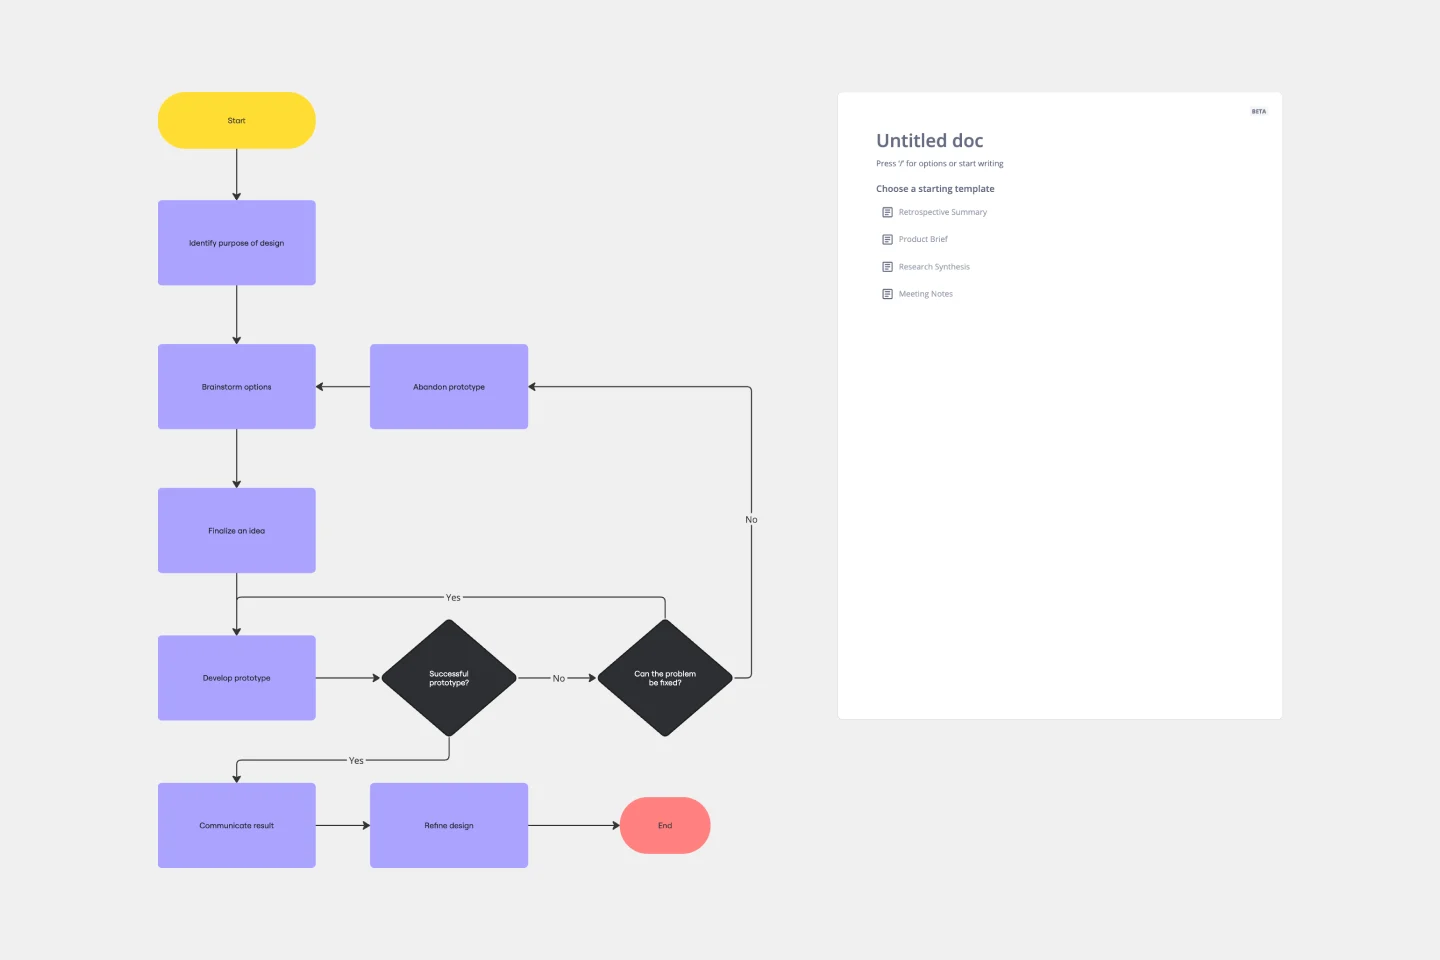
Design Process Flowchart Template
The Design Process Flowchart Template is an excellent tool to navigate the complexities of a design project. It offers a clear and organized visual representation of each step in the design journey, making it easier to understand and follow. One of its key benefits is that it enhances team collaboration. By providing a visual outline of the design process, the template fosters a shared understanding among team members, regardless of their individual roles or expertise. This common visual framework enables more efficient communication, aligning everyone's efforts toward a unified goal. As a result, it not only streamlines the workflow but also encourages collective creativity and innovation, which are essential elements in any successful design project.
Troubleshooting Flowchart Template
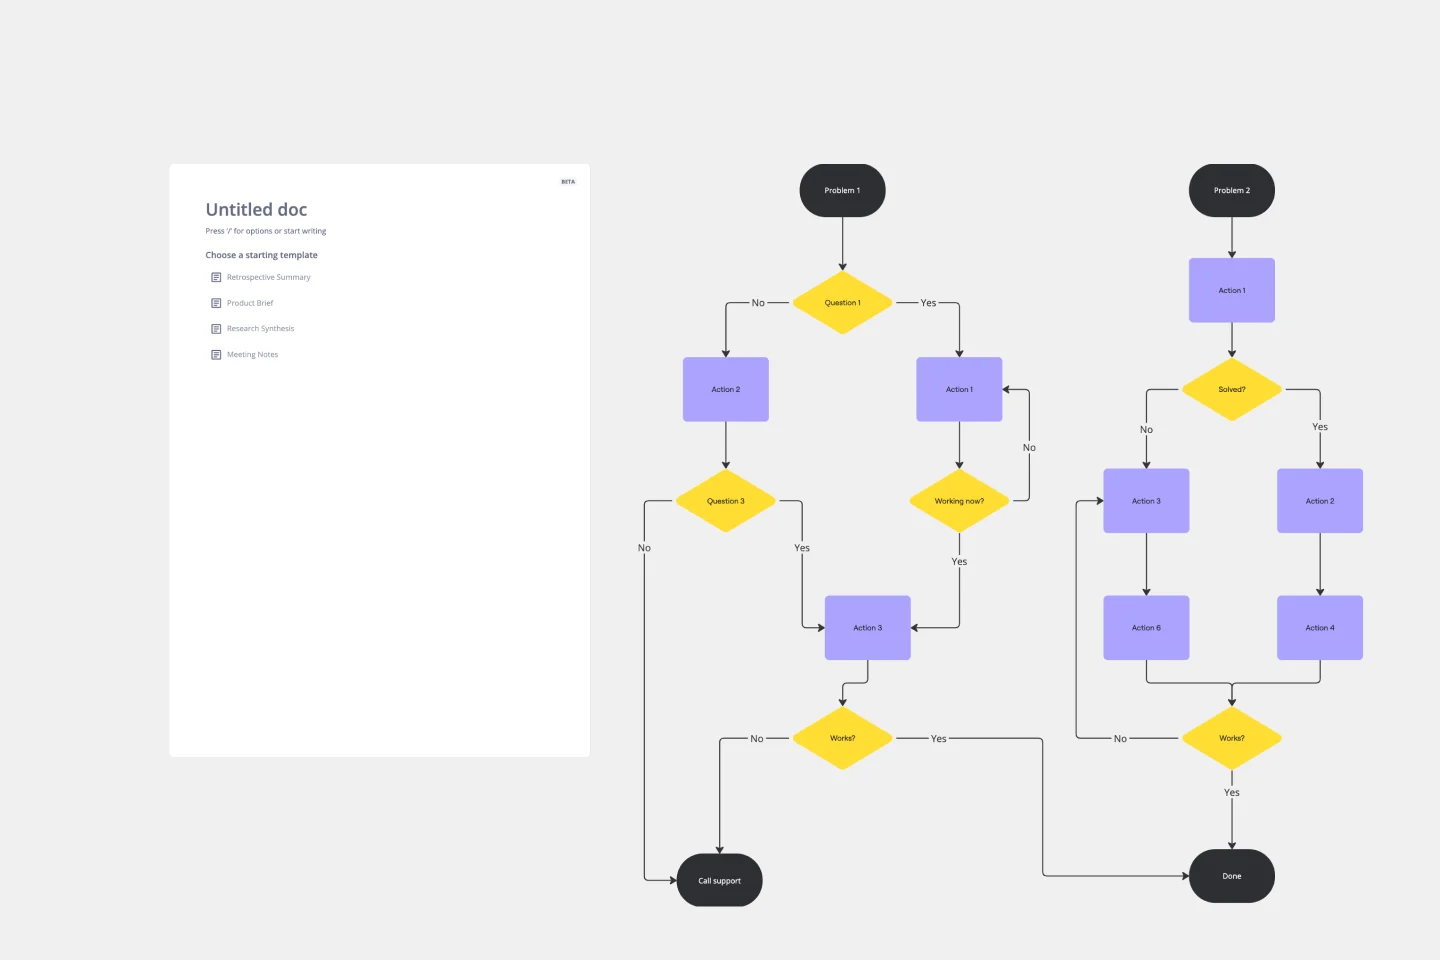
Troubleshooting Flowchart Template
The Troubleshooting Flowchart Template is an easy-to-use and versatile tool that simplifies problem-solving. It provides a step-by-step visual guide to identify, analyze, and fix issues, ensuring a clear and structured approach to troubleshooting. One of the key benefits of utilizing this template is that it helps improve communication among team members. By representing the troubleshooting steps visually, it simplifies complex processes and makes it easier for team members to understand, collaborate, and contribute efficiently.
If then Flowchart Template
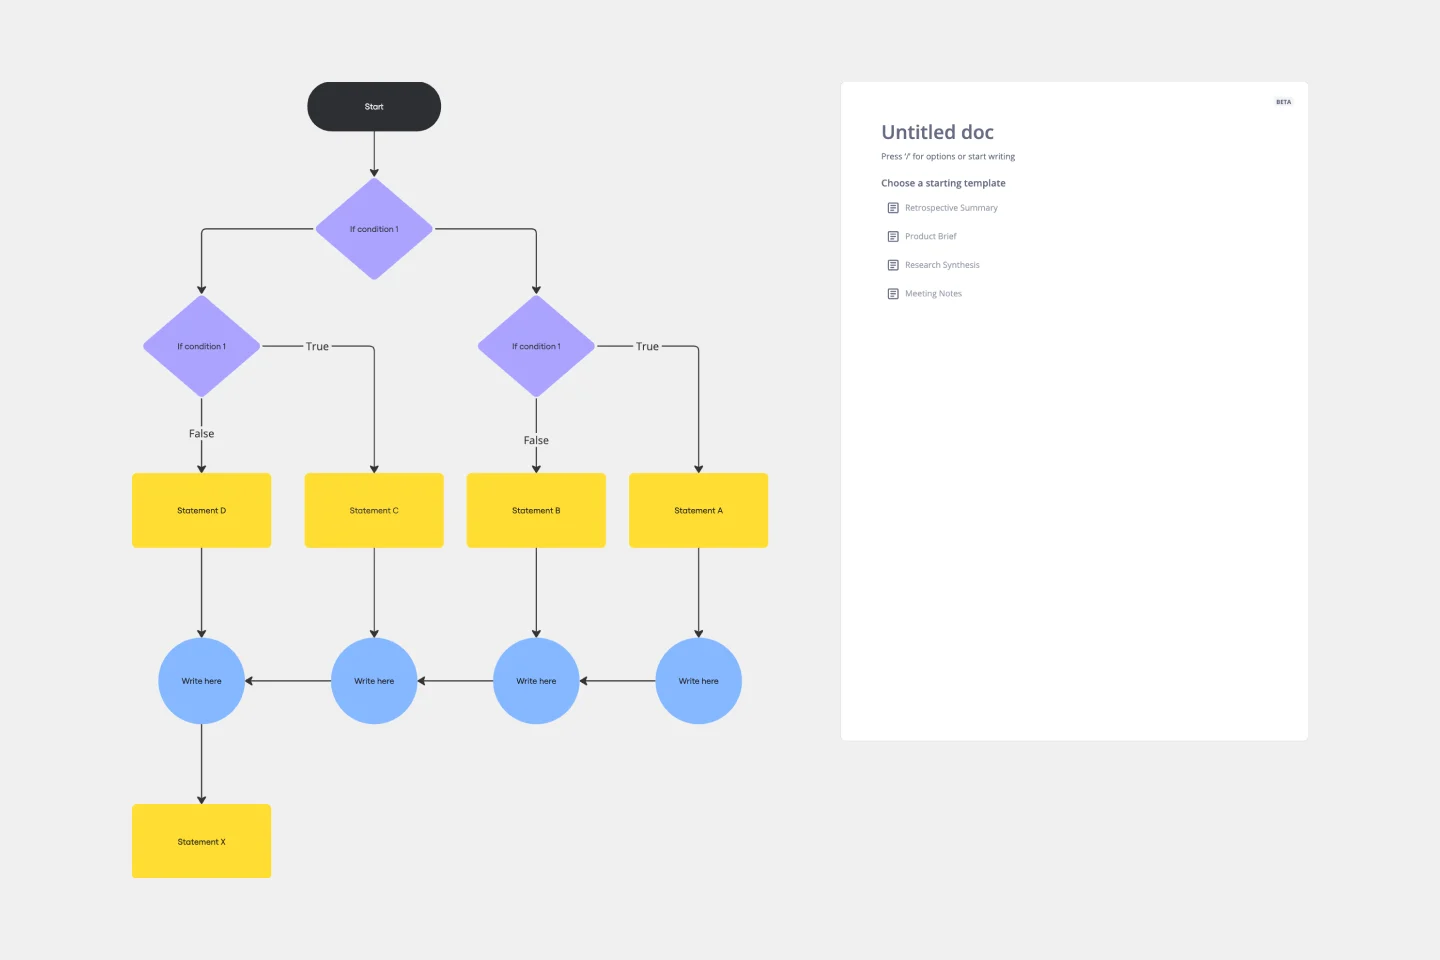
If then Flowchart Template
The If-then Flowchart Template is a useful tool for decision-making. It visually maps out conditional steps and outcomes, allowing users to anticipate potential challenges and opportunities. This foresight is valuable for making informed decisions, especially for those with significant implications. Whether for business strategy, project management, or personal decision-making, the template helps navigate complex decision trees with confidence.
Current State vs. Future State Flowchart Template
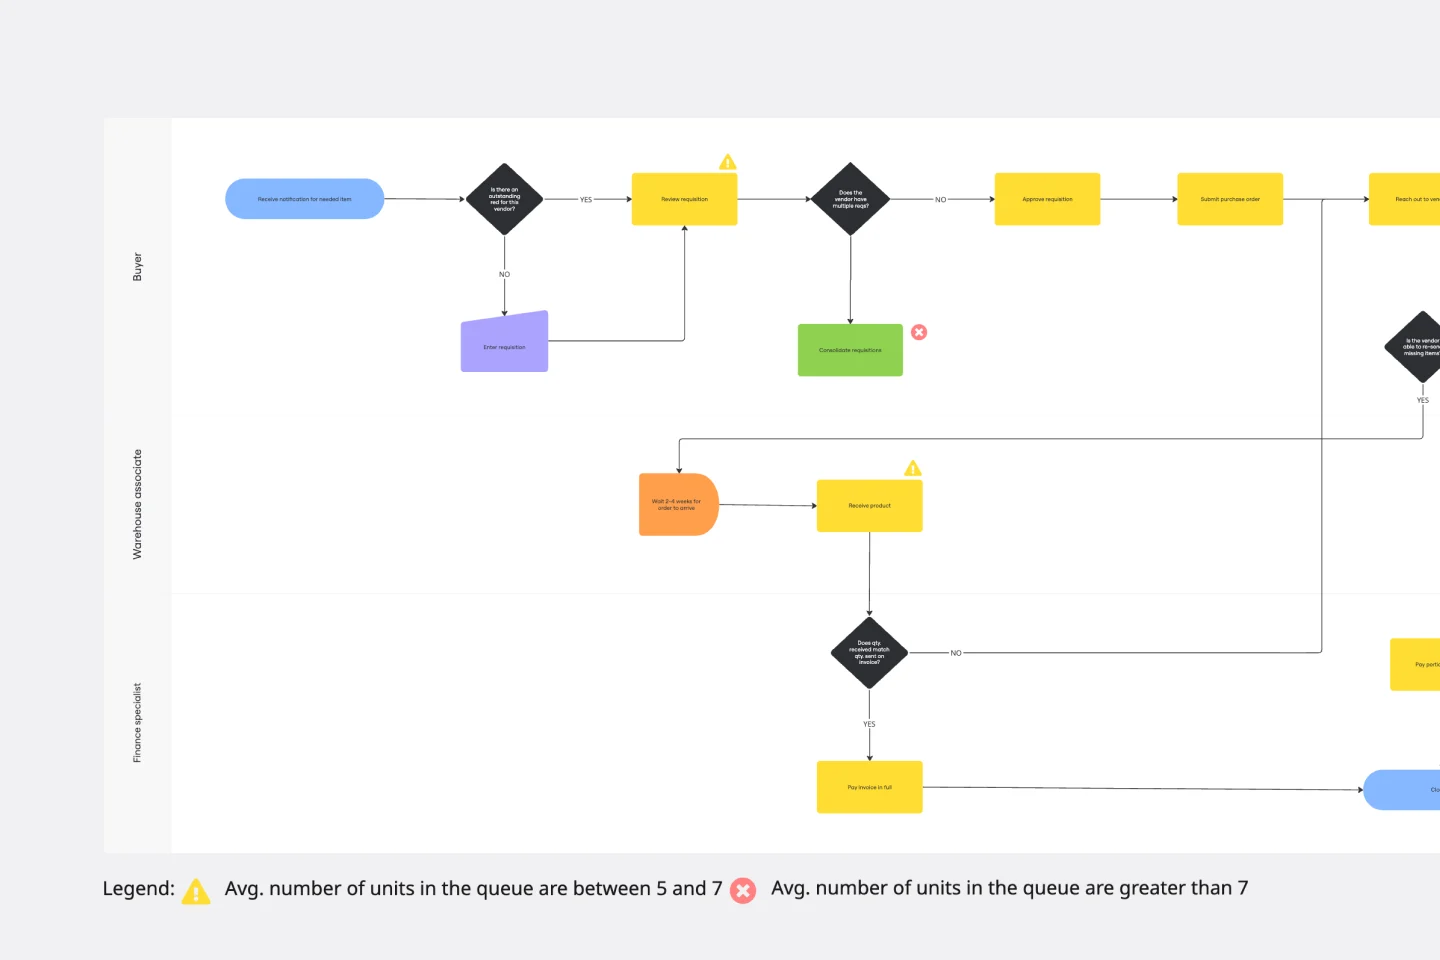
Current State vs. Future State Flowchart Template
The Current State vs Future State Flowchart Template is an essential tool for strategic planning, providing teams with a dynamic and visual roadmap for organizational transformation. One of its key benefits is streamlining collaboration by using swimlanes to allocate tasks to specific departments. This feature promotes accountability and transparent communication, ensuring everyone is aligned on their responsibilities. As a result, teams can navigate complex processes with ease, fostering a shared understanding of the current and future states, ultimately leading to efficient and collaborative decision-making.
Design Process Flowchart Template
Design Process Flowchart Template
The Design Process Flowchart Template is an excellent tool to navigate the complexities of a design project. It offers a clear and organized visual representation of each step in the design journey, making it easier to understand and follow. One of its key benefits is that it enhances team collaboration. By providing a visual outline of the design process, the template fosters a shared understanding among team members, regardless of their individual roles or expertise. This common visual framework enables more efficient communication, aligning everyone's efforts toward a unified goal. As a result, it not only streamlines the workflow but also encourages collective creativity and innovation, which are essential elements in any successful design project.
Troubleshooting Flowchart Template
Troubleshooting Flowchart Template
The Troubleshooting Flowchart Template is an easy-to-use and versatile tool that simplifies problem-solving. It provides a step-by-step visual guide to identify, analyze, and fix issues, ensuring a clear and structured approach to troubleshooting. One of the key benefits of utilizing this template is that it helps improve communication among team members. By representing the troubleshooting steps visually, it simplifies complex processes and makes it easier for team members to understand, collaborate, and contribute efficiently.
If then Flowchart Template
If then Flowchart Template
The If-then Flowchart Template is a useful tool for decision-making. It visually maps out conditional steps and outcomes, allowing users to anticipate potential challenges and opportunities. This foresight is valuable for making informed decisions, especially for those with significant implications. Whether for business strategy, project management, or personal decision-making, the template helps navigate complex decision trees with confidence.
Current State vs. Future State Flowchart Template
Current State vs. Future State Flowchart Template
The Current State vs Future State Flowchart Template is an essential tool for strategic planning, providing teams with a dynamic and visual roadmap for organizational transformation. One of its key benefits is streamlining collaboration by using swimlanes to allocate tasks to specific departments. This feature promotes accountability and transparent communication, ensuring everyone is aligned on their responsibilities. As a result, teams can navigate complex processes with ease, fostering a shared understanding of the current and future states, ultimately leading to efficient and collaborative decision-making.