
Miro
Your virtual workspace for innovation
Miro is an innovation workspace designed for teams of every size, everywhere, to dream, design, and build the future together. Our mission? To empower these teams to create the next big thing, powered by AI at every step of the way. Over 90 million users around the world rely on Miro to untangle complex ideas, put customer needs first, and deliver products and services faster. All supported by best-in-class security, compliance, and scalability.
Categories
Similar templates
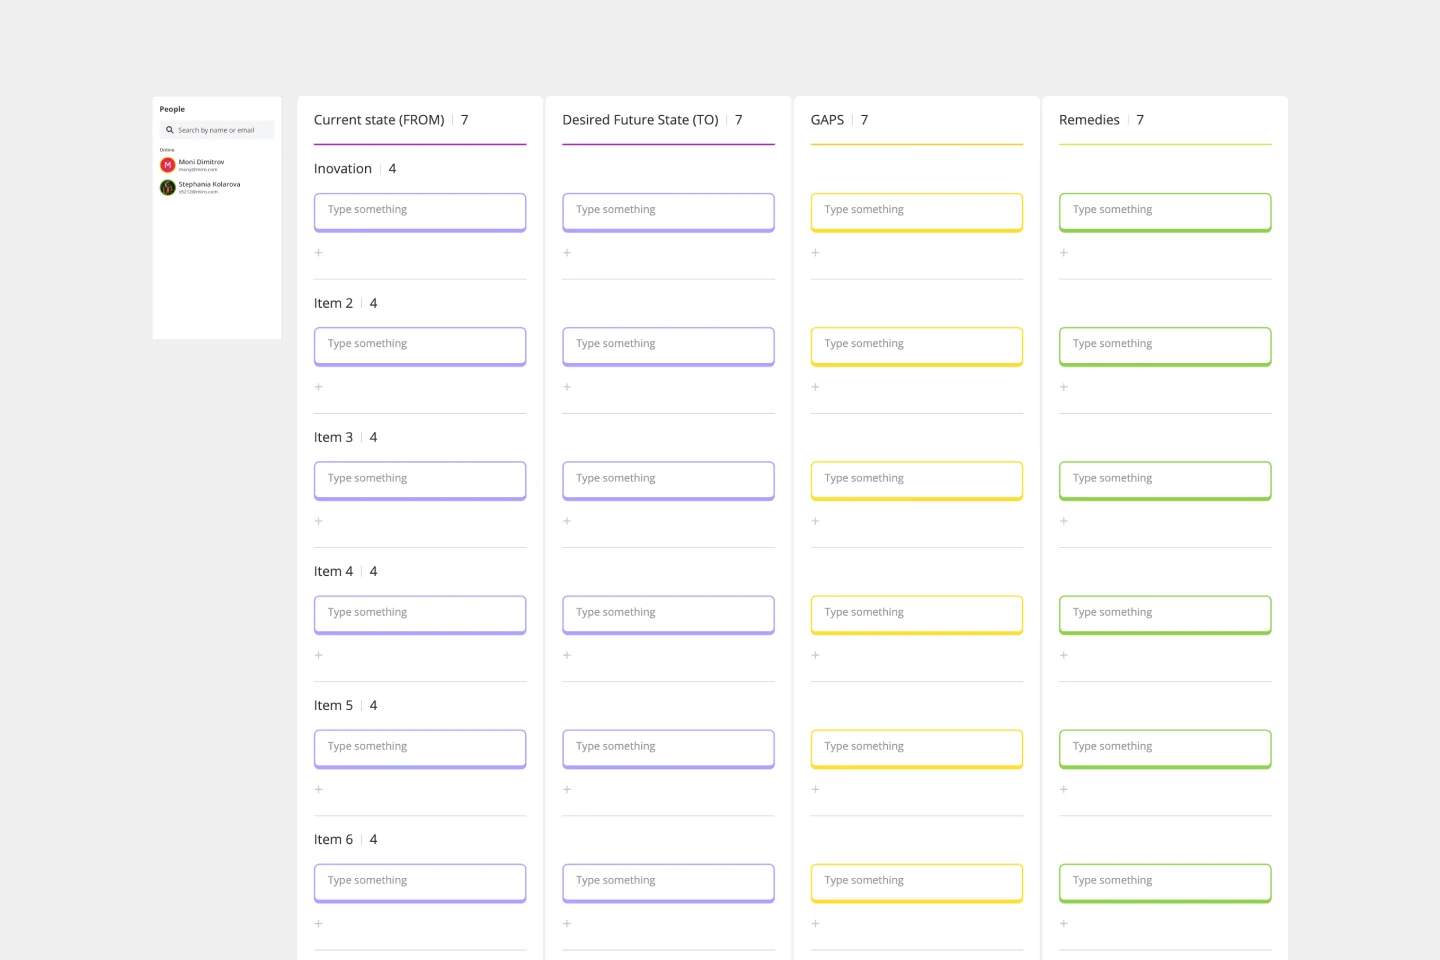
Gap Analysis Template
1 likes
58 uses
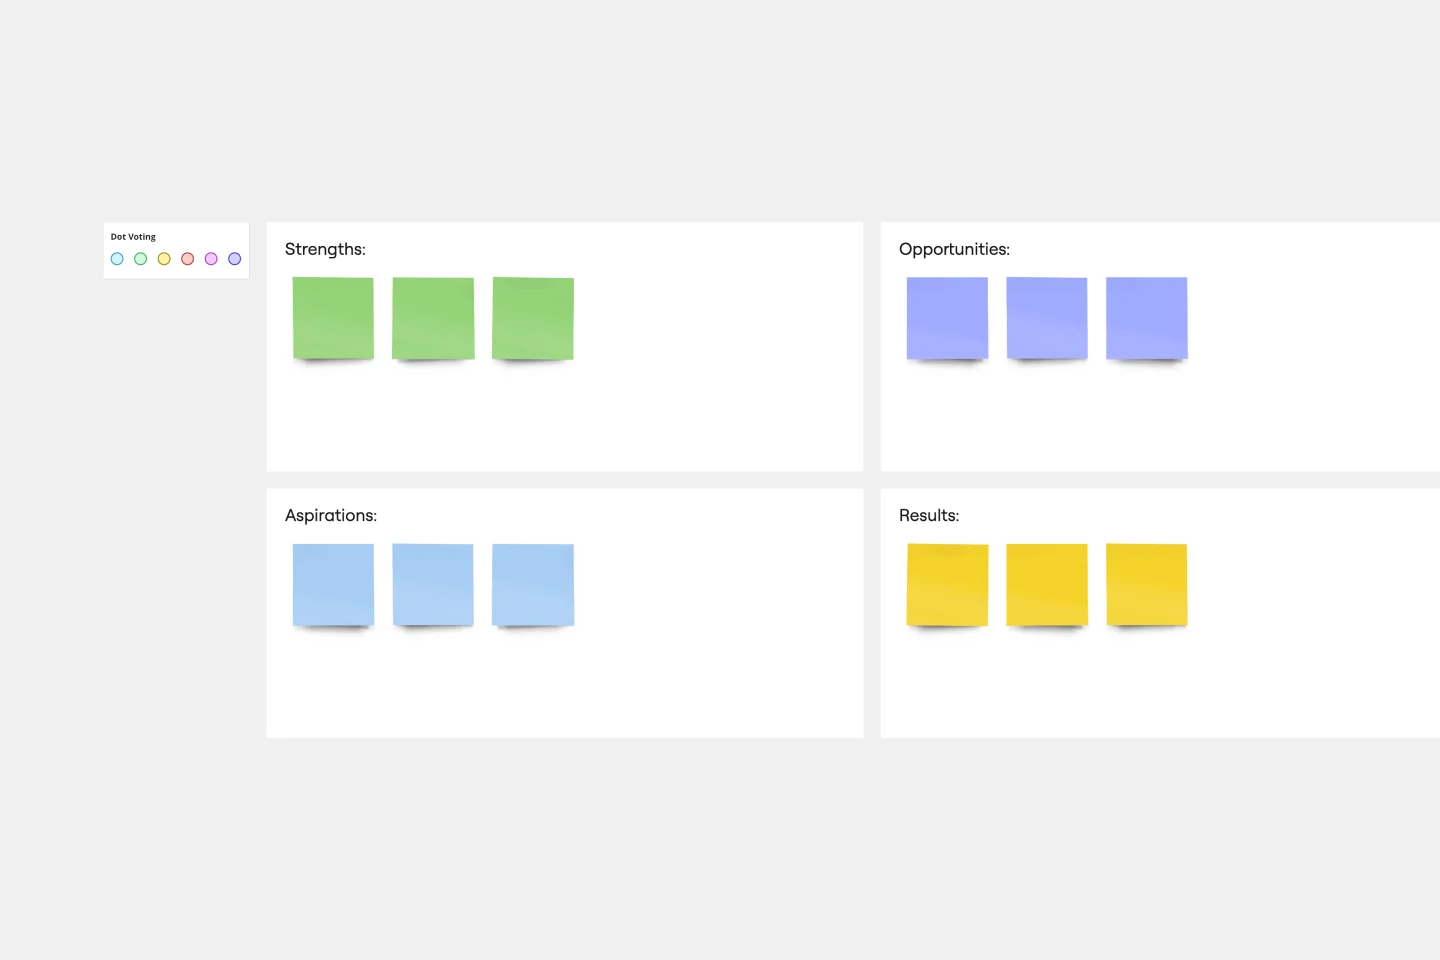
SOAR Analysis Template
1 likes
60 uses
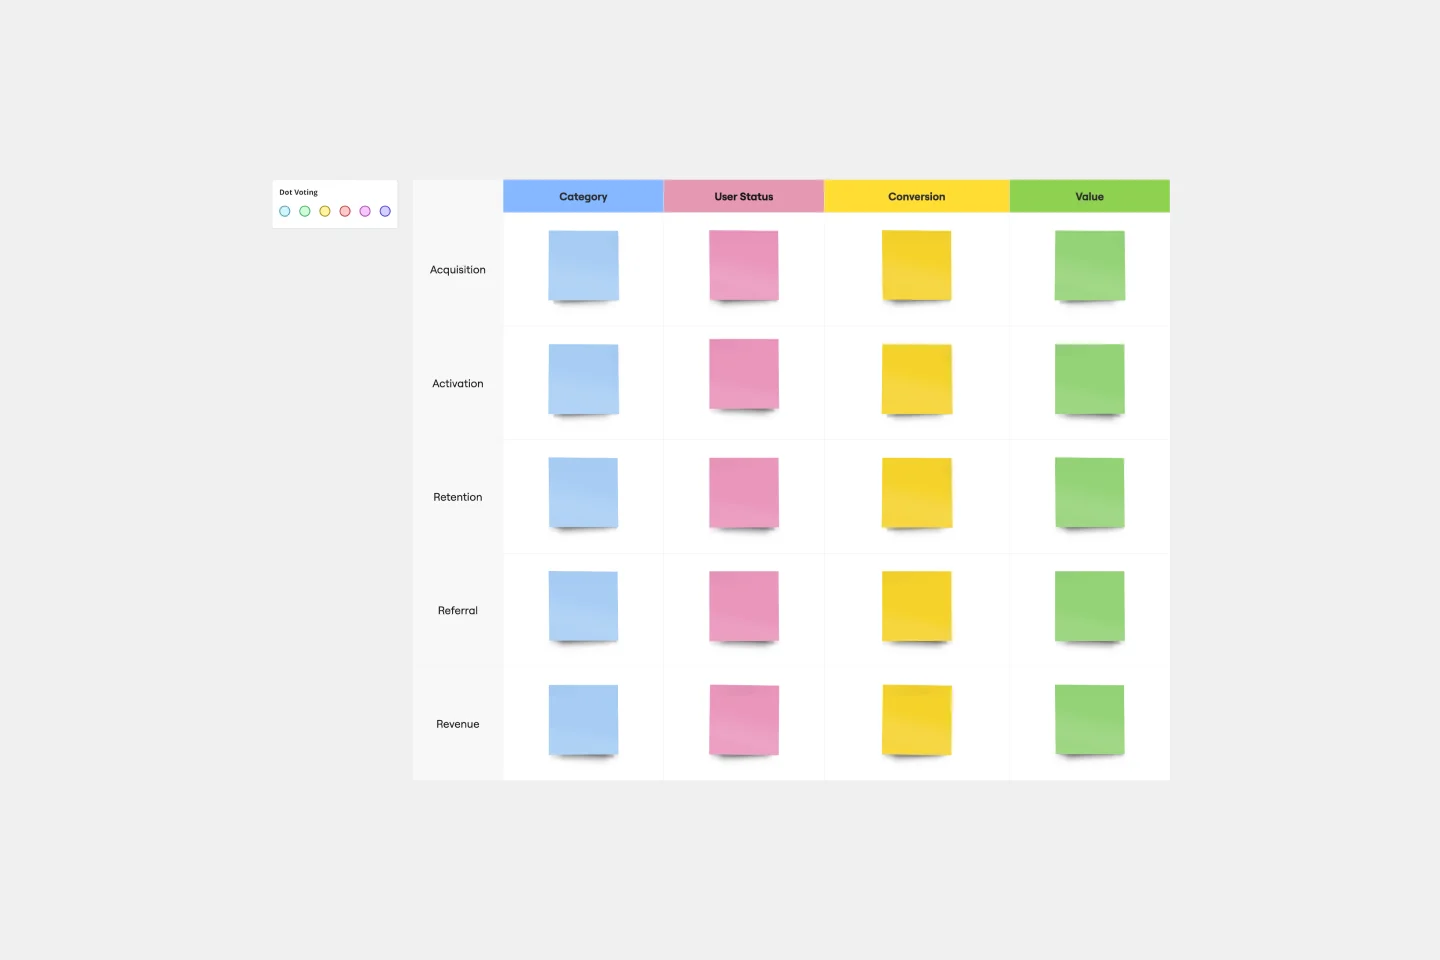
AARRR Template
0 likes
22 uses
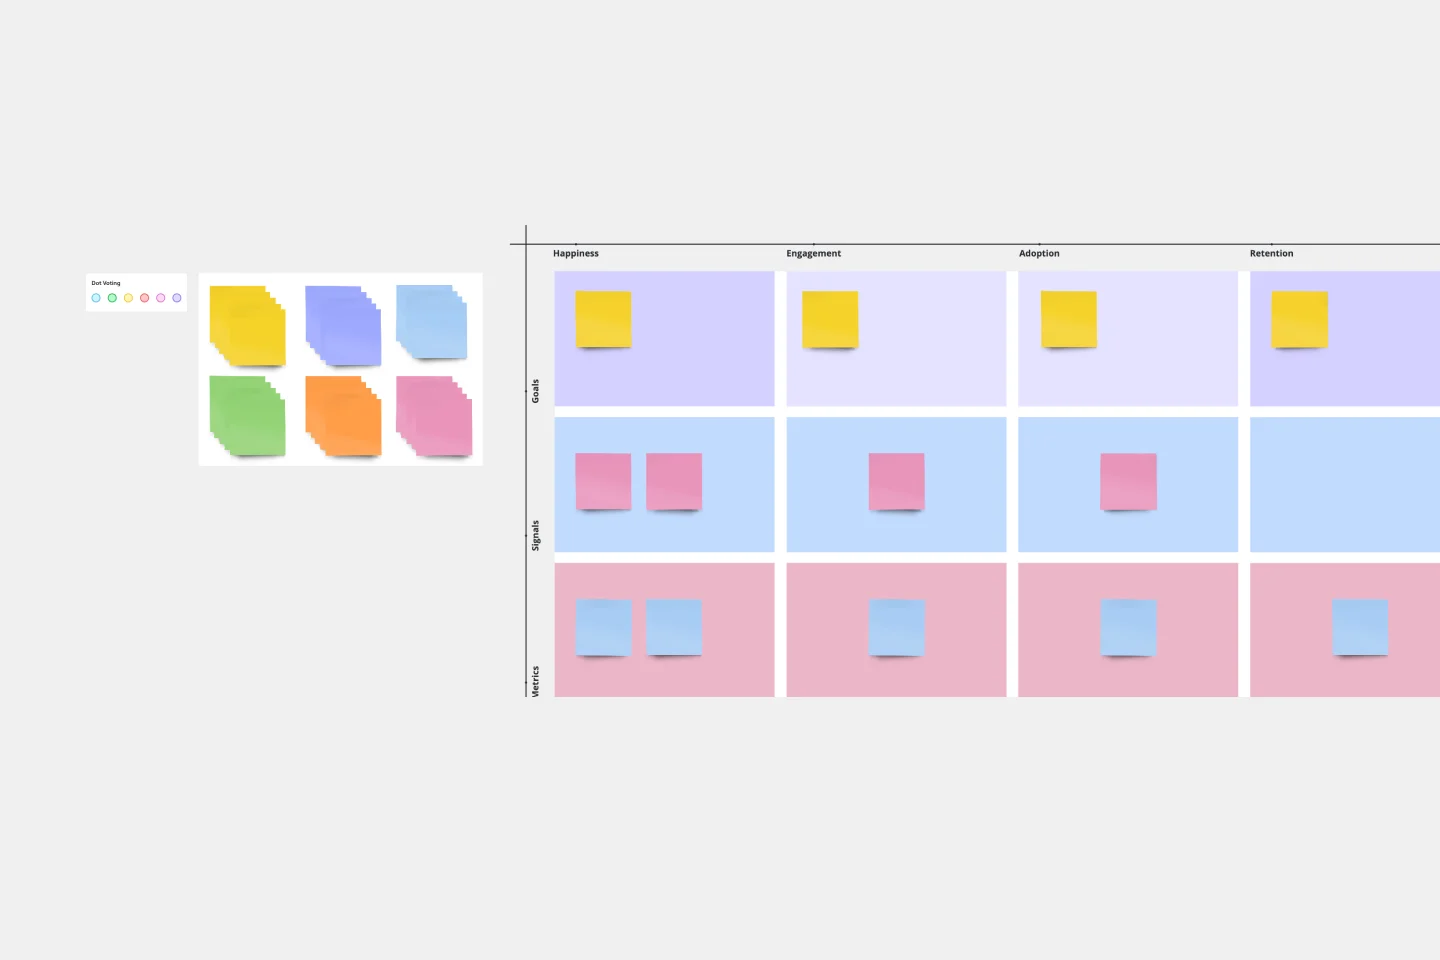
HEART Framework Template
1 likes
11 uses
Gap Analysis Template
1 likes
58 uses
SOAR Analysis Template
1 likes
60 uses
AARRR Template
0 likes
22 uses
HEART Framework Template
1 likes
11 uses