About SAFe Program Boards
Even if you’re not participating in a formal PI session, a SAFe program board can be a great way to establish communication across teams and stakeholders, align development objectives with business goals, clarify dependencies, and foster cross-functional collaboration. Program boards add much-needed structure to planning sessions — yet are adaptable enough to accommodate brainstorming and alignment meetings.
In this guide, we’ll walk you through everything you need to know about SAFe program boards — from what purpose they serve to how you can create one in seconds using our SAFe Program Board Template.
What is a SAFe program board?
A SAFe program board is a visual tool used during Program Increment (PI) Planning to track progress and align teams. It displays key elements like delivery dates, dependencies between teams,and important milestones. This board helps teams see how their work fits into the bigger picture, ensuring everyone stays aligned throughout the Program Increment.
PI planning is integral to the SAFe Agile model. During PI Planning, teams collaborate to identify dependencies and potential risks. The SAFe program board is the key outcome of these sessions, allowing teams to visualize their work, track timelines, and plan for successful delivery.
Benefits of using a SAFe program board
A program board goes beyond visualizing work — it helps teams stay aligned, manage dependencies, and track progress. Let’s take a closer look at the key benefits:
1. Aligns teams and boosts collaboration
The SAFe program board brings teams together by showing how their work fits into the bigger picture. It helps everyone stay aligned on shared goals and supports real-time collaboration during PI Planning, making it easy to adjust plans, solve issues, and keep things moving smoothly.
2. Highlights dependencies to prevent bottlenecks
One of the biggest advantages of using a SAFe program board is its ability to clearly show inter-team dependencies. By making these connections visible, teams can spot potential bottlenecks early, manage risks, and keep projects on track without surprises.
3. Tracks progress and key milestones
The SAFe program board provides an at-a-glance view of progress, helping teams and stakeholders stay informed about key milestones and delivery timelines. This keeps everyone on track to meet deadlines and hit important goals throughout the Program Increment.
When to use a SAFe program board
By now, it’s clear that SAFe program boards are especially useful during PI Planning sessions to present business context, map deliverables, and ensure objectives align with company goals. But you don’t need a formal PI session to make use of one.
Program boards are also valuable for monthly or quarterly planning, all-hands meetings, onboarding new team members, or resolving miscommunication during complex projects.
It's also worth noting that a SAFe program board works well for both in-person and remote teams. Even if your team is spread out, video conferencing with the board allows everyone to collaborate, contribute to planning, and track timelines, deliverables, and milestones together.
How to create a SAFe program board
Ready to create your own Scaled Agile program board? Miro makes it easy with a ready-to-go SAFe Program Board Template. To get started, click on the blue Use template button on this page to open it in Miro. Once you’re in, follow the steps below to make the most of our template and create an effective program board for your team:
1. Label the program board
Start by labeling the slots on the left column with the names of your teams, and the top row with the iteration you're working on. This helps make sure everyone knows who’s involved and what phase the work is in.
2. Add milestones, timelines, and releases
Next, fill in the sections of the board designed to track key deadlines and progress toward your goals. Import your existing Jira cards to visually organize issues and mark dependencies. The template also comes pre-made with a People Widget on the left. Use it to search for your team members’ names and drag and drop their avatar onto relevant cards — allowing you to highlight dependencies in seconds.
3. Add features and enablers
Time to add Features and Enablers. Features refer to the deliverables you're planning to ship during this cycle. Enablers are the supporting activities needed to complete those business tasks. Don’t forget to highlight any relevant dependencies between teams.
4. Sync with your team
Once your program board is set up, use it to align with your team as you work through your projects. Invite team members to view and edit your Miro board in real time, gather input using sticky notes, and tag each other using comments to keep everyone in the loop about changes. You can continuously iterate on the board by moving Features, Enablers, timelines, and milestones as plans evolve.
TIP: Complement your SAFe program board with a PI Planning Board to provide a more detailed, team-specific view of work commitments and iteration plans. Together, these boards offer visibility and coordination at both the program and team levels, helping manage risks, align dependencies, and keep everything on track for successful delivery.
SAFe Program Board FAQ
When should my team use a SAFe program board?
A SAFe program board should be used when you want to provide a visual summary of features or goals, plan when they need to be reached, and would like to visualize any cross-team dependencies impacting the delivery. The board should be used to help communicate the Program to the entire organization
What are the 4 core values of SAFe?
The Four Core Values of SAFe are: Alignment, Built-In Quality, Transparency, and Program Execution. These core values represent the fundamental beliefs that are key to SAFe's effectiveness. These guiding principles help dictate behavior and action for everyone who participates in a SAFe portfolio. Building a program board rooted in SAFe can help you bring these values to your team.

Miro
Your virtual workspace for innovation
Miro is an innovation workspace designed for teams of every size, everywhere, to dream, design, and build the future together. Our mission? To empower these teams to create the next big thing, powered by AI at every step of the way. Over 90 million users around the world rely on Miro to untangle complex ideas, put customer needs first, and deliver products and services faster. All supported by best-in-class security, compliance, and scalability.
Categories
Similar templates
Sprint Review Template
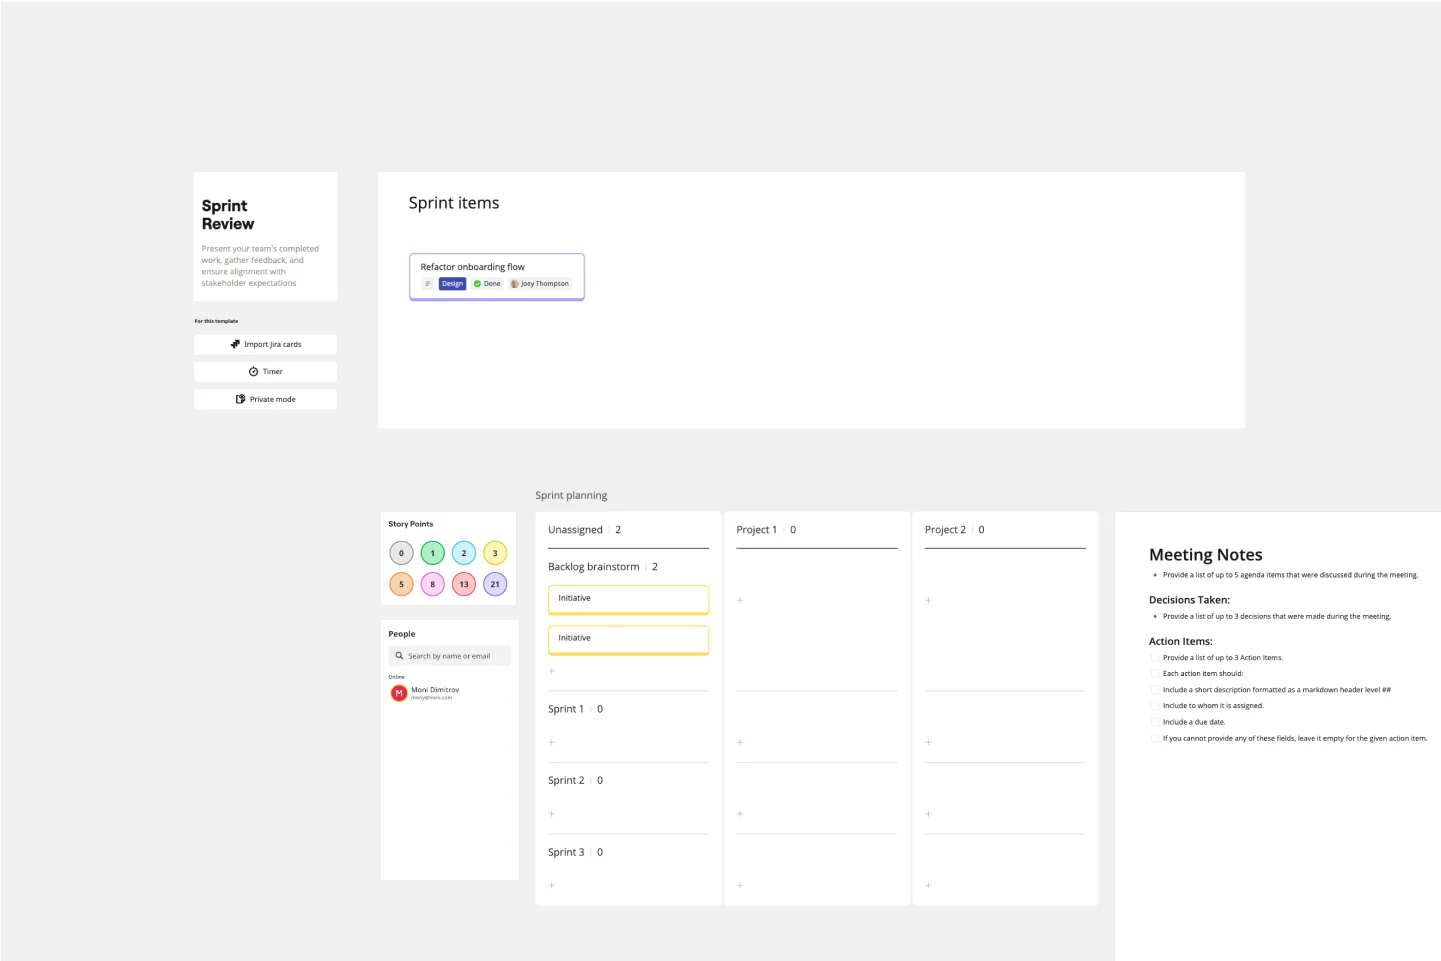
Sprint Review Template
The Sprint Review Template is a vital tool in Agile project management that enhances communication between team members and stakeholders by providing a clear format for presenting the sprint's accomplishments and challenges. It encourages active participation and feedback from all attendees, leading to more informed decision-making and continuous improvement. In essence, it's a catalyst for meaningful dialogue and collaborative growth.
PI Planning (Basic)

Kanban Framework Template
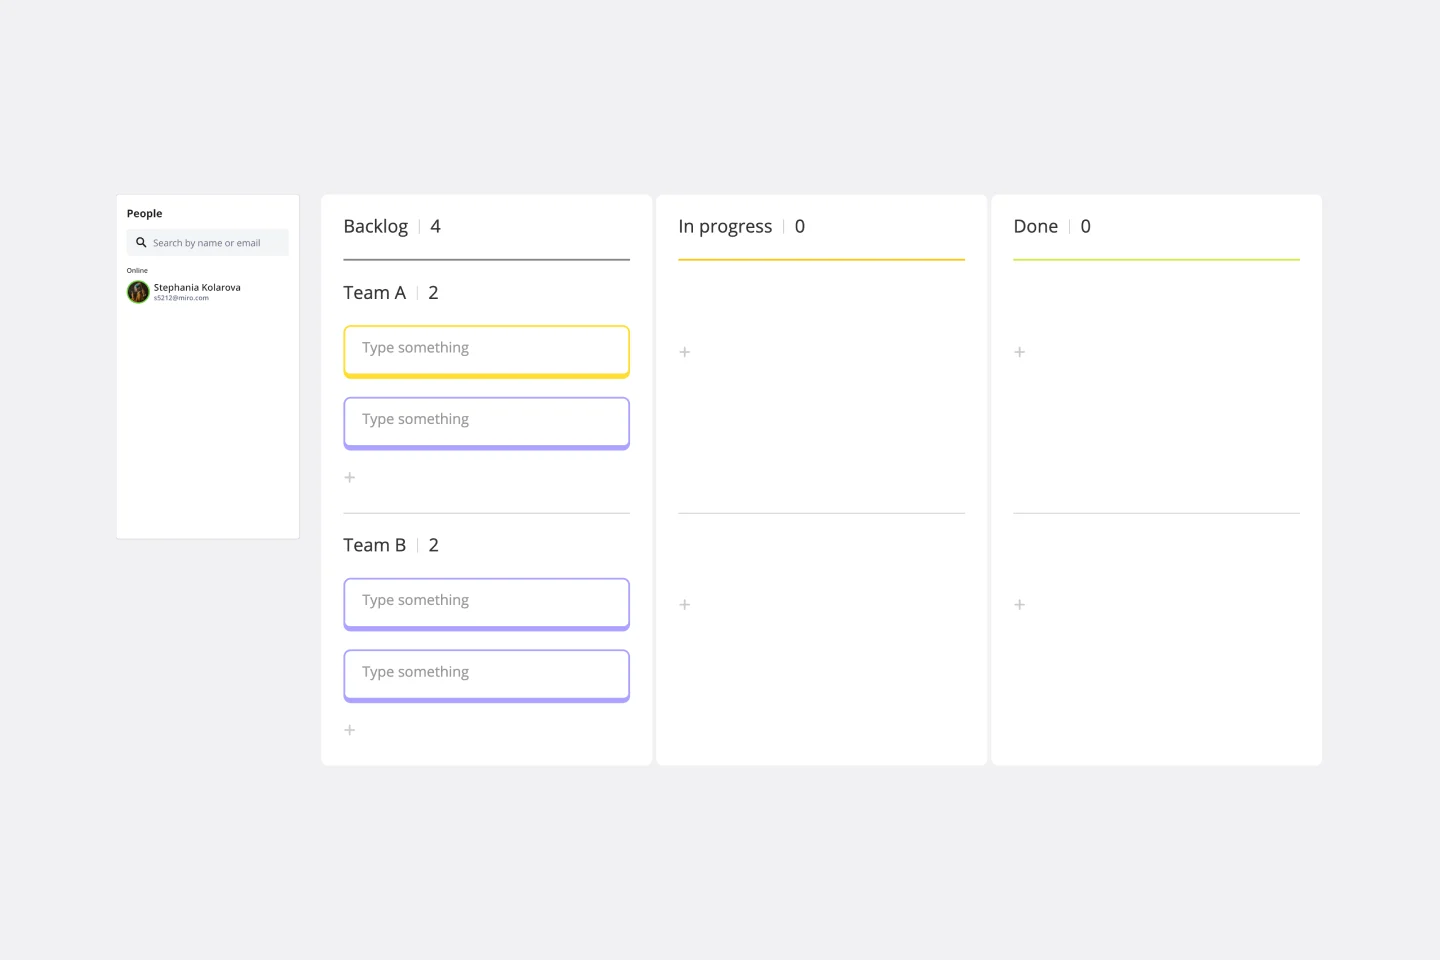
Kanban Framework Template
Optimized processes, improved flow, and increased value for your customers — that’s what the Kanban method can help you achieve. Based on a set of lean principles and practices (and created in the 1950s by a Toyota Automotive employee), Kanban helps your team reduce waste, address numerous other issues, and collaborate on fixing them together. You can use our simple Kanban template to both closely monitor the progress of all work and to display work to yourself and cross-functional partners, so that the behind-the-scenes nature of software is revealed.
Sprint Review Template
Sprint Review Template
The Sprint Review Template is a vital tool in Agile project management that enhances communication between team members and stakeholders by providing a clear format for presenting the sprint's accomplishments and challenges. It encourages active participation and feedback from all attendees, leading to more informed decision-making and continuous improvement. In essence, it's a catalyst for meaningful dialogue and collaborative growth.
PI Planning (Basic)
Kanban Framework Template
Kanban Framework Template
Optimized processes, improved flow, and increased value for your customers — that’s what the Kanban method can help you achieve. Based on a set of lean principles and practices (and created in the 1950s by a Toyota Automotive employee), Kanban helps your team reduce waste, address numerous other issues, and collaborate on fixing them together. You can use our simple Kanban template to both closely monitor the progress of all work and to display work to yourself and cross-functional partners, so that the behind-the-scenes nature of software is revealed.