About the Pugh Matrix Template
The Pugh matrix template is a useful tool for decision-making and comparing multiple options. It helps you in evaluating and ranking different alternatives based on a set of predefined criteria. Use this template to easily visualize and analyze the pros and cons of options, making it easier to make informed decisions. Whether working on a project, conducting research, or making business decisions, the Pugh matrix template is a valuable addition to your toolkit.
What’s the Pugh matrix template?
The Pugh matrix template provides a structured approach to assess different alternatives based on a set of predefined criteria, enabling everyone to make informed and objective decisions.
The main purpose of the Pugh chart template is to visualize and analyze the pros and cons of each option, allowing for a comprehensive understanding of the implications and trade-offs involved. This template is particularly beneficial when faced with complex choices or when there is a need to prioritize various factors.
How to use the Pugh matrix template in Miro
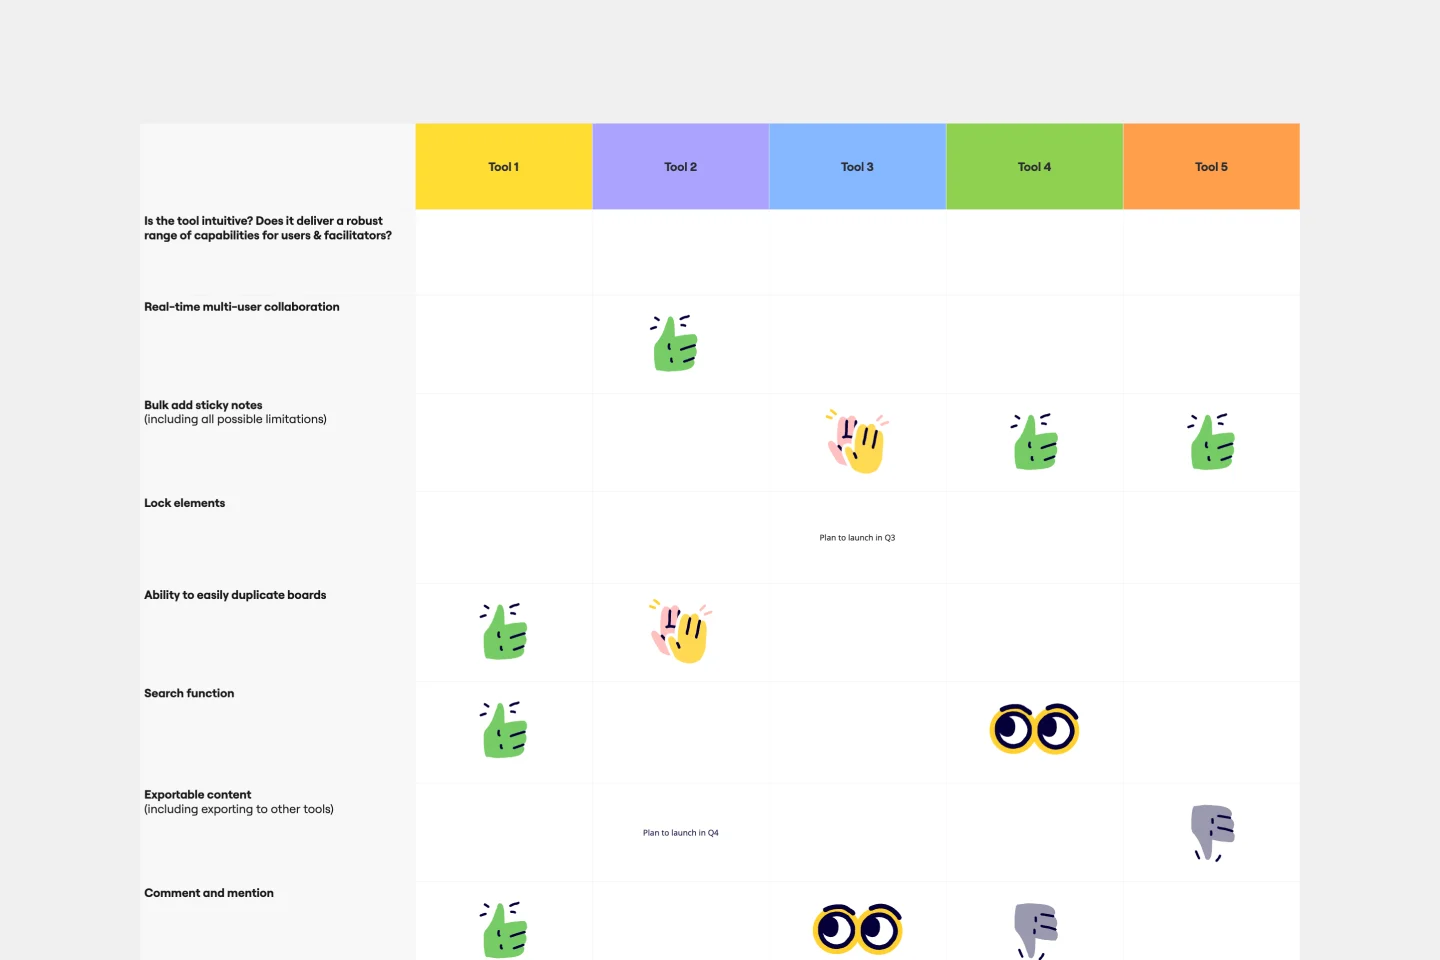
First, to use the Pugh matrix template effectively, start by defining the criteria that are most relevant to your decision. These criteria can be based on cost, feasibility, performance, customer satisfaction, or any other relevant considerations. Assign weights to each criterion to indicate their relative importance.
Next, list the various options or alternatives that you want to evaluate. For each option, assess its performance against each criterion and assign a score or rating. This can be done using a numerical scale or a simple comparison of performance levels.
Once you have evaluated all the options, calculate the overall scores for each alternative by considering the weighted scores for each criterion. The option with the highest overall score indicates the most favorable choice based on the criteria.
Here is a step-by-step on how to use the Pugh matrix template in Miro:
Select the template: You’ll automatically add the template to your board once you click “Use template” button.
Edit the matrix: After selecting your criteria, double-click the matrix cells to add the info. If you need more rows, expand them by clicking the plus icon when selecting the table.
Invite others to join you: Once you set up your matrix, share your board link with others and invite them to join you on your board. Schedule a session with your team, and ask for instant feedback directly on the board.
It is important to note that the Pugh matrix template is not a definitive solution to decision-making. It is a tool that provides a structured approach and facilitates the evaluation and comparison of options. It should be used with critical thinking, domain knowledge, and other decision-making techniques to ensure a comprehensive and well-informed decision.
Why should you use the Pugh matrix template?
One of the key advantages of the Pugh matrix template is its ability to provide a systematic and consistent framework for decision-making. By establishing clear evaluation criteria and assigning weights to each criterion, the template helps ensure that all relevant factors are considered and weighted appropriately.
Also, the visual representation of the matrix makes it easier to identify patterns, trends, and relationships between different options and criteria. This enables teams to identify the strengths and weaknesses of each alternative, facilitating the identification of the most favorable choice. Here are some more benefits of using the template:
Objective decision-making: Instead of relying on gut feelings, the template ensures that decisions are based on predefined criteria, reducing biases.
Visual clarity: By mapping out and comparing different solutions, teams can see the bigger picture, ensuring a comprehensive evaluation.
Collaborative input: The matrix encourages team members to provide input, leveraging collective intelligence.
Efficient and quick analysis: With everything laid out in a matrix form, teams can quickly identify the best solutions.
When to use the Pugh matrix template?
The Pugh matrix template can be applied in various scenarios across industries and domains. It is commonly used in project management, product development, quality improvement processes, and personal decision-making. Whether comparing different design concepts, evaluating potential solutions, or selecting the best course of action, the Pugh chart template can provide structure and clarity to your decision-making process.
Pugh Matrix Template FAQs
What is the Pugh matrix structure?
The Pugh matrix structure, also known as the decision matrix or grid analysis, is used in decision-making and problem-solving. It is a systematic method for evaluating and comparing multiple options or alternatives based on a set of criteria. The Pugh matrix helps to objectively assess the strengths and weaknesses of each option and determine the best course of action.
Can I customize the criteria on the Pugh matrix?
The template is fully editable. You can add, change, or remove any criteria per your project’s needs.
How many solutions can I evaluate using the Pugh matrix template in Miro?
While our default template provides spaces for several solutions, you can easily add more columns to evaluate as many solutions as you need.
Can multiple team members work on the matrix simultaneously?
Yes, Miro allows for real time collaboration. Team members can contribute, edit, and comment on the matrix simultaneously.
Is there a way to save our evaluations for future reference?
Certainly. Once you've completed your evaluations, you can save the Miro board, export it as an image or PDF, or even integrate it with other tools for documentation.

Miro
Your virtual workspace for innovation
Miro is an innovation workspace designed for teams of every size, everywhere, to dream, design, and build the future together. Our mission? To empower these teams to create the next big thing, powered by AI at every step of the way. Over 90 million users around the world rely on Miro to untangle complex ideas, put customer needs first, and deliver products and services faster. All supported by best-in-class security, compliance, and scalability.
Categories
Similar templates
T-Chart Template

T-Chart Template
T-Charts can help you compare and contrast two different ideas, group information into different categories, and prove a change through “before” and “after” analysis. T-Charts are visual organizational tools that enable you to compare ideas, so you can evaluate pros and cons, facts and opinions, strengths and weaknesses, or big-picture views versus specific details. Designers and content creators can use T-Charts to turn possibilities into actionable ideas. T-Charts are useful for discussing differences and similarities with your team or clients and can help you to reach a decision together.
Cost-Benefit Analysis Template

Cost-Benefit Analysis Template
With so many day-to-day decisions to make—and each one feeling high-stakes—it’s easy for all the choices to weigh a business or organization down. You need a systematic way to analyze the risks and rewards. A cost benefit analysis gives you the clarity you need to make smart decisions. This template will let you conduct a CBA to help your team assess the pros and cons of new projects or business proposals—and ultimately help your company preserve your precious time, money, and social capital.
Comparison Chart Template

Comparison Chart Template
Eliminate wasted time and learn to make snap decisions both with your team and on your own. Comparison charts are perfect for collaboration, as they allow you to establish differences between ideas or products and get a full picture of the risks and benefits that come with them.
Assumption Grid Template

Assumption Grid Template
Someone wise once said that nothing in life is certain. But the waters of the business world? It can seem especially uncertain and unclear. An Assumption Grid can help you navigate those waters and make your decisions confidently. It organizes your business ideas according to the certainty and risk of each — then your team can discuss them and make judgment calls, prioritize, mitigate risk, and overcome uncertainties. That’s why an Assumption Grid is a powerful tool for getting past the decision paralysis that every team occasionally faces.
Balanced Scorecard Template

Balanced Scorecard Template
Balanced scorecards are useful tools for understanding business performance at a glance with regard to customers, employees, business processes, and financial progress. Learn more about BSCs and create your own using Miro’s Balanced Scorecard template.
T-Chart Template

T-Chart Template
T-Charts can help you compare and contrast two different ideas, group information into different categories, and prove a change through “before” and “after” analysis. T-Charts are visual organizational tools that enable you to compare ideas, so you can evaluate pros and cons, facts and opinions, strengths and weaknesses, or big-picture views versus specific details. Designers and content creators can use T-Charts to turn possibilities into actionable ideas. T-Charts are useful for discussing differences and similarities with your team or clients and can help you to reach a decision together.
Cost-Benefit Analysis Template

Cost-Benefit Analysis Template
With so many day-to-day decisions to make—and each one feeling high-stakes—it’s easy for all the choices to weigh a business or organization down. You need a systematic way to analyze the risks and rewards. A cost benefit analysis gives you the clarity you need to make smart decisions. This template will let you conduct a CBA to help your team assess the pros and cons of new projects or business proposals—and ultimately help your company preserve your precious time, money, and social capital.
Comparison Chart Template

Comparison Chart Template
Eliminate wasted time and learn to make snap decisions both with your team and on your own. Comparison charts are perfect for collaboration, as they allow you to establish differences between ideas or products and get a full picture of the risks and benefits that come with them.
Assumption Grid Template

Assumption Grid Template
Someone wise once said that nothing in life is certain. But the waters of the business world? It can seem especially uncertain and unclear. An Assumption Grid can help you navigate those waters and make your decisions confidently. It organizes your business ideas according to the certainty and risk of each — then your team can discuss them and make judgment calls, prioritize, mitigate risk, and overcome uncertainties. That’s why an Assumption Grid is a powerful tool for getting past the decision paralysis that every team occasionally faces.
Balanced Scorecard Template

Balanced Scorecard Template
Balanced scorecards are useful tools for understanding business performance at a glance with regard to customers, employees, business processes, and financial progress. Learn more about BSCs and create your own using Miro’s Balanced Scorecard template.