About the Production Flowchart Template
Do you want to simplify your production processes? Use the production flowchart template to break down each step, visualizing the production flow and spot areas for optimization.
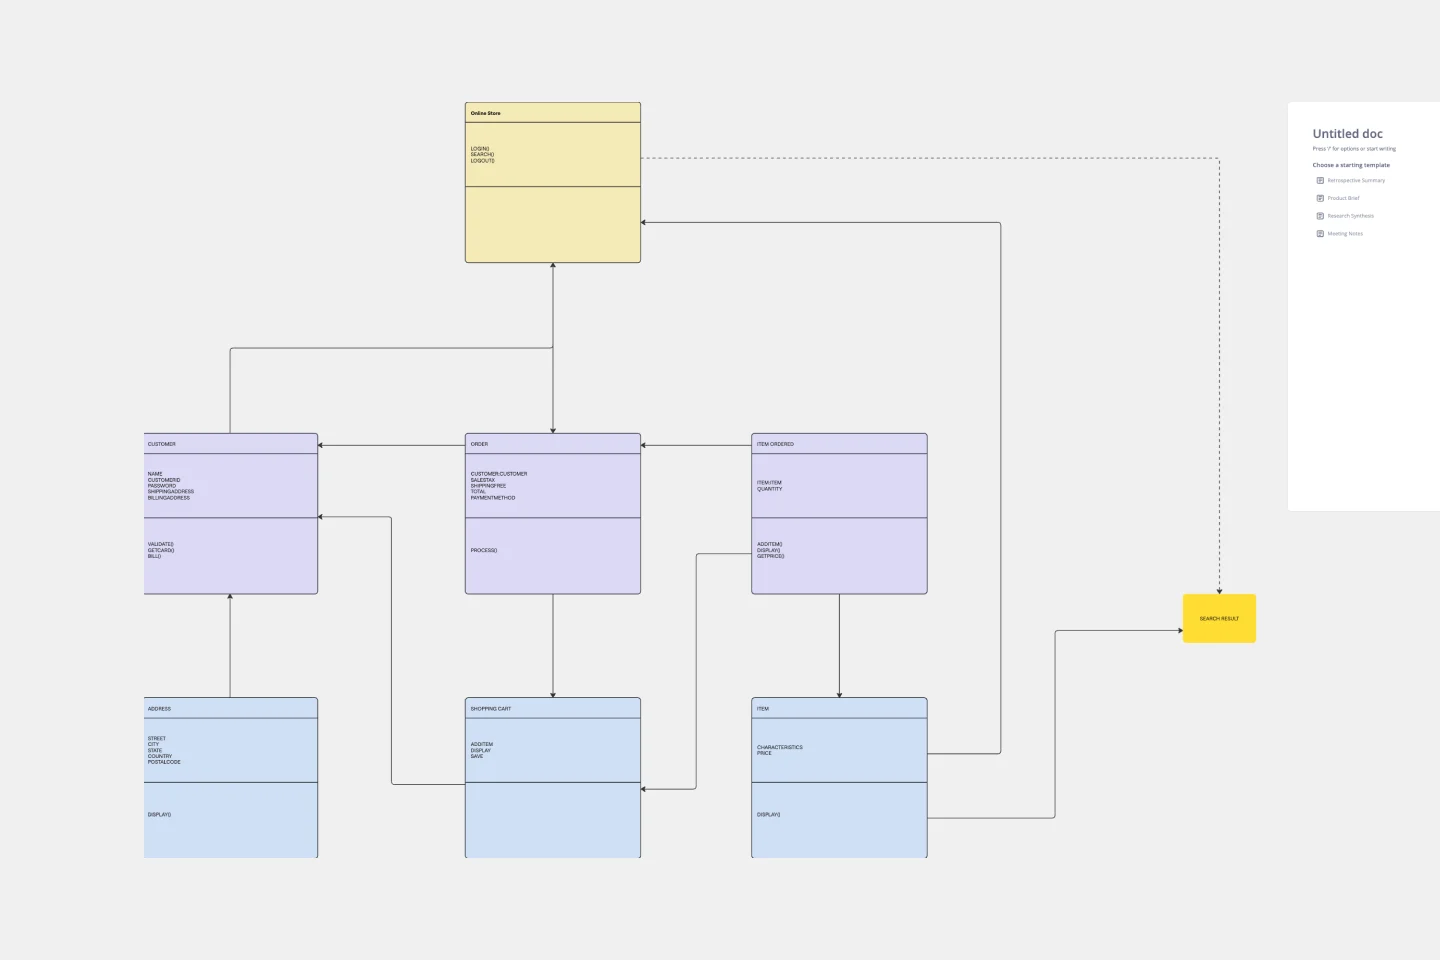
The template consists of a pre-designed diagram that showcases the systematic breakdown of the production process. Each area of the template signifies a distinct phase or step in the process, making it easier to understand the progression of tasks.
The production flowchart template contains the following attributes:
Shapes: These represent different steps or processes. They can be customized to differentiate tasks, departments, or stages.
Connector Lines: These link the shapes together, indicating the sequence or flow between tasks.
Annotations: Useful for adding extra information or context about a particular process or step.
Colors: Can be applied to shapes or lines to categorize or prioritize processes.
This template can be customized to meet the unique requirements of any production, making it the perfect solution for your needs.
How to use the production flowchart template in Miro
Add your production flow: Open the template and edit the shapes, colors, and texts to represent your production process.
Expand the flowchart: Use Miro’s automated diagramming features to add more shapes and connector lines until your production process is accurately represented.
Add any extra context: Integrate other artifacts or elements on the board to provide any additional context that helps visualize or understand your production process.
Why should you use a production flowchart template?
Breaking down a production process from start to finish makes it easy to visualize complex operations. In addition to serving as a useful guide, this template has many benefits:
Provides clarity: A detailed flowchart provides a clear visualization of the production process, making it easier for all involved to understand.
Efficiency: Identifying and rectifying bottlenecks becomes straightforward when each step of the process is mapped out.
Collaboration: Team members can collaborate in real time, offering suggestions and improvements.
Optimization: With a comprehensive overview, teams can streamline operations, reducing costs and improving output.
Documentation: The template acts as a reference point, ensuring everyone follows the established procedures. The template is easy to update as the production process changes, ensuring the most up-to-date version is always shared.
If you'd prefer to start from scratch, Miro's easy flowchart tool will help you build an online flowchart in no time. With Miro's collaboration features, you can workshop it with your team and easily share it with others for feedback with tagging, comments and sticky notes.
Production flowchart template FAQs
Can I customize the shapes and colors of the template?
Absolutely! The template is designed for full customization, allowing you to adjust shapes, colors, and text to represent your process best.
Is it suitable for all types of production processes?
Yes, the template is versatile and can be used for different types of productions. Whether you're mapping a simple or complex process, the template can be adapted to fit your needs.
How can I collaborate with team members using this template?
Miro allows for real-time collaboration. Team members can simultaneously view, edit, and comment, making collective input seamless.
Are there any limitations to how much I can expand the template?
With Miro’s infinite canvas, you can expand the template as much as you need — and if things get too expansive, simply zoom out or rearrange for clarity.

Miro
Your virtual workspace for innovation
Miro is an innovation workspace designed for teams of every size, everywhere, to dream, design, and build the future together. Our mission? To empower these teams to create the next big thing, powered by AI at every step of the way. Over 90 million users around the world rely on Miro to untangle complex ideas, put customer needs first, and deliver products and services faster. All supported by best-in-class security, compliance, and scalability.
Categories
Similar templates
Website Flowchart Template
Website Flowchart Template
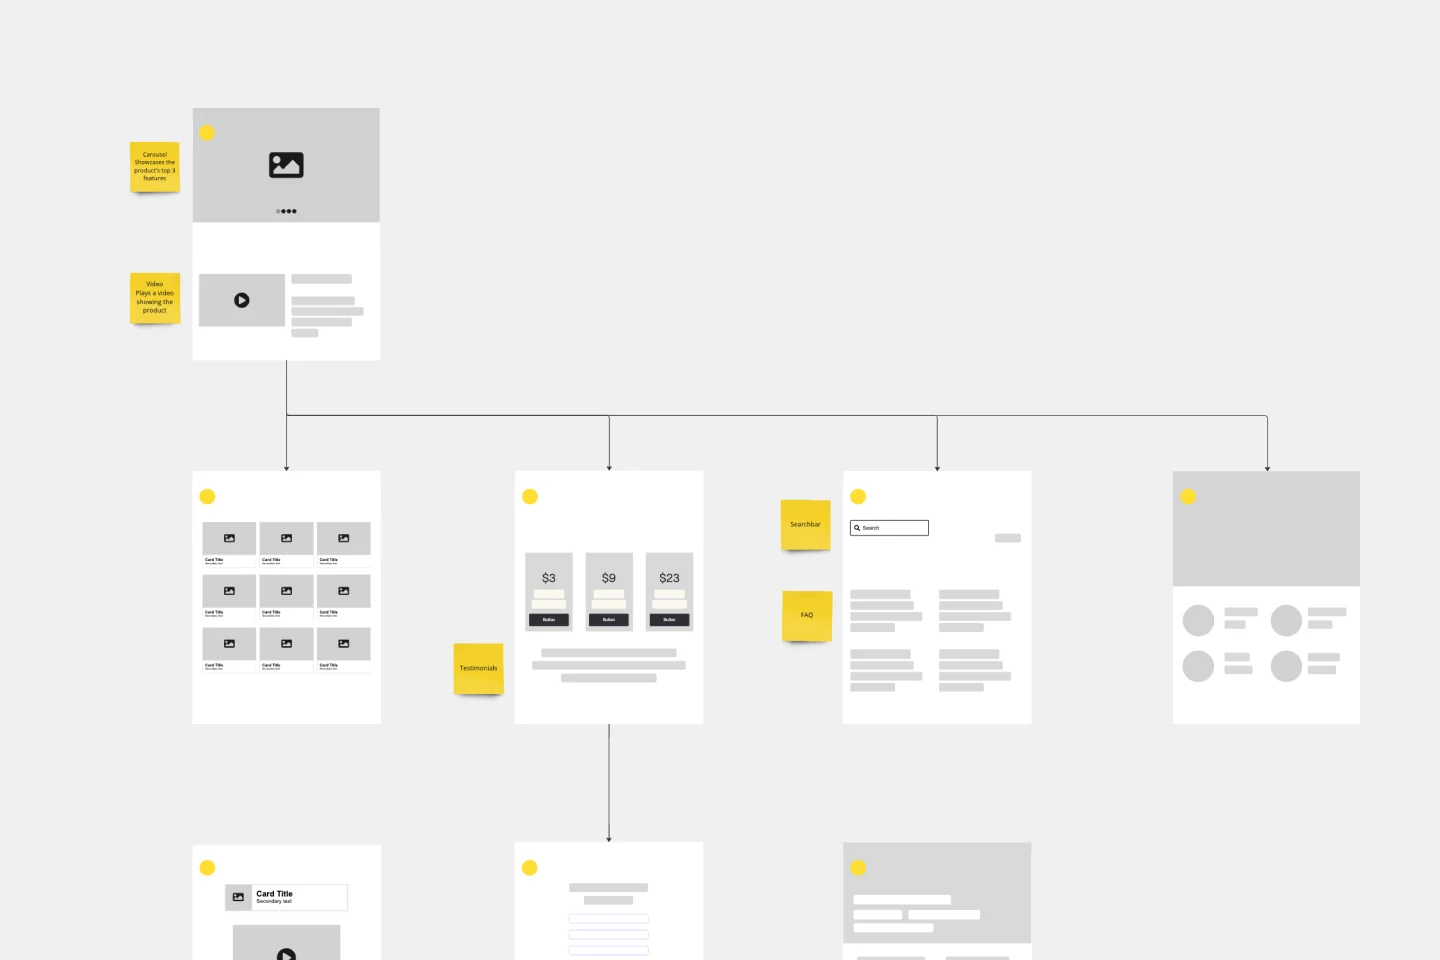
A website flowchart, also known as a sitemap, maps out the structure and complexity of any current or future website. The flowchart can also help your team identify knowledge gaps for future content. When you’re building a website, you want to ensure that each piece of content gives users accurate research results based on keywords associated with your web content. Product, UX, and content teams can use flowcharts or sitemaps to understand everything contained in a website, and plan to add or restructure content to improve a website’s user experience.
Cross Functional Flowchart
Cross Functional Flowchart
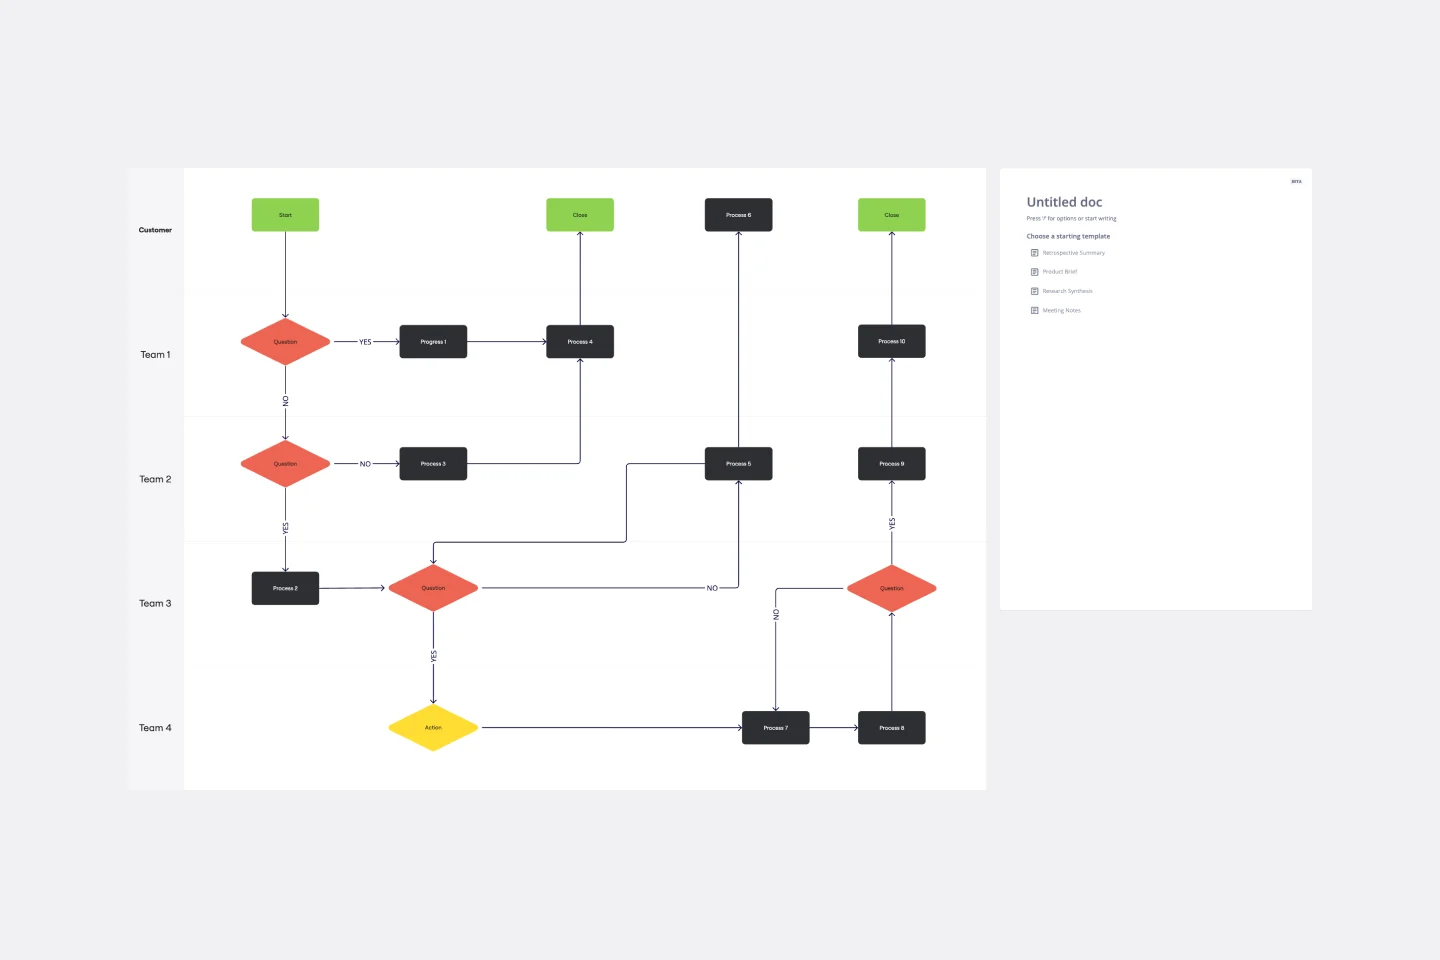
Have a quick look at everyone on a project and see exactly what they’ll contribute. That’s the clarity and transparency a cross-functional flowchart will give you. These are also called “swim lane” flowcharts because each person (each customer, client, or representative from a specific function) is assigned a lane—a clear line—that will help you visualize their roles at each stage of the project. This template will empower you to streamline processes, reduce inefficiencies, and make meaningful cross-functional relationships.
Flowchart Template
Flowchart Template
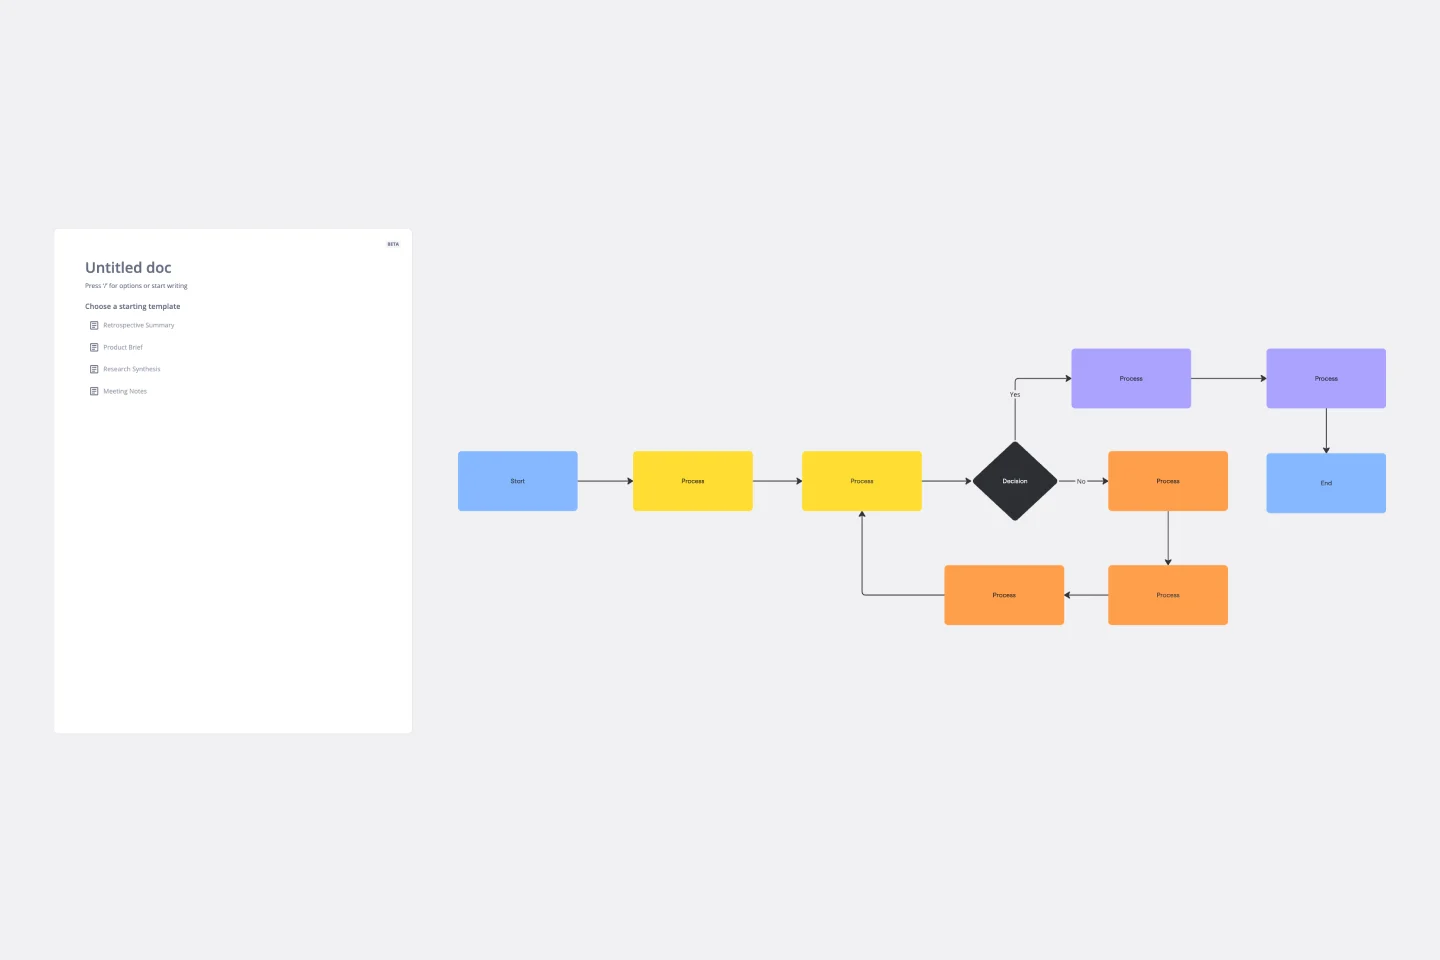
Trying to explain a process or workflow to your team — or just wrap your head around it yourself? Sometimes the best way is to see it, and that’s when you create a flowchart. Using common shapes (generally just ovals, rectangles, diamonds, and arrows), a flowchart shows you the direction a process or workflow goes and the order of steps. Beyond giving you a clear understanding, you’ll also be able to see potential flaws and bottlenecks, which helps you refine and improve your process and create a better product more efficiently.
Workflow Template
Workflow Template
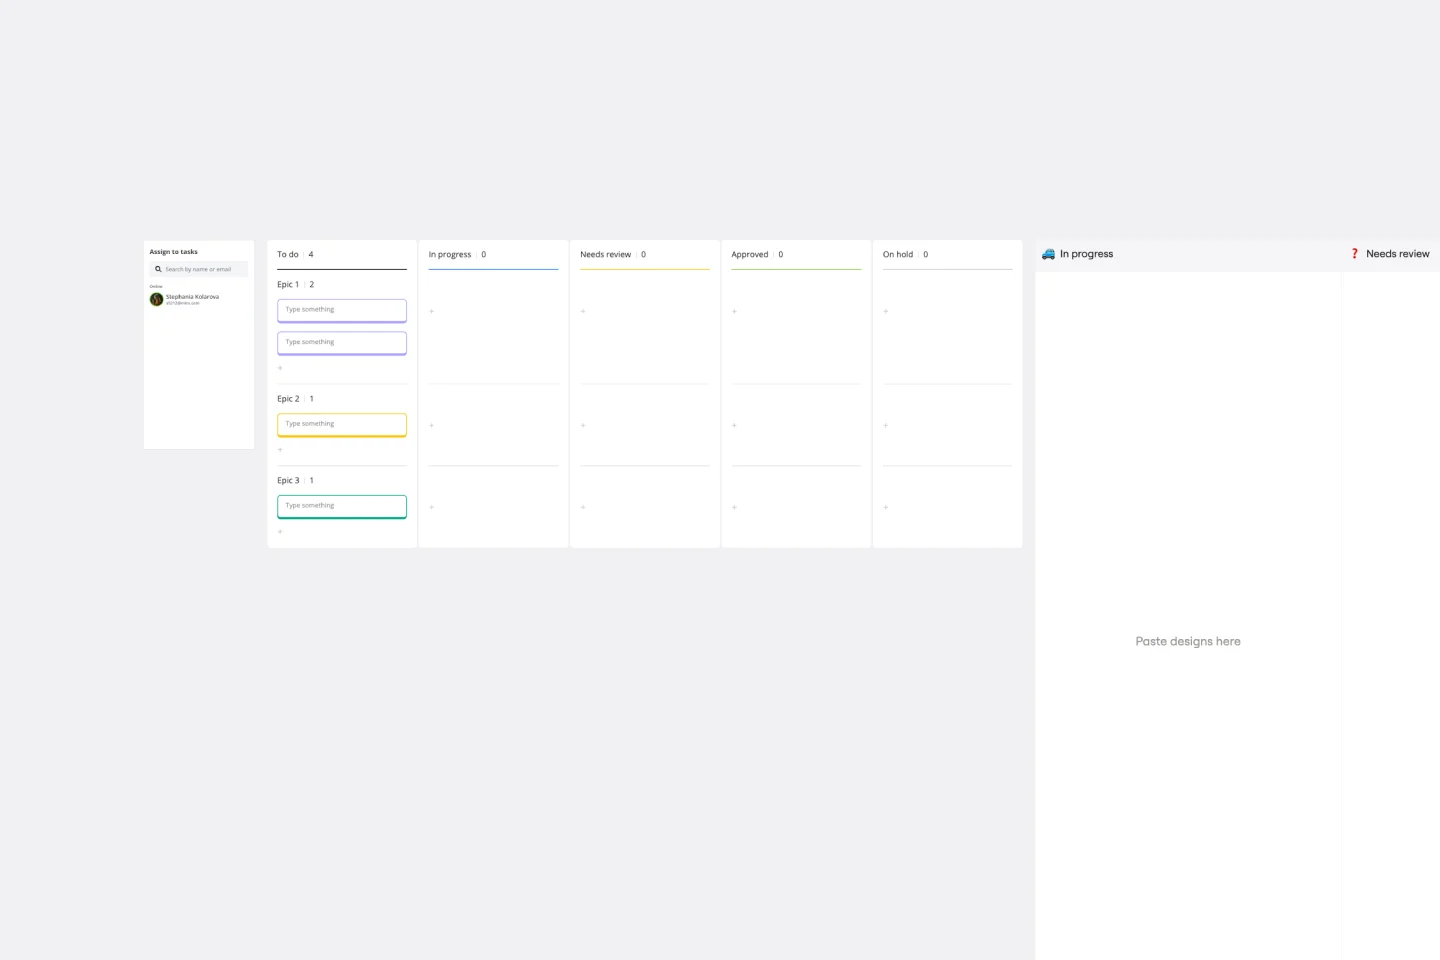
The digital world requires collaboration, and better collaboration leads to better results. A workflow is a project management tool that allows you to sketch out the various steps, resources, timeline and roles necessary to complete a project. It can be used on any multi-step project, whether it’s a business process or otherwise, and is ideal for plotting out the tangible actions you’ll need to take to achieve a goal and the order in which you need to complete those actions.
UML Diagram Template
UML Diagram Template
Originally used as a modeling language in software engineering, UML has become a popular approach to application structures and documenting software. UML stands for Unified Modeling Language, and you can use it to model business processes and workflows. Like flowcharts, UML diagrams can provide your organization with a standardized method of mapping out step-by-step processes. They allow your team to easily view the relationships between systems and tasks. UML diagrams are an effective tool that can help you bring new employees up to speed, create documentation, organize your workplace and team, and streamline your projects.
Website Flowchart Template
Website Flowchart Template
A website flowchart, also known as a sitemap, maps out the structure and complexity of any current or future website. The flowchart can also help your team identify knowledge gaps for future content. When you’re building a website, you want to ensure that each piece of content gives users accurate research results based on keywords associated with your web content. Product, UX, and content teams can use flowcharts or sitemaps to understand everything contained in a website, and plan to add or restructure content to improve a website’s user experience.
Cross Functional Flowchart
Cross Functional Flowchart
Have a quick look at everyone on a project and see exactly what they’ll contribute. That’s the clarity and transparency a cross-functional flowchart will give you. These are also called “swim lane” flowcharts because each person (each customer, client, or representative from a specific function) is assigned a lane—a clear line—that will help you visualize their roles at each stage of the project. This template will empower you to streamline processes, reduce inefficiencies, and make meaningful cross-functional relationships.
Flowchart Template
Flowchart Template
Trying to explain a process or workflow to your team — or just wrap your head around it yourself? Sometimes the best way is to see it, and that’s when you create a flowchart. Using common shapes (generally just ovals, rectangles, diamonds, and arrows), a flowchart shows you the direction a process or workflow goes and the order of steps. Beyond giving you a clear understanding, you’ll also be able to see potential flaws and bottlenecks, which helps you refine and improve your process and create a better product more efficiently.
Workflow Template
Workflow Template
The digital world requires collaboration, and better collaboration leads to better results. A workflow is a project management tool that allows you to sketch out the various steps, resources, timeline and roles necessary to complete a project. It can be used on any multi-step project, whether it’s a business process or otherwise, and is ideal for plotting out the tangible actions you’ll need to take to achieve a goal and the order in which you need to complete those actions.
UML Diagram Template
UML Diagram Template
Originally used as a modeling language in software engineering, UML has become a popular approach to application structures and documenting software. UML stands for Unified Modeling Language, and you can use it to model business processes and workflows. Like flowcharts, UML diagrams can provide your organization with a standardized method of mapping out step-by-step processes. They allow your team to easily view the relationships between systems and tasks. UML diagrams are an effective tool that can help you bring new employees up to speed, create documentation, organize your workplace and team, and streamline your projects.