
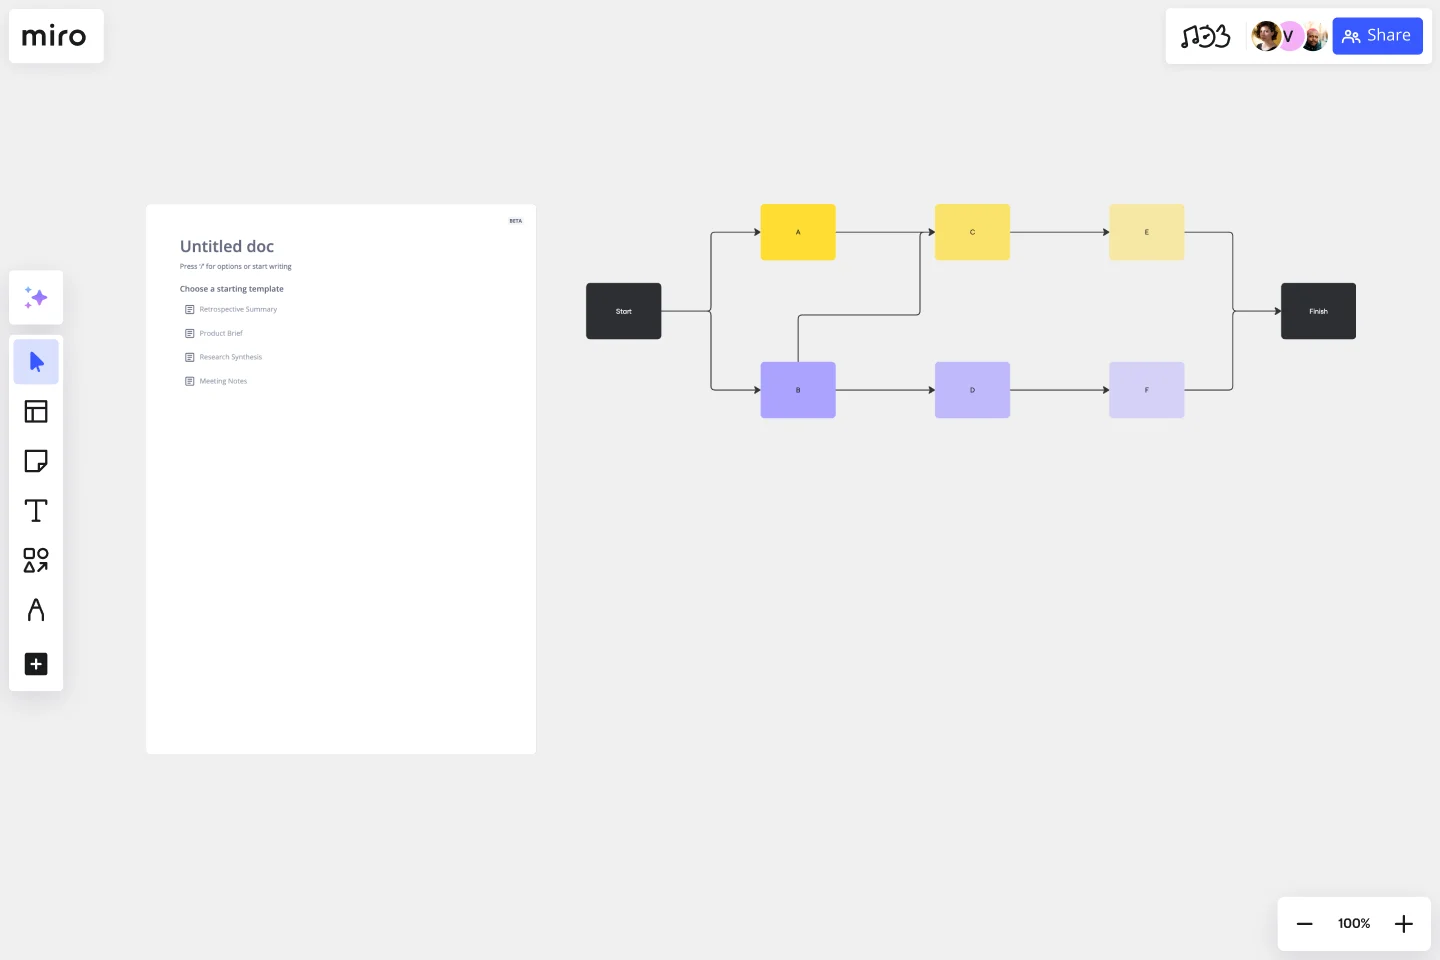
Precedence Diagram
Optimize resource allocation with the Precedence Diagram Template. By discerning which tasks can run concurrently and which need to wait for others to complete, teams can manage their resources more effectively, ensuring smoother, more efficient project progression.
About the Precedence Diagram Template
The Precedence Diagram Template is a powerful resource to help teams visualize their project workflows with clarity and precision. By enabling a clear representation of project management processes, the template fosters enhanced productivity and streamlines tasks, ensuring teams can navigate their projects with confidence and efficiency.
What is a Precedence Diagram?
A precedence diagram, often called a Project Network Diagram, is a graphical tool that shows project activities and their interdependencies. By visualizing these connections, teams can gain clarity on the order in which tasks must be performed and identify which tasks can occur concurrently. The template is designed to simplify the creation of these valuable visualizations.
One significant benefit of using the Precedence Diagram Template is its ability to enhance project efficiency. By clearly outlining task sequences and potential overlaps, project managers can allocate resources more effectively and avoid bottlenecks, ensuring that the project remains on track and meets its deadlines. This foresight can save time and lead to substantial cost savings, making the precedence diagram an indispensable tool for any project-driven team.
How to use a Precedence Diagram Template in Miro
Miro's interactive board features, coupled with its automated diagramming capabilities, make creating precedence diagrams a breeze. Here's how you can set up a Precedence Diagram Template on your Miro board in four simple steps:
Select the Precedence Diagram Template: In the Template Library, search for "precedence diagram" and select the template from the results.
Customize your diagram: Use Miro's automated diagramming features to draw connections between tasks, indicating their relationships. Simply drag and drop items to reposition them or connect them with arrows to show the flow of tasks.
Collaborate and share: Invite your team members to collaborate in real time. Miro enables you to discuss, edit, and refine the diagram, ensuring everyone's on the same page.
Can I customize the look and feel of the precedence diagram?
Yes, Miro's interface is highly intuitive, allowing you to change colors, shapes, and fonts to match your team or project's branding.
Is there a limit to how many tasks I can add to my diagram?
There's no strict limit. However, for readability and usability, we recommend ensuring that your diagram remains clear and uncluttered by periodically reviewing and refining it.
Can I link other Miro boards or external resources to tasks in the precedence diagram?
Yes, you can! Simply use the linking tool in Miro to connect tasks to relevant boards or external resources, providing more context and information.
How do I ensure that only authorized team members can edit the diagram?
Miro allows you to set permissions for each individual or group. You can grant view-only, commenting, or editing access based on what's suitable for your team's needs.
Get started with this template right now.
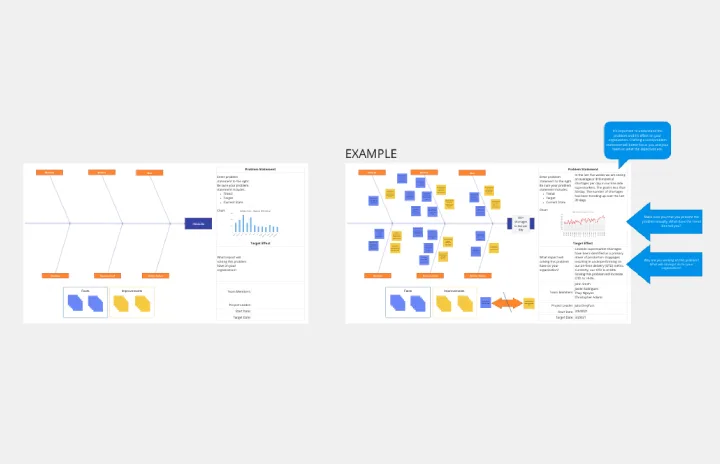
Crowd Sourced Cause and Effect
Works best for:
Fishbone Diagram, Problem solving
The Crowd Sourced Cause and Effect template leverages collective intelligence to identify root causes of problems. By involving multiple team members, you can gather diverse perspectives and uncover insights that might be overlooked. This collaborative approach ensures a comprehensive analysis and fosters team engagement.
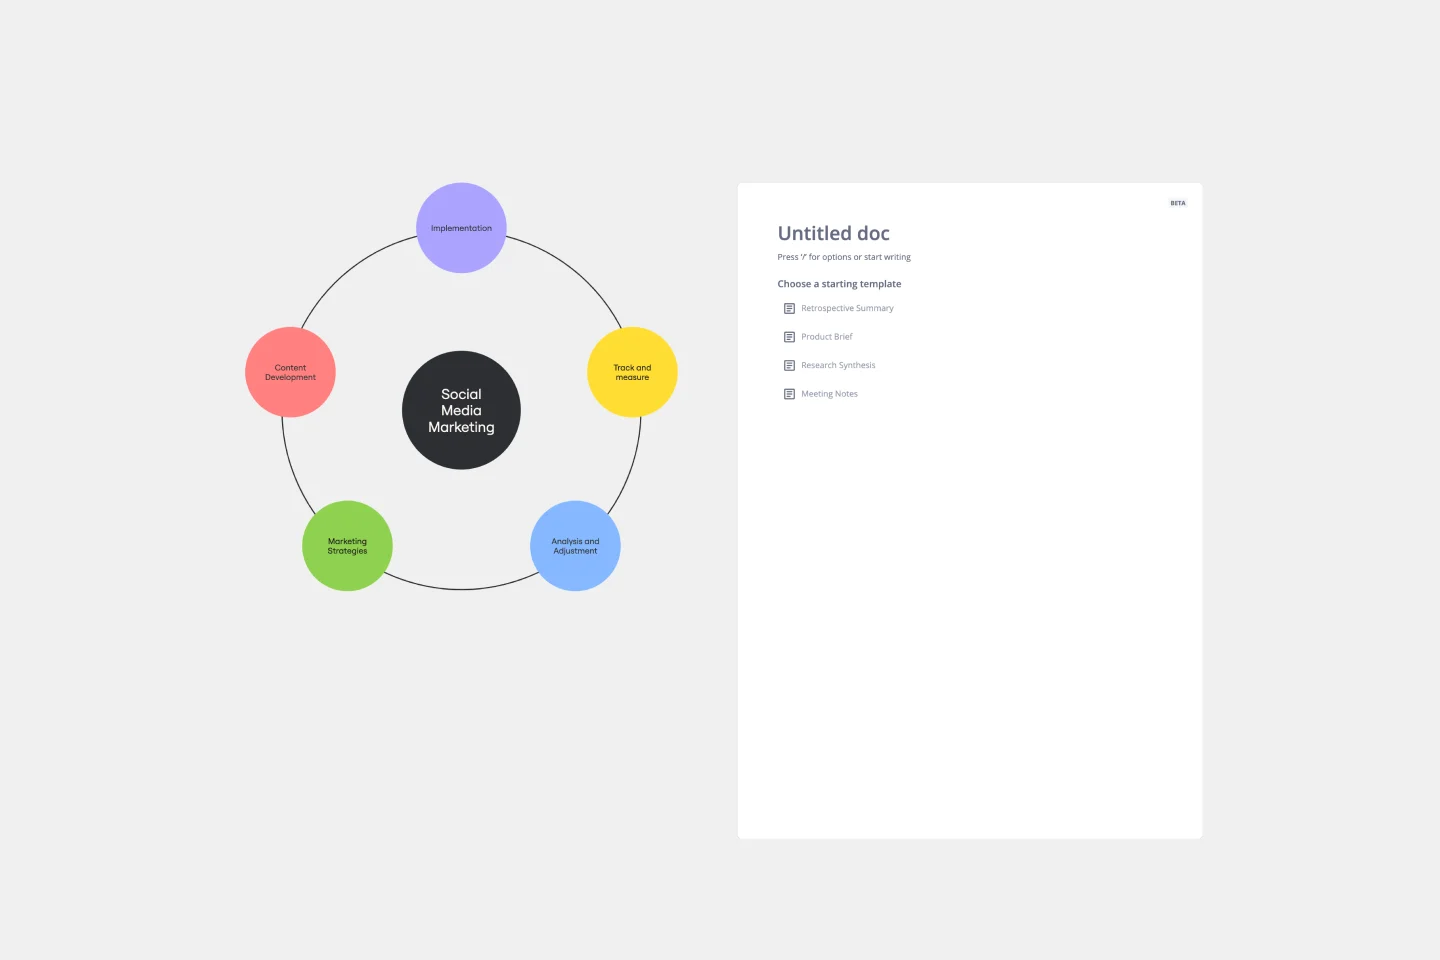
Cycle Diagram Template
Works best for:
Diagramming
The cycle diagram template empowers professionals to visually represent complex cycles with precision and clarity. This template maps out cyclical processes, relationships, or events, ensuring that complex concepts are communicated seamlessly. One key benefit that sets this template apart is its ability to streamline communication and enhance understanding. By crafting visually appealing cycle diagrams, professionals can distill complex information into a clear visual language, making it easier for teams and stakeholders to grasp complex relationships. This ultimately fosters more effective collaboration and decision-making.
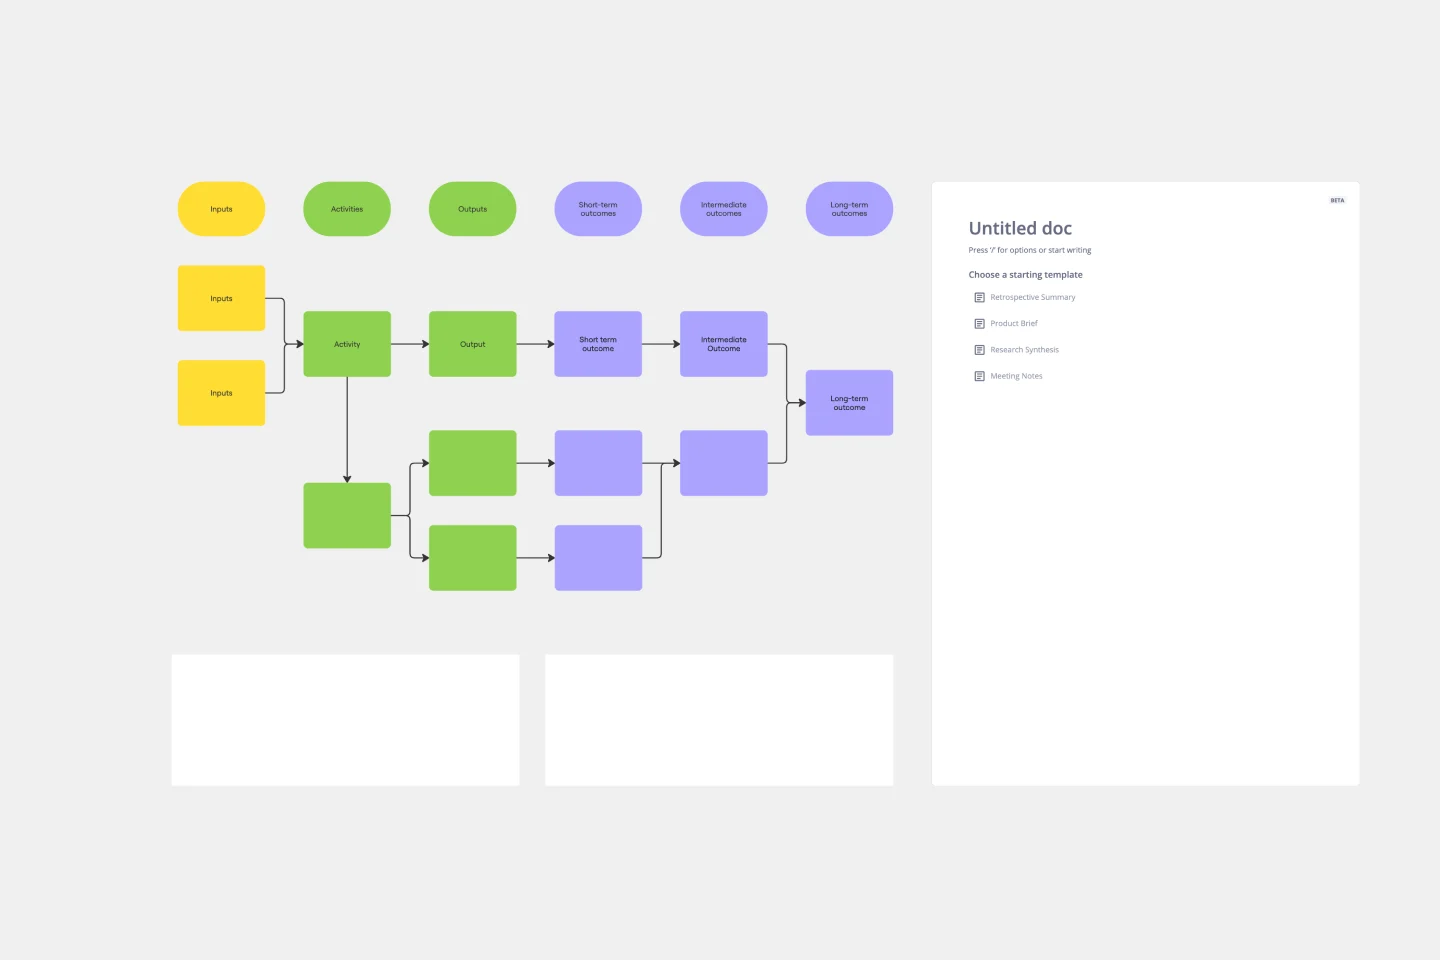
Logic Model Template
Works best for:
Diagramming
The logic model template is a strategic visual tool designed to delineate the relationship between a program's inputs, activities, outputs, and outcomes. By providing a clear and comprehensive map of the project lifecycle, stakeholders can swiftly grasp the intricate connections within a given initiative. One standout benefit of this template is its ability to enhance clarity: by visually representing the transformation of resources into anticipated results, teams can ensure more efficient and targeted use of their resources, thus maximizing the potential for success in their endeavors.
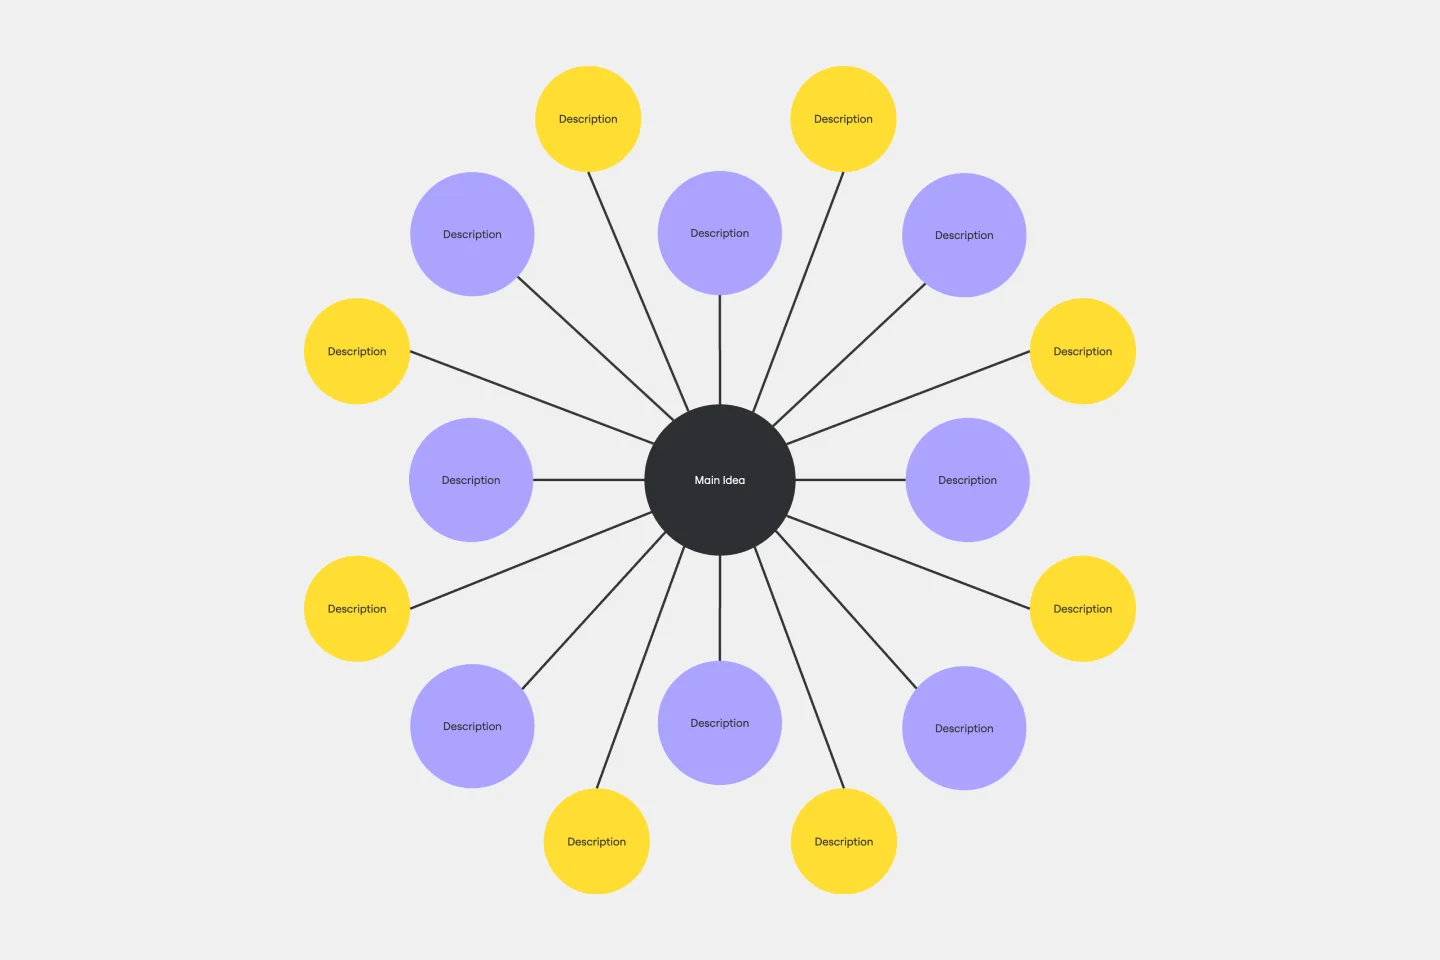
Bubble Map Template
Works best for:
Diagramming, Mapping, Brainstorming
A Bubble Map Template is a visual organization tool that uses bubbles or circles to represent various ideas or data points. These bubbles are linked together, displaying their relationships and creating a network of interconnected thoughts. Use a Bubble Map Template to streamline complex information, enhancing comprehension and promoting efficient decision-making.
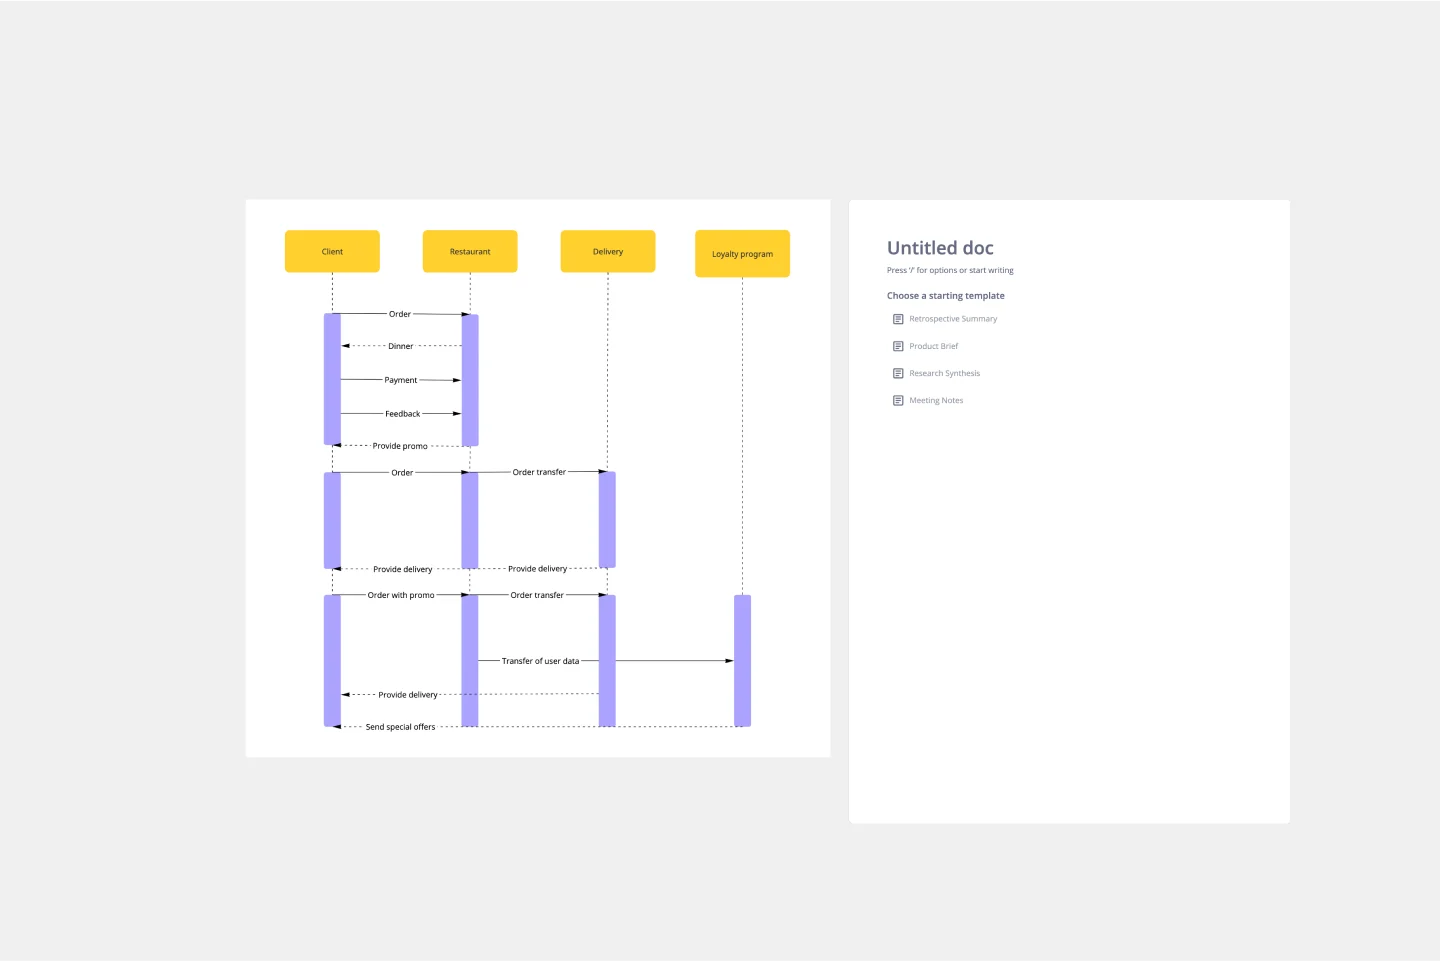
UML Sequence Diagram Template
Works best for:
Software Development, Mapping, Diagrams
Analyze and showcase how external entities interact with your system using a sequence diagram. Get a bird’s-eye view of your work processes, business functions, and customer interactions using this diagram. Also, identify any potential problems early and solve them before implementation.
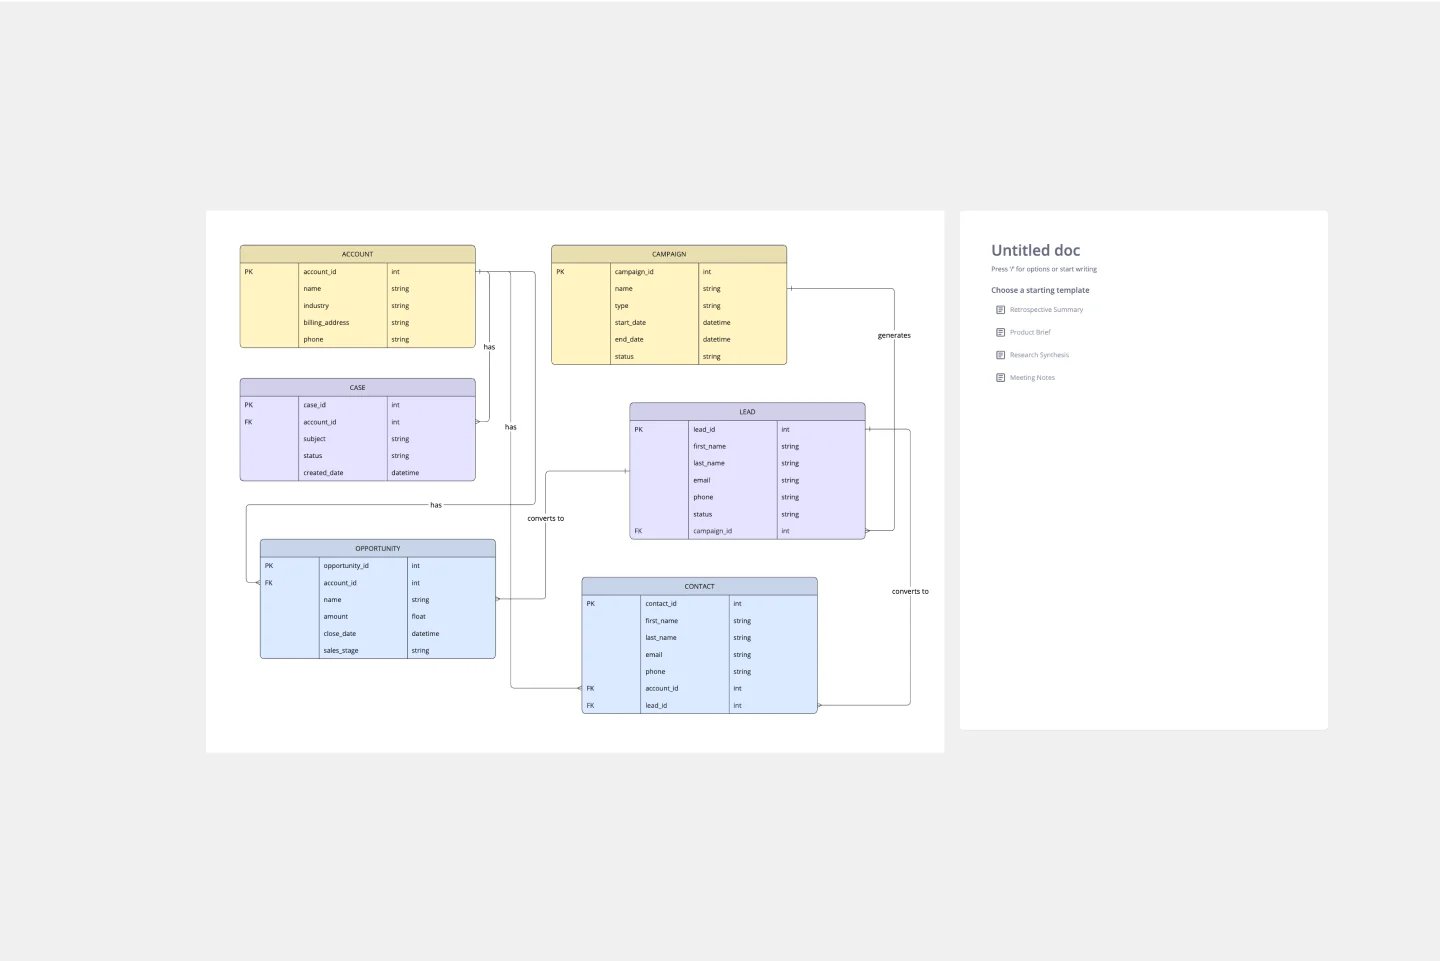
ERD Customer Relationship Management (CRM) Template
Works best for:
ERD, CRM
The ERD Customer Relationship Management (CRM) template streamlines and enhances the management of customer relationships within businesses. It focuses on organizing customer information and interactions in a visually intuitive manner. Key entities such as Customer, Interaction, Sales Opportunity, Product, and Support Ticket are central to the template, facilitating the tracking of customer relationships, sales funnel activities, product purchases, and customer service interactions. This structured approach is critical for boosting customer satisfaction and optimizing sales strategies, making the ERD CRM template an invaluable asset for businesses aiming to improve their CRM processes.