About the Phylogenetic Tree Template
The phylogenetic tree template is an innovative tool for visualizing the evolutionary relationships between species. It is a visual representation of the history of the evolution of life on Earth, and it helps scientists and researchers to identify the relationships between different organisms and their ancestors. This template is a great way to organize complex data and make it more understandable to everyone.
In Miro, the phylogenetic tree template is designed to be simple and easy to use, consisting of different areas representing various aspects of organisms' evolutionary history. These areas include different branches, connector lines, and nodes.
How to use the phylogenetic tree template in Miro
Using the phylogenetic tree template in Miro is very easy. Here are the steps:
Start by adding your data to the template, anything from taxonomic names to DNA sequences.
Use the automated diagramming features to expand the template with more branches and connector lines.
Add any artifact to the Miro board to give more context to your data.
Why should you use the phylogenetic tree?
The phylogenetic tree template offers many benefits to researchers and scientists in biology. Here are some of its key advantages:
Visualizes complex data clearly and concisely, making it easier to comprehend.
It provides an efficient way to organize data and information, enabling easy access and analysis.
It helps identify the relationships between different organisms and their ancestors, leading to important discoveries and insights.
Useful for teaching and learning, providing a visual representation of complex topics and concepts.
Allows for collaboration between researchers and scientists, facilitating the sharing and analysis of data and leading to breakthroughs in the field of biology.
Overall, the phylogenetic tree template is a highly effective tool that has proven invaluable in studying evolutionary biology. Explore all features of Miro's phylogenetic tree maker and start diagramming right now.
Phylogenetic Tree Template FAQs
Can I personalize the template according to my requirements?
Yes, the template is fully customizable, and you can easily change it with just a few clicks.
Can I expand the template with more branches and connector lines to accommodate my data?
Yes, you can increase the template size with automated diagramming features that allow you to add more branches and connector lines.
Can I add artifacts to the Miro board to provide more context?
Yes, you can add any artifacts to the Miro board to give more context to your data. Simply drag and drop files onto your board.

Miro
Your virtual workspace for innovation
Miro is an innovation workspace designed for teams of every size, everywhere, to dream, design, and build the future together. Our mission? To empower these teams to create the next big thing, powered by AI at every step of the way. Over 90 million users around the world rely on Miro to untangle complex ideas, put customer needs first, and deliver products and services faster. All supported by best-in-class security, compliance, and scalability.
Categories
Similar templates
Opportunity Solution Tree Template
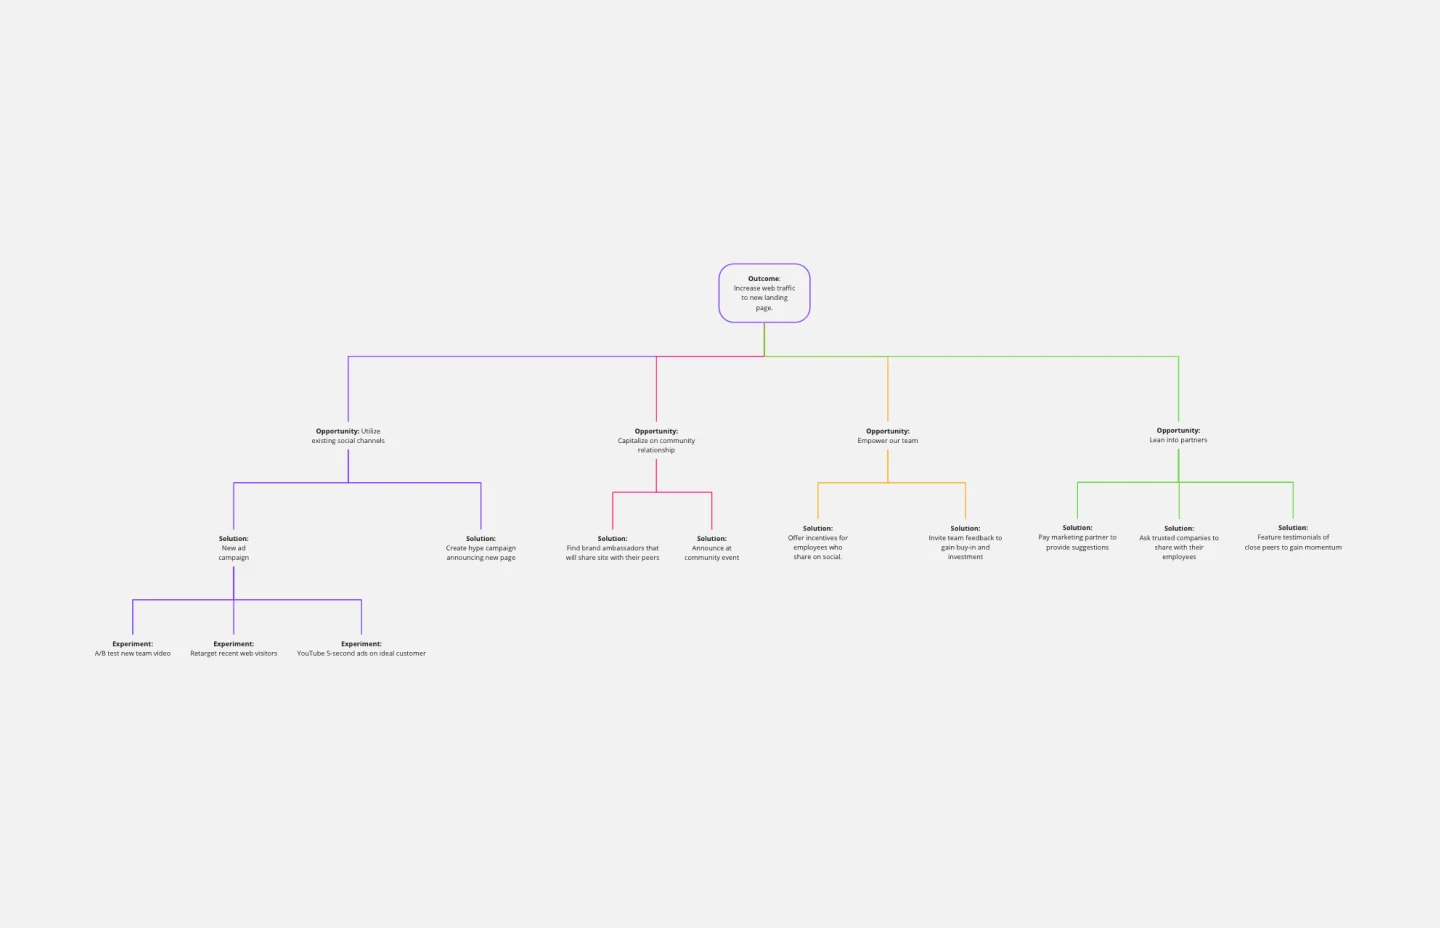
Opportunity Solution Tree Template
Solving problems — successful companies and productive teams just know how to do it. They’re able to identify many possible solutions, then settle on the one that leads to the desired outcome. That’s the power an Opportunity Solution Tree gives you. Designed by Teresa Torres, a product discovery coach, this mind map breaks down your desired outcome into opportunities for the product to meet user needs, then gives your team an effective way to brainstorm potential solutions.
Prune the Product Tree Template
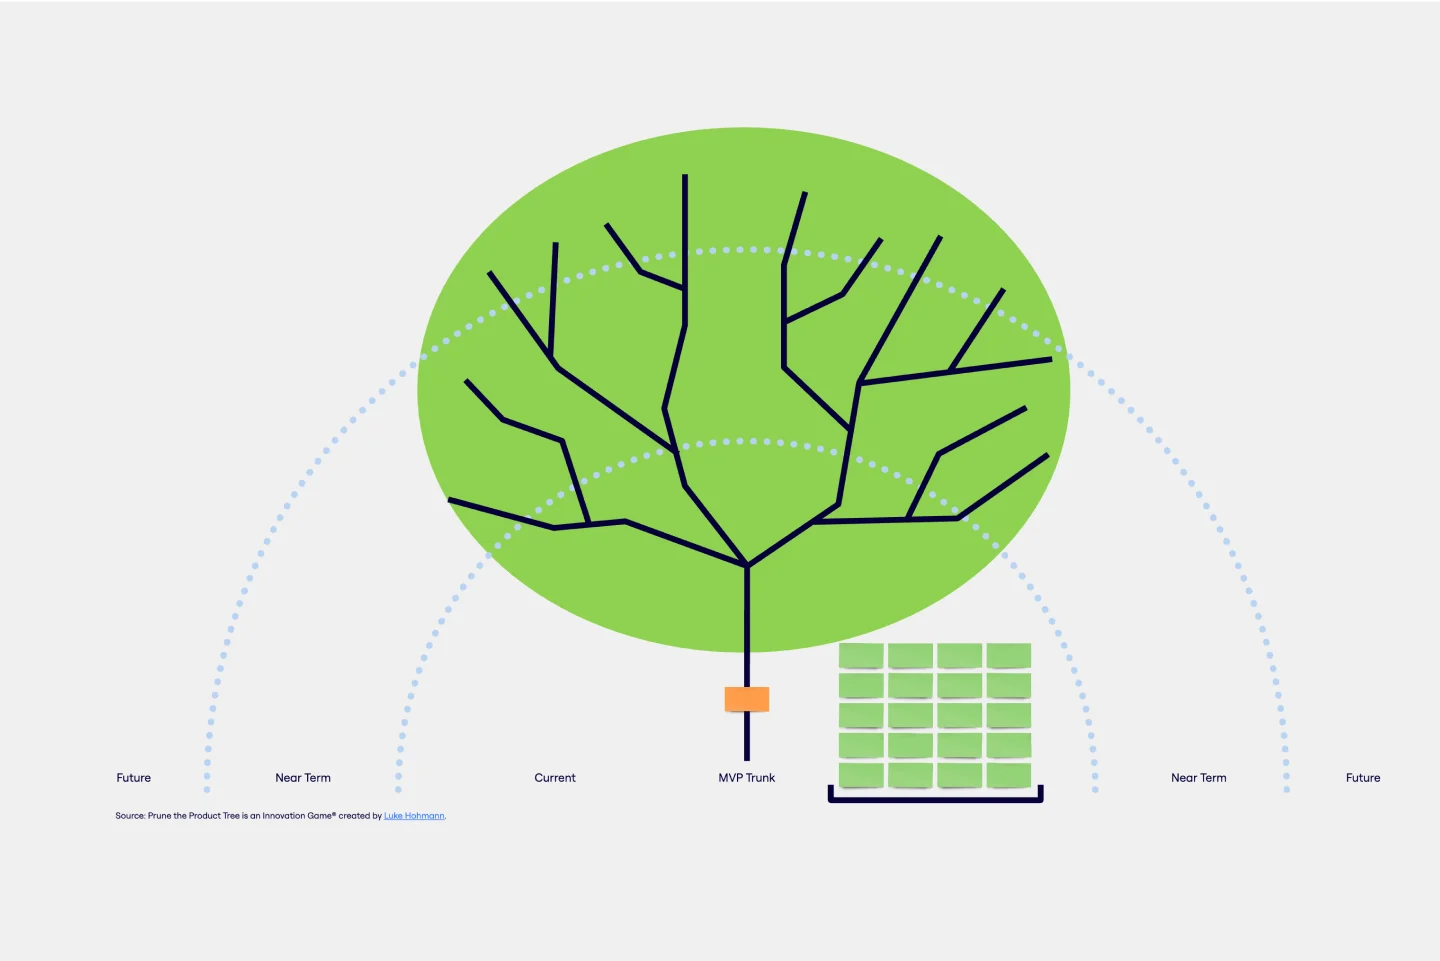
Prune the Product Tree Template
Prune the Product Tree (also known as the product tree game or the product tree prioritization framework) is a visual tool that helps product managers organize and prioritize product feature requests. The tree represents a product roadmap and helps your team think about how to grow and shape your product or service by gamifying feedback-gathering from customers and stakeholders. A typical product tree has four symbolic features: the trunk, which represents the existing product features your team is building; the branches, each of which represents a product or system function; roots, which are technical requirements or infrastructure; and leaves, which are new ideas for product features.
Family Tree Template
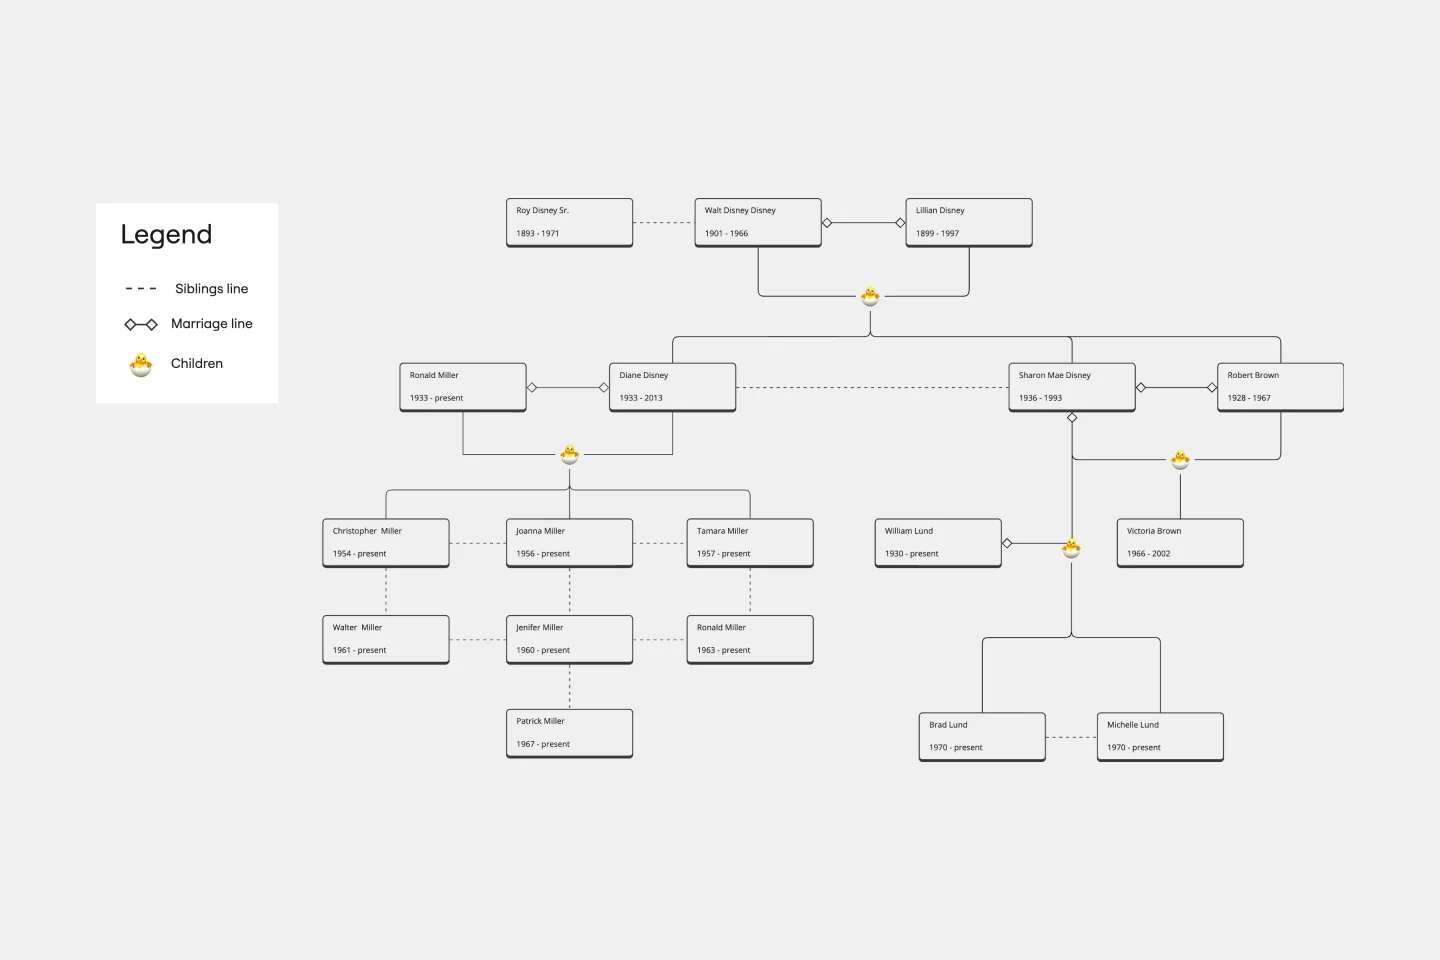
Family Tree Template
Family trees help you make sense of complicated family relationships, even generations back. With this Family Tree Template, you can quickly and easily add your siblings, parents, and extended family members. Plus, add extra information, notes, and even images to create a vibrant family tree.
Bracket Template
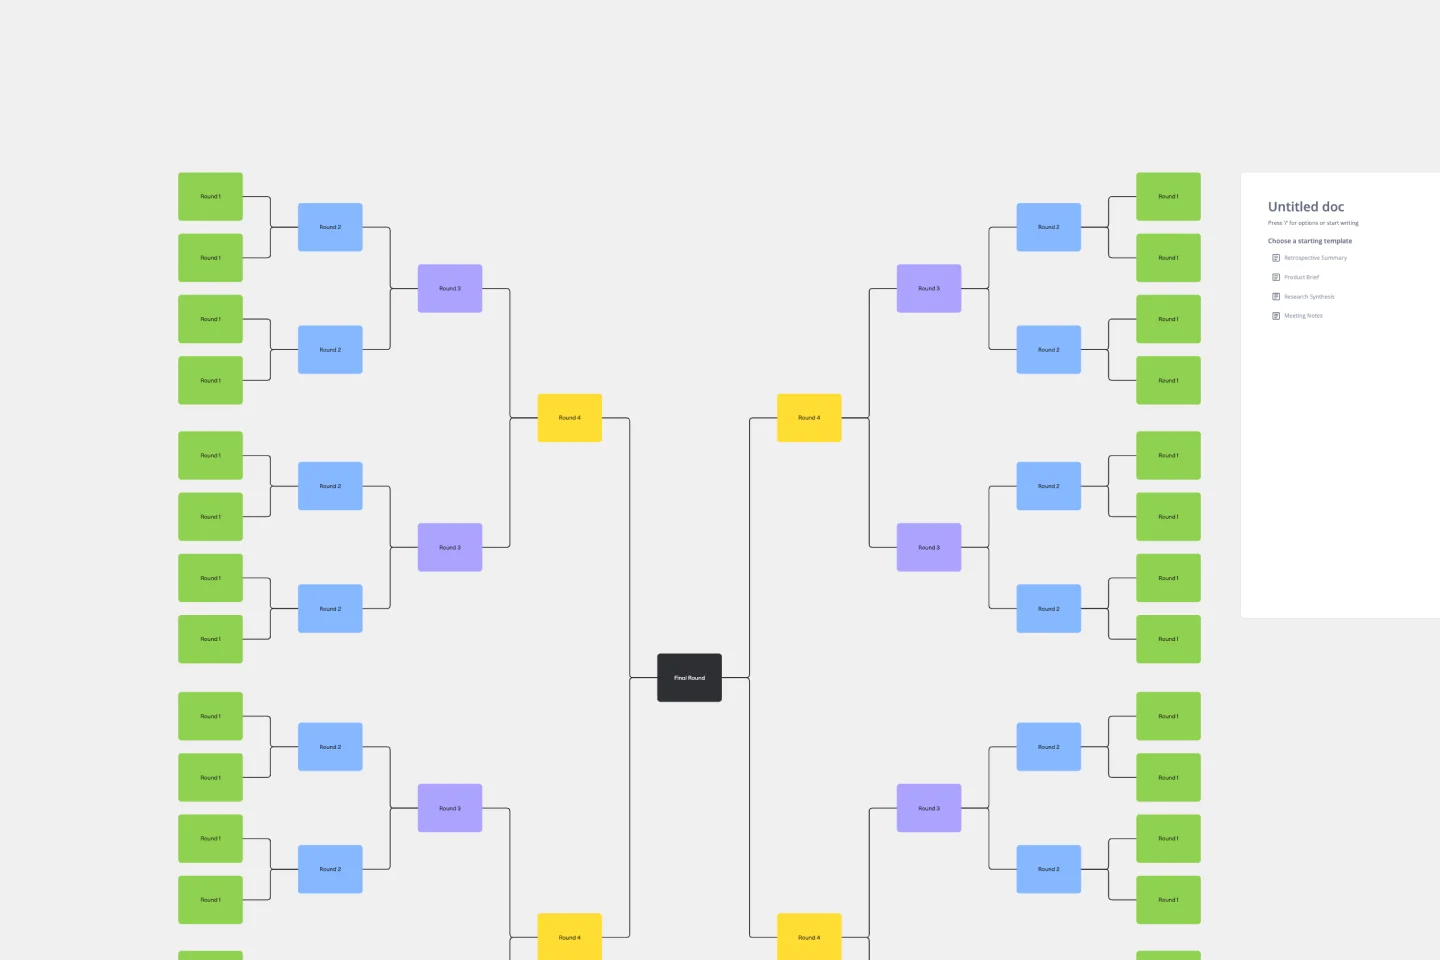
Bracket Template
The Bracket Template is a dynamic visualization tool that helps to organize and rank ideas, entities, or teams in a sequential and competitive manner. It is structured like a tree, starting with multiple entries on either side, which then face off in successive rounds, leading to a single winner or conclusion. One of its standout benefits is its ability to simplify complex decision-making processes. Breaking down choices into smaller, head-to-head comparisons, makes the path to a final decision clearer, ensuring clarity and fostering engagement among participants. Moreover, the Bracket Template is particularly useful when there are multiple options to consider and when there is a need to compare and contrast those options. It is an effective way to streamline decision-making, making it easier and more efficient.
Fault Tree Analysis Template
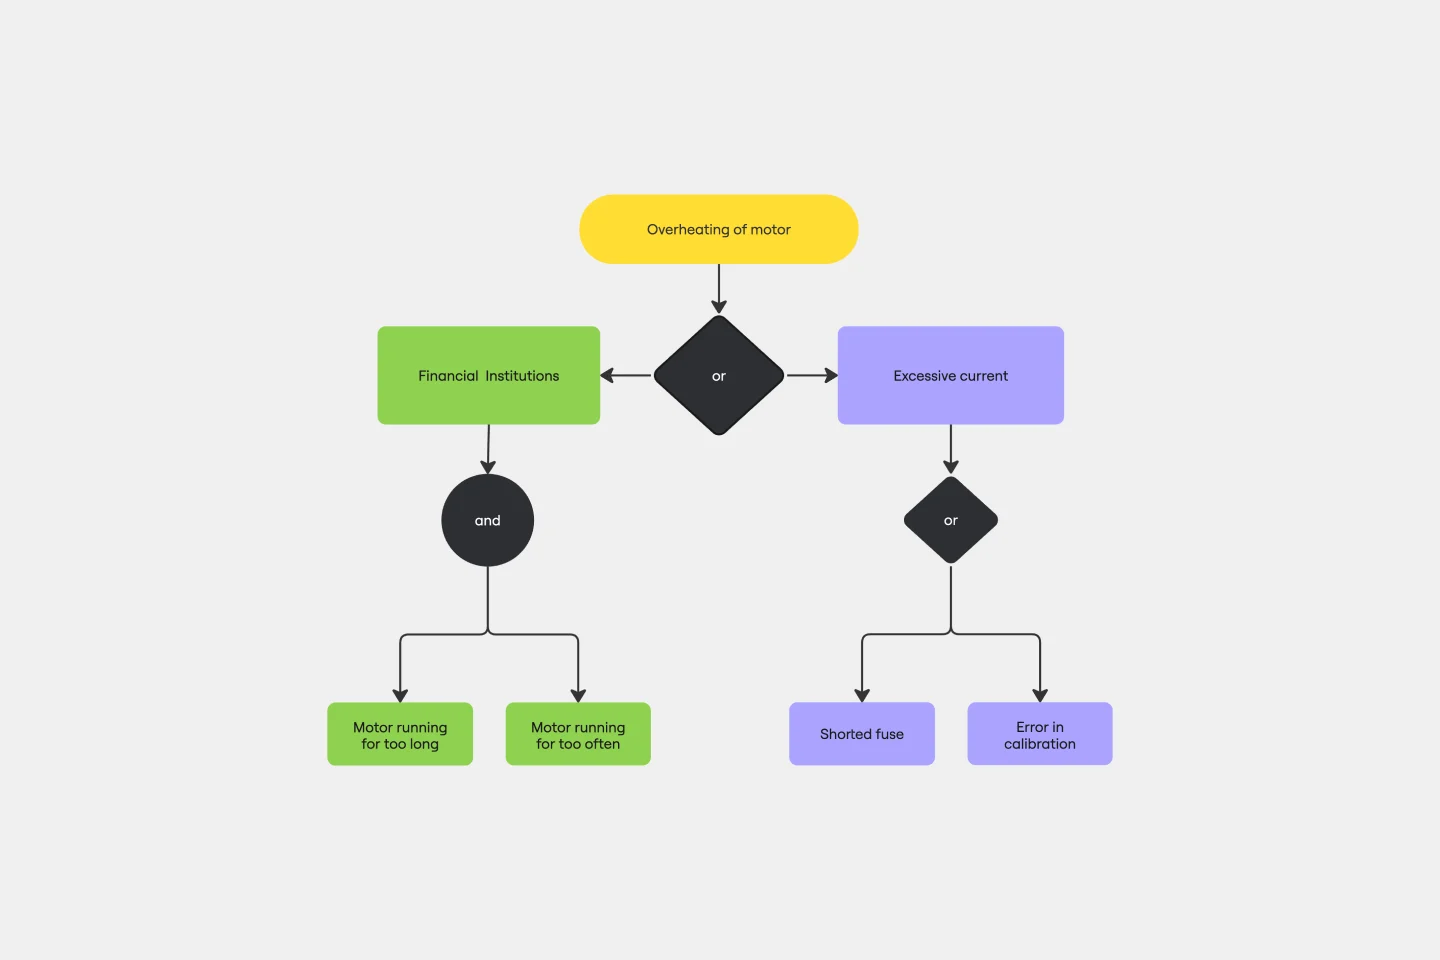
Fault Tree Analysis Template
The Fault Tree Analysis Template visually breaks down potential system malfunctions, highlighting complex causal relationships between faults. One of its standout benefits is its ability to enhance clarity in complex scenarios, allowing professionals to swiftly pinpoint root causes and prioritize interventions, ensuring a more streamlined approach to problem-solving.
Opportunity Solution Tree Template
Opportunity Solution Tree Template
Solving problems — successful companies and productive teams just know how to do it. They’re able to identify many possible solutions, then settle on the one that leads to the desired outcome. That’s the power an Opportunity Solution Tree gives you. Designed by Teresa Torres, a product discovery coach, this mind map breaks down your desired outcome into opportunities for the product to meet user needs, then gives your team an effective way to brainstorm potential solutions.
Prune the Product Tree Template
Prune the Product Tree Template
Prune the Product Tree (also known as the product tree game or the product tree prioritization framework) is a visual tool that helps product managers organize and prioritize product feature requests. The tree represents a product roadmap and helps your team think about how to grow and shape your product or service by gamifying feedback-gathering from customers and stakeholders. A typical product tree has four symbolic features: the trunk, which represents the existing product features your team is building; the branches, each of which represents a product or system function; roots, which are technical requirements or infrastructure; and leaves, which are new ideas for product features.
Family Tree Template
Family Tree Template
Family trees help you make sense of complicated family relationships, even generations back. With this Family Tree Template, you can quickly and easily add your siblings, parents, and extended family members. Plus, add extra information, notes, and even images to create a vibrant family tree.
Bracket Template
Bracket Template
The Bracket Template is a dynamic visualization tool that helps to organize and rank ideas, entities, or teams in a sequential and competitive manner. It is structured like a tree, starting with multiple entries on either side, which then face off in successive rounds, leading to a single winner or conclusion. One of its standout benefits is its ability to simplify complex decision-making processes. Breaking down choices into smaller, head-to-head comparisons, makes the path to a final decision clearer, ensuring clarity and fostering engagement among participants. Moreover, the Bracket Template is particularly useful when there are multiple options to consider and when there is a need to compare and contrast those options. It is an effective way to streamline decision-making, making it easier and more efficient.
Fault Tree Analysis Template
Fault Tree Analysis Template
The Fault Tree Analysis Template visually breaks down potential system malfunctions, highlighting complex causal relationships between faults. One of its standout benefits is its ability to enhance clarity in complex scenarios, allowing professionals to swiftly pinpoint root causes and prioritize interventions, ensuring a more streamlined approach to problem-solving.