About the Pedigree Diagram Template
You can identify how traits and diseases are passed from one generation to the next using the pedigree diagram template. Pedigree Diagrams are useful for doctors, veterinarians, farmers, and anyone else working with genes or interested in genetics.
What is a pedigree diagram?
A pedigree diagram is an advanced version of a family tree, that is commonly used to diagram relationships within family members. It shows how genetic traits and diseases are passed from one generation to the next.
You can use a pedigree diagram to see which family members carry a certain trait, like a widow’s peak. Doctors use them to see how diseases are passed from parents to children. Farmers use it in husbandry to track traits in crops and animals.
In a pedigree diagram, males are represented by squares; females by circles. Shaded symbols mean someone has a specific trait (e.g., dimples). Unshaded symbols mean an individual doesn’t have a specific trait.
Benefits of pedigree diagrams
Pedigree diagrams can help doctors identify and diagnose diseases.
For example, let’s say someone has a family history of heart disease. A pedigree diagram will tell us whether this individual is likely to have a heart condition. This can help doctors diagnose and treat patients faster, then provide better healthcare.
In science, pedigree diagrams can help understand how traits are inherited.
For example, dimples may pass from father to son in one family, and from mother to daughter in another. Blonde hair might pass from grandparents to grandchildren, but not from parents to children. Pedigree diagrams make patterns like these easy to identify.
Create your own pedigree diagram
Miro’s is the perfect starting point for a pedigree diagram. Get started by opening the template on this page and following the steps below.
Step 1:
Add individuals to your pedigree diagram. Go with as many as you can — or as many as are relevant. Place older generations at the top and younger ones below them.
Males are represented by squares. Females are represented by circles.
You can always use Miro to change symbols around later, so if you make a mistake, don’t worry. Just try to be as thorough as possible.
Step 2:
Connect individuals using lines of marriage and descent. A straight horizontal line represents the marriage between two individuals.
Descent is represented by diagonal and vertical lines that connect a couple from an older generation to a younger individual.
Step 3:
Add dates. This isn’t strictly necessary, but it can help keep track of individuals across generations.
Add dates of birth, death, and/or marriage lines to your pedigree diagram template.
Step 4:
Use symbols to show which family members have or don’t have a specific trait.
For example, let’s say your pedigree diagram shows widow’s peaks. Family members who don’t have a widow’s peak will be represented by unshaded symbols. Family members who do have a widow’s peak will be represented by a shaded symbol.
Once you’re ready to collaborate and receive feedback, use Miro to share your Pedigree diagrams. You may want to also create a family tree to share other details of your family.
Example of pedigree diagram
Let’s imagine the Smith family has a long history of diabetes. But, some members of the family develop the condition, while others don’t.
We can use a pedigree diagram to see the pattern of inheritance, i.e., how the disease is passed from parent to child.
This can help us predict whether a given Smith family member has diabetes or will develop it in the future.
FAQ about the Pedigree Diagram
How do you draw a Pedigree Diagram?
Open our Pedigree Diagram template. Map out a family tree using lines to show familial relationships. Once you’re done, identify individual genetic traits using Pedigree Diagram shapes and shading.
What do the symbols in a Pedigree Diagram mean?
A square represents a male; a circle indicates a female. Shaded shapes mean someone has a genetic trait. Unshaded shapes mean an individual doesn’t have a trait. A half-shaded shape means that someone carries a genetic trait without it being visible.
What is the purpose of a Pedigree Diagram?
A Pedigree Diagram is a family tree that shows how genes are passed from generation to generation. It can help us predict the likelihood of a child having a disease or trait, e.g., dimples or diabetes. It can also help us see how traits are passed from parents to children.
Is a circle male or female in Pedigree Diagrams?
In Pedigree Diagrams, a circle is always female. This is universal for all organisms, including trees and flowers. Males are represented by squares.
What do dark circles mean on a Pedigree Diagram?
A dark circle represents a female that has a visible genetic trait. For example, a woman who has her father’s blonde hair or her mother’s dimples might be represented by a dark circle.

Miro
Your virtual workspace for innovation
Miro is an innovation workspace designed for teams of every size, everywhere, to dream, design, and build the future together. Our mission? To empower these teams to create the next big thing, powered by AI at every step of the way. Over 90 million users around the world rely on Miro to untangle complex ideas, put customer needs first, and deliver products and services faster. All supported by best-in-class security, compliance, and scalability.
Categories
Similar templates
Affinity Diagram Template
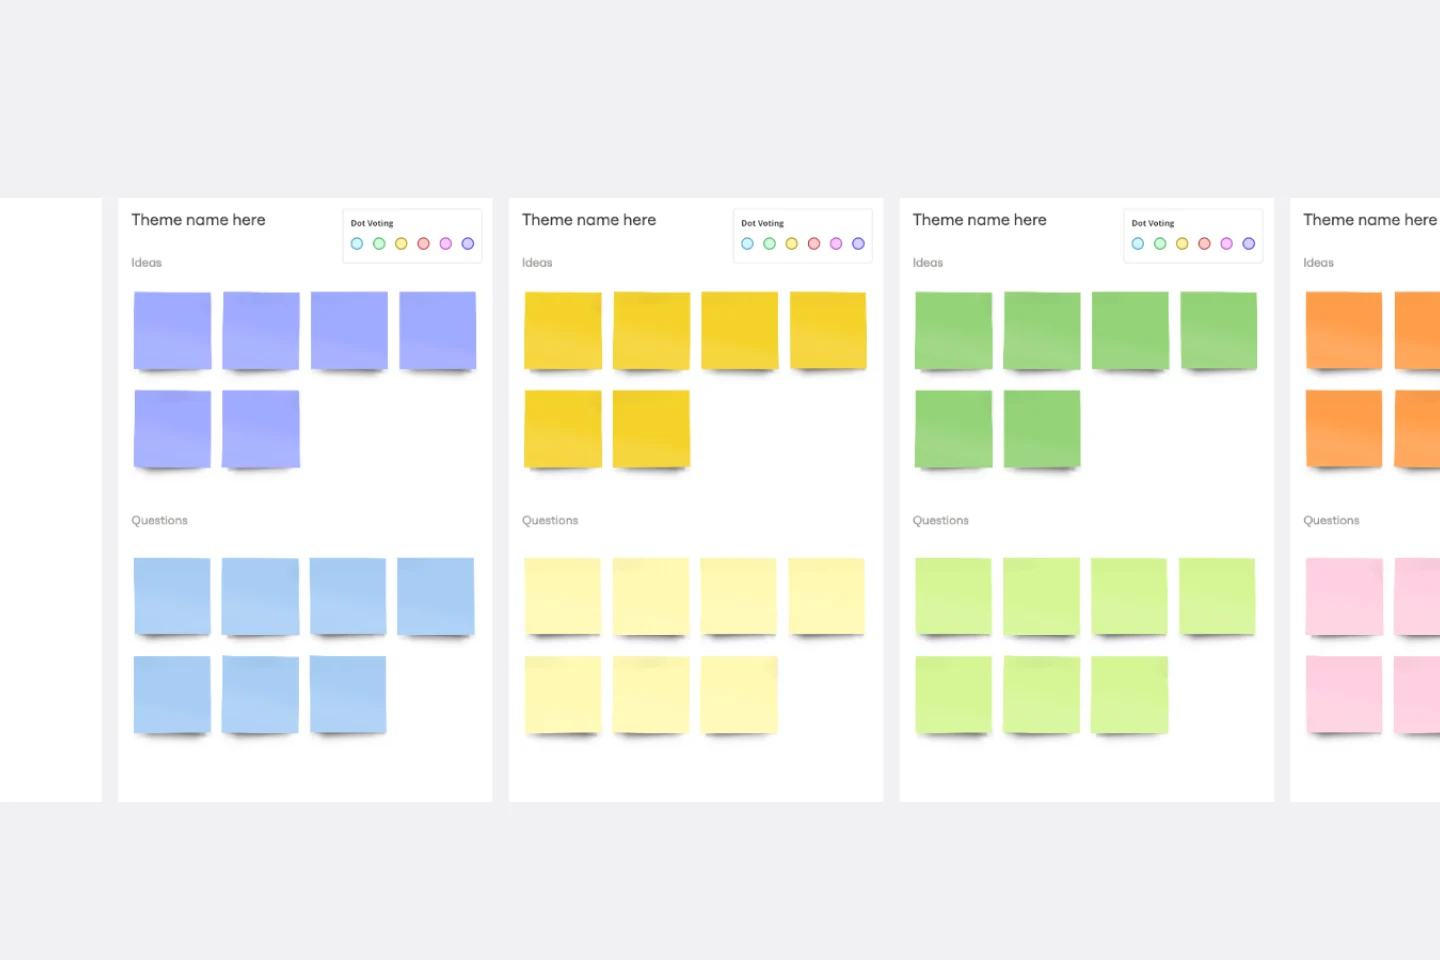
Affinity Diagram Template
You can use an affinity diagram to generate, organize, and consolidate information that comes out of a brainstorming session. Whether you’re building a product, working through a complex problem, establishing a process, or piecing apart an issue, an affinity diagram is a useful and simple framework that gives each team member the opportunity to pitch in and share their thoughts. But it’s not just ideal for brainstorms—this is a great template and tool when you need to reach consensus or analyze data such as survey results.
BPMN Template
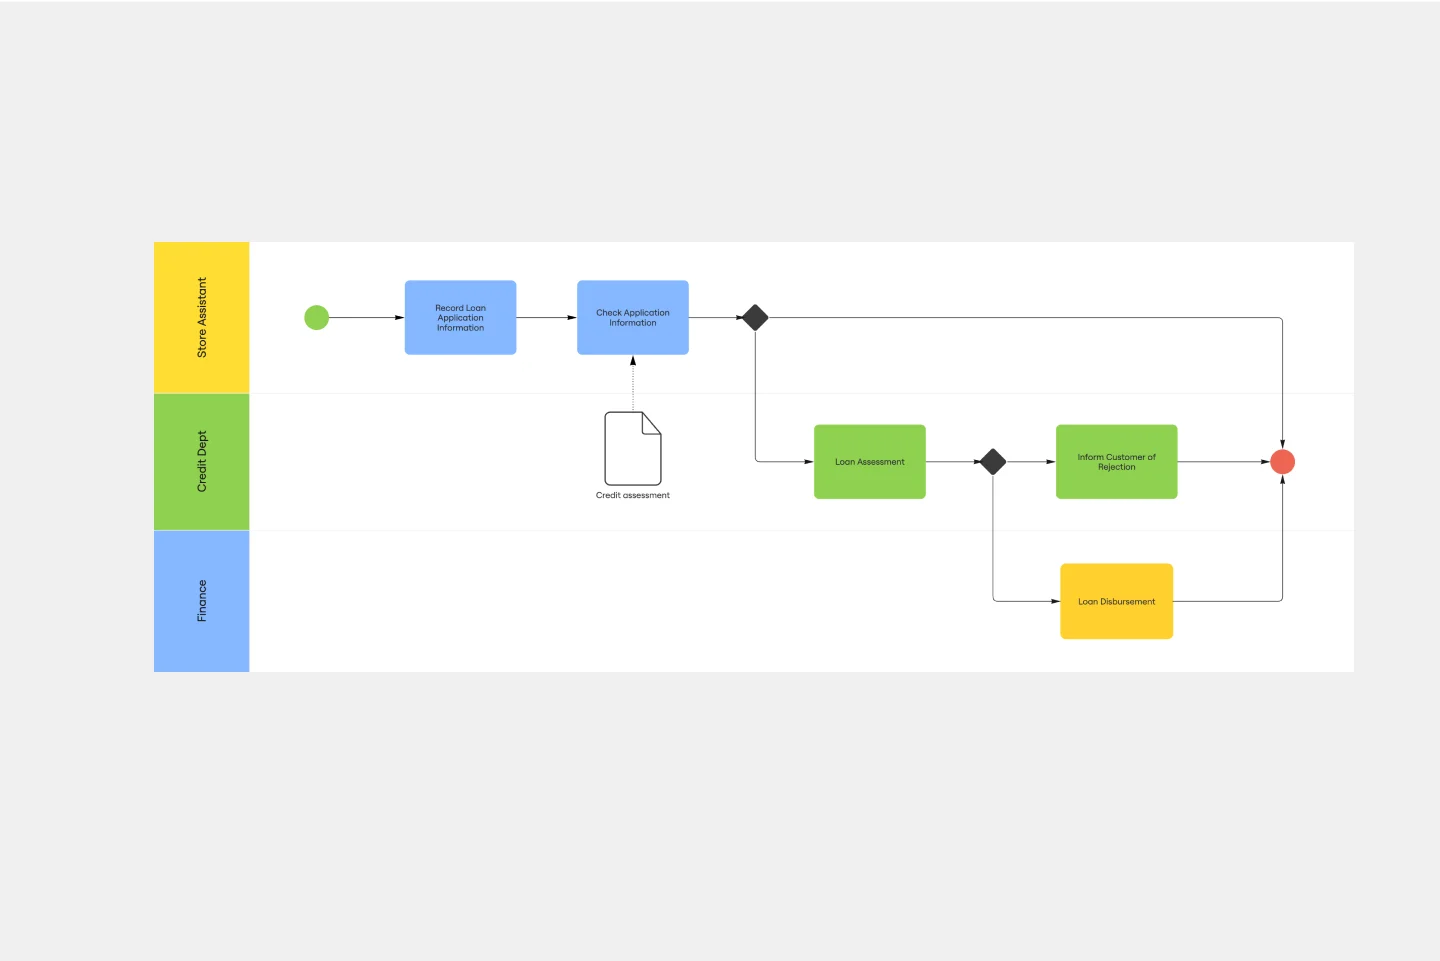
BPMN Template
The BPMN template helps you track and get an overview of your business processes. It’s a great way to identify any bottlenecks and make your operations more efficient. The BPMN methodology became a universal language when managing business processes, and multiple industries use it as a management tool. Project managers, business analysts, and IT administrators use the BPMN process flow diagram to manage projects, visually communicate the process flows, and keep track of process constraints. Try it for yourself and see improvements in your organization’s agility.
Bull's Eye Diagram Template
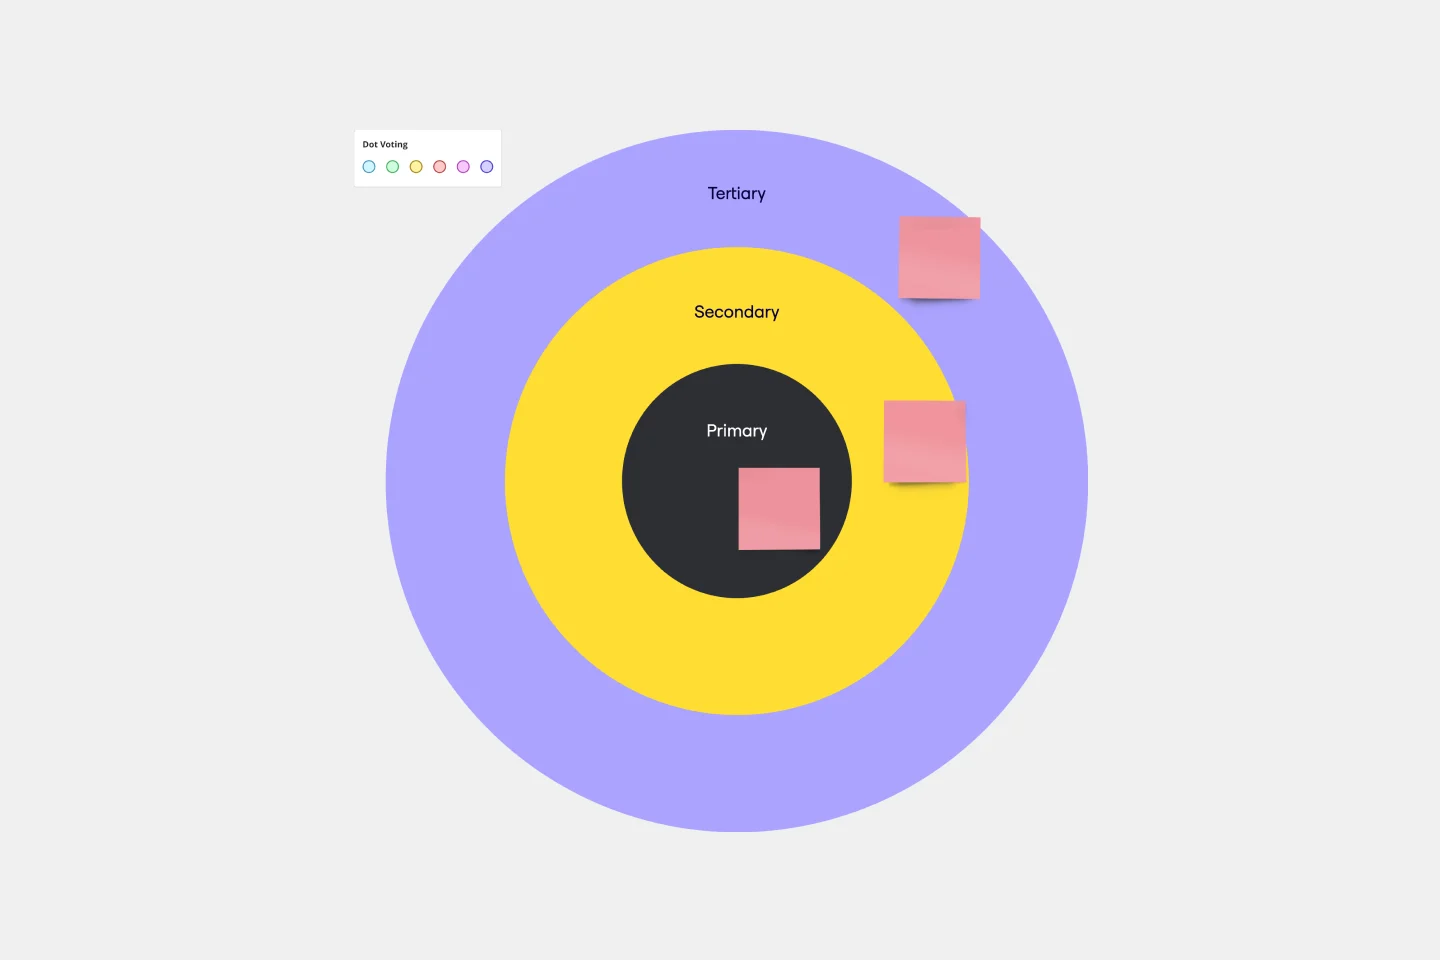
Bull's Eye Diagram Template
When you’re a growing organization, every decision can feel like it has make-or-break consequences—which can lead to decision paralysis, an inability to prioritize, inefficient meetings, and even low morale. If that sounds like you, put a Bull’s Eye Diagram to work. True to its name, a Bull’s Eye Diagram uses a model of concentric circles to help companies establish priorities, make critical decisions, or discuss how to remove or overcome obstacles.
Affinity Diagram Template
Affinity Diagram Template
You can use an affinity diagram to generate, organize, and consolidate information that comes out of a brainstorming session. Whether you’re building a product, working through a complex problem, establishing a process, or piecing apart an issue, an affinity diagram is a useful and simple framework that gives each team member the opportunity to pitch in and share their thoughts. But it’s not just ideal for brainstorms—this is a great template and tool when you need to reach consensus or analyze data such as survey results.
BPMN Template
BPMN Template
The BPMN template helps you track and get an overview of your business processes. It’s a great way to identify any bottlenecks and make your operations more efficient. The BPMN methodology became a universal language when managing business processes, and multiple industries use it as a management tool. Project managers, business analysts, and IT administrators use the BPMN process flow diagram to manage projects, visually communicate the process flows, and keep track of process constraints. Try it for yourself and see improvements in your organization’s agility.
Bull's Eye Diagram Template
Bull's Eye Diagram Template
When you’re a growing organization, every decision can feel like it has make-or-break consequences—which can lead to decision paralysis, an inability to prioritize, inefficient meetings, and even low morale. If that sounds like you, put a Bull’s Eye Diagram to work. True to its name, a Bull’s Eye Diagram uses a model of concentric circles to help companies establish priorities, make critical decisions, or discuss how to remove or overcome obstacles.