About the Opportunity Solution Tree template
The Opportunity Solution Tree template helps product teams to improve the way they solve problems and reach their desired outcomes. Designed by Teresa Torres, a product discovery coach, this tree aims to methodically move teams through the steps needed to reach a final solution. Teresa Torres's opportunity solution tree breaks down a desired outcome into opportunities for the product to meet user needs and then suggests potential solutions to meet these needs.
Why use an opportunity solution tree?
Product teams may find this template useful if they are able to produce a lot of ideas, but can’t prioritize which ideas are actually of quality. An opportunity solution tree is a tool that product teams can use to assess if they are considering all potential solutions to reach their desired end. It then provides clear solutions at the end of the exercise that can be compared and contrasted for most value.
What is an opportunity in the opportunity solution tree?
Brainstorms tend to lead to a lot of solutions off the bat without any clear logic to whether the solution is a valuable one. Opportunities are a way for product teams to add in the layer of customer needs in order to better connect solutions to what will really help a user. By adding in the step of identifying opportunities, the ideas your team generates will be based on identified needs rather than an arbitrary solution.
What is product discovery?
Product discovery is a framework to help teams create useful, usable products that don’t overlook true user need. Using the Opportunity Solution Tree template is one way to start improving your product discovery.
How do I build an Opportunity Solution Tree?
Creating an opportunity solution tree is easy with Miro's tree diagram maker or ready-made template. Simply follow these steps.
Step 1: Define your outcome or measurable result
Simply put, what does success look like? If you use OKRs, then you can use one of your Key Results to answer this question. If you don’t, then you’ll need to pick a metric that you’d like to improve. Of course, many teams are striving to achieve many goals each quarter, but it helps to create a separate tree for each goal.
It’s important for your team to agree on this goal before you proceed to the next step. If you’re misaligned from the beginning, then it’s going to be harder to build the rest of the tree.
Step 2: Identify possible opportunities
For goal-oriented people, the temptation to jump from “problem” to “solution” is sizable. But resist that temptation. Instead, it’s time to pause and do some research.
Building an Opportunity Solution Tree is all about identifying key opportunities in your market. That means learning: about customers, about what they need, about the problems that they are trying to solve. Focus on answering these questions before you fill out this portion of the tree.
Armed with insights about your customers, you can begin to find opportunities. Use your research to fill out this second branch of the tree. Don’t be fooled: although this branch isn’t about your solutions, it’s still vitally important. Each branch of the tree builds on the previous, so if your research isn’t robust, your opportunities and solutions won’t be robust either.
Step 3: Generate solutions
Now it’s time to think of solutions. This is where the Opportunity Solution Tree template really comes to life for your team. When you go around the room to share ideas during a meeting, myriad dynamics are in play. People might be more or less likely to share based on their rank, role, or who’s in the room. The Opportunity Solutions Tree is an unbiased, agreed-upon source of truth that everyone can own and contribute to.
Invite cross-functional partners to contribute to this part of the tree. Let the ideas flow! However, be wary of including anything that doesn’t fit in the tree. It’s important to stay focused so you don’t end up with more ideas than resources. Write down those extraneous ideas and save them for later. If your team gets lost or stuck, return to the tree to ground you.
Step 4: Iterate and experiment
Choose one solution and once you have some ideas, you can start testing them out. Build a row on the tree specifically for experiments. Start brainstorming experiments that will enable you to test the chosen solution.
FAQ about the Opportunity Solution Tree template
How do you use a solution tree?
The opportunity solution tree helps you to visualize the best path to your desired outcome. Use the solution tree to map out the possible opportunities to solve your problem and keep track of the actionable experiments that will lead to your desired outcome.

Miro
Your virtual workspace for innovation
Miro is an innovation workspace designed for teams of every size, everywhere, to dream, design, and build the future together. Our mission? To empower these teams to create the next big thing, powered by AI at every step of the way. Over 90 million users around the world rely on Miro to untangle complex ideas, put customer needs first, and deliver products and services faster. All supported by best-in-class security, compliance, and scalability.
Categories
Similar templates
Random Words Template
Random Words Template
Random word brainstorming is a simple, creative technique using random words to generate new ideas and creative solutions to your problems. Using random word prompts allows you to step beyond traditional boundaries and address challenges from a different direction. Random word brainstorming allows your team to unlock their creativity to solve business problems, create new inventions, improve existing ideas, or just think about problems in a new way.
Opportunity Canvas Template

Opportunity Canvas Template
Features and capabilities — they make or break a product, which is why companies spend so much time and effort focusing on them. Sound like you? Try it with an Opportunity Canvas. This streamlined one-pager gives you and your team the power to improve your product by exploring the use cases, potential setbacks, strategies, challenges, and metrics. An Opportunity Canvas is ideal if you’ve already built a product, because you don’t need to consider the operational or revenue model.
Mind Map Template
Mind Map Template
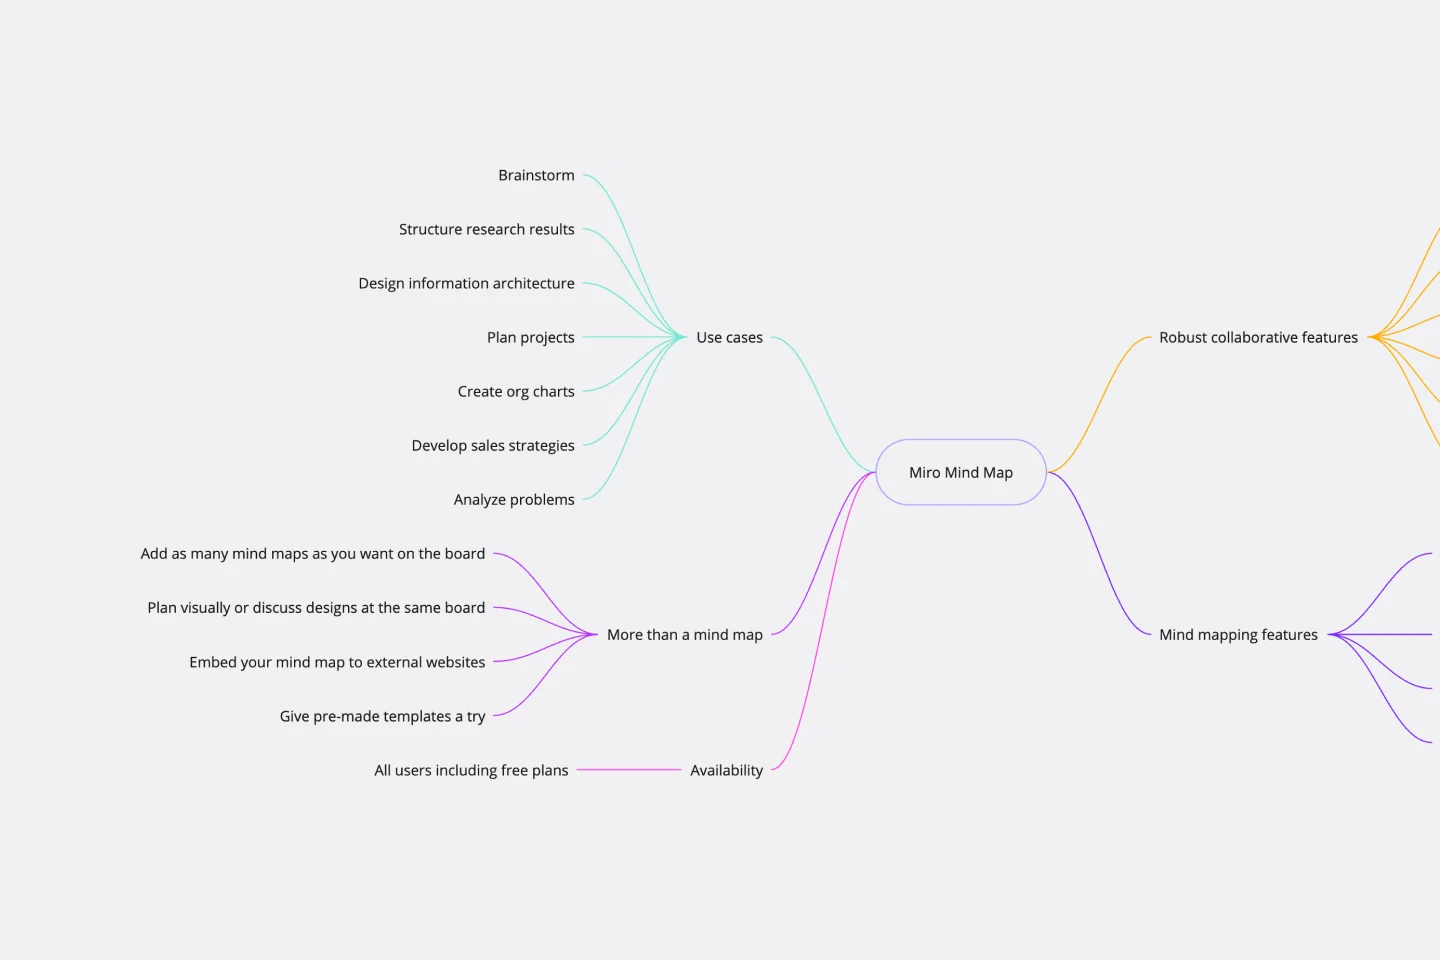
We see you, visual learners. You grasp concepts and understand data easier when they're presented in well-organized, memorable graphics. Mind mapping is perfect for you. This powerful brainstorming tool presents concepts or ideas as a tree — with the central subject as the trunk and your many ideas and subtopics as the branches. This template is a fast, effective way for you to start mind mapping, which can help you and your team become more creative, remember more, and solve problems more effectively.
Random Words Template
Random Words Template
Random word brainstorming is a simple, creative technique using random words to generate new ideas and creative solutions to your problems. Using random word prompts allows you to step beyond traditional boundaries and address challenges from a different direction. Random word brainstorming allows your team to unlock their creativity to solve business problems, create new inventions, improve existing ideas, or just think about problems in a new way.
Opportunity Canvas Template
Opportunity Canvas Template
Features and capabilities — they make or break a product, which is why companies spend so much time and effort focusing on them. Sound like you? Try it with an Opportunity Canvas. This streamlined one-pager gives you and your team the power to improve your product by exploring the use cases, potential setbacks, strategies, challenges, and metrics. An Opportunity Canvas is ideal if you’ve already built a product, because you don’t need to consider the operational or revenue model.
Mind Map Template
Mind Map Template
We see you, visual learners. You grasp concepts and understand data easier when they're presented in well-organized, memorable graphics. Mind mapping is perfect for you. This powerful brainstorming tool presents concepts or ideas as a tree — with the central subject as the trunk and your many ideas and subtopics as the branches. This template is a fast, effective way for you to start mind mapping, which can help you and your team become more creative, remember more, and solve problems more effectively.