About the OODA Loop Template
The OODA Loop template is a powerful tool to improve decision-making processes. It is inspired by the OODA Loop, a concept developed by military strategist Colonel John Boyd. The OODA Loop involves four steps that form a continuous cycle essential for quick and effective decision-making: Observe, Orient, Decide, and Act.
Let's take a closer look at each area:
Observe: Begin by gathering information and staying aware of your surroundings. This template section allows you to list key observations or data points.
Orient: Understand the context and analyze the information. In this area, you can outline the factors influencing your decision, including challenges, opportunities, and potential risks.
Decide: Make a well-informed decision based on your observations and orientation. The template provides space to document your chosen course of action and the rationale behind it.
Act: Execute your decision and implement the plan. This section helps you outline the steps to take and track progress.
How to use the OODA Loop template in Miro?
Edit with ease: Customize the template by clicking on any element to add text, shapes, or images that provide additional context.
Collaborate effortlessly: Invite team members to your board and collaborate in real time, ensuring everyone is on the same page throughout the decision-making process.
Why should you use an OODA Loop template?
Enhanced clarity: Visualizing the OODA Loop brings clarity to complex decision-making processes, making it easier to understand and communicate.
Faster decision-making: The structured approach of the OODA Loop template facilitates quicker decision-making by breaking down the process into manageable steps.
Improved collaboration: Collaborate seamlessly with team members using a shared visual representation of the decision-making cycle.
Strategic planning: The template aids in strategic planning by helping teams analyze and respond rapidly to changing situations.
Continuous improvement: Regularly revisiting and updating the OODA Loop Diagram fosters a culture of continuous improvement, ensuring your decision-making processes evolve with your team's needs.
OODA Loop Template FAQs
Can I use the OODA Loop template for personal decision-making?
Absolutely! The template is versatile and can be adapted for personal decision-making, strategic planning, or any scenario where a systematic approach is beneficial.
How detailed should my observations be in the "Observe" section?
Provide enough detail to capture relevant information but focus on key observations to keep the process efficient. Adjust the level of detail based on the complexity of the decision.
Is the OODA Loop template suitable for small and large teams?
Yes, the template is scalable and can be effectively used by teams of any size. It promotes collaboration and aligns teams towards a shared decision-making process.
Can I export the OODA Loop Diagram to other formats for presentations or documentation?
Miro allows you to export your boards in various formats, making incorporating your OODA Loop into presentations, reports, or documentation easy.

Miro
Your virtual workspace for innovation
Miro is an innovation workspace designed for teams of every size, everywhere, to dream, design, and build the future together. Our mission? To empower these teams to create the next big thing, powered by AI at every step of the way. Over 90 million users around the world rely on Miro to untangle complex ideas, put customer needs first, and deliver products and services faster. All supported by best-in-class security, compliance, and scalability.
Categories
Similar templates
PDCA Template
PDCA Template
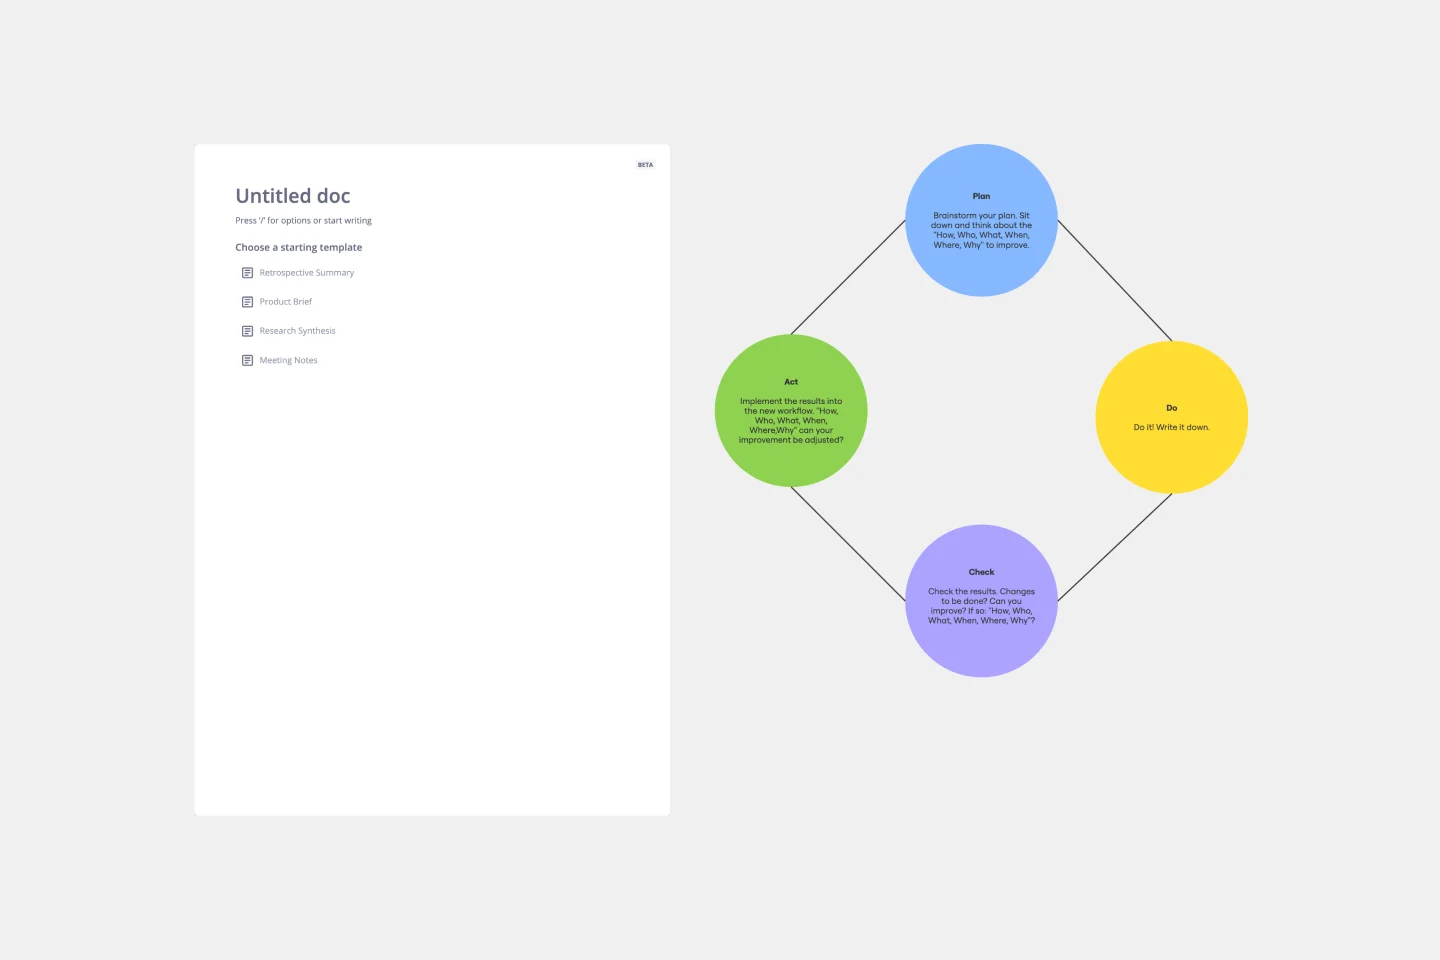
The PDCA template provides a visually compelling representation of the Plan-Do-Check-Act cycle, a foundational management methodology. Structured around four primary segments, this template helps teams systematically address challenges, test solutions, assess outcomes, and make necessary refinements. Using the PDCA template fosters continuous improvement. By cycling through each phase repeatedly, organizations can perpetually refine their strategies, ensuring they always move towards optimal solutions and processes.
Force Field Analysis Template

Force Field Analysis Template
A Force Field Analysis Template is a powerful tool that helps teams identify and analyze the forces supporting or hindering progress toward a specific change or goal. This template provides a visual space where you can brainstorm and plot out 'driving forces' that push objectives forward and 'restraining forces' that prevent advancement, all on a single, intuitive board. One of the primary benefits of utilizing the Force Field Analysis template is that it fosters a shared understanding among team members. By visually mapping out and discussing each force, teams can prioritize efforts, build consensus on the central issues to tackle, and collaboratively devise strategic plans to strengthen positive influences while reducing negative ones.
Strategy Diamond Template
Strategy Diamond Template
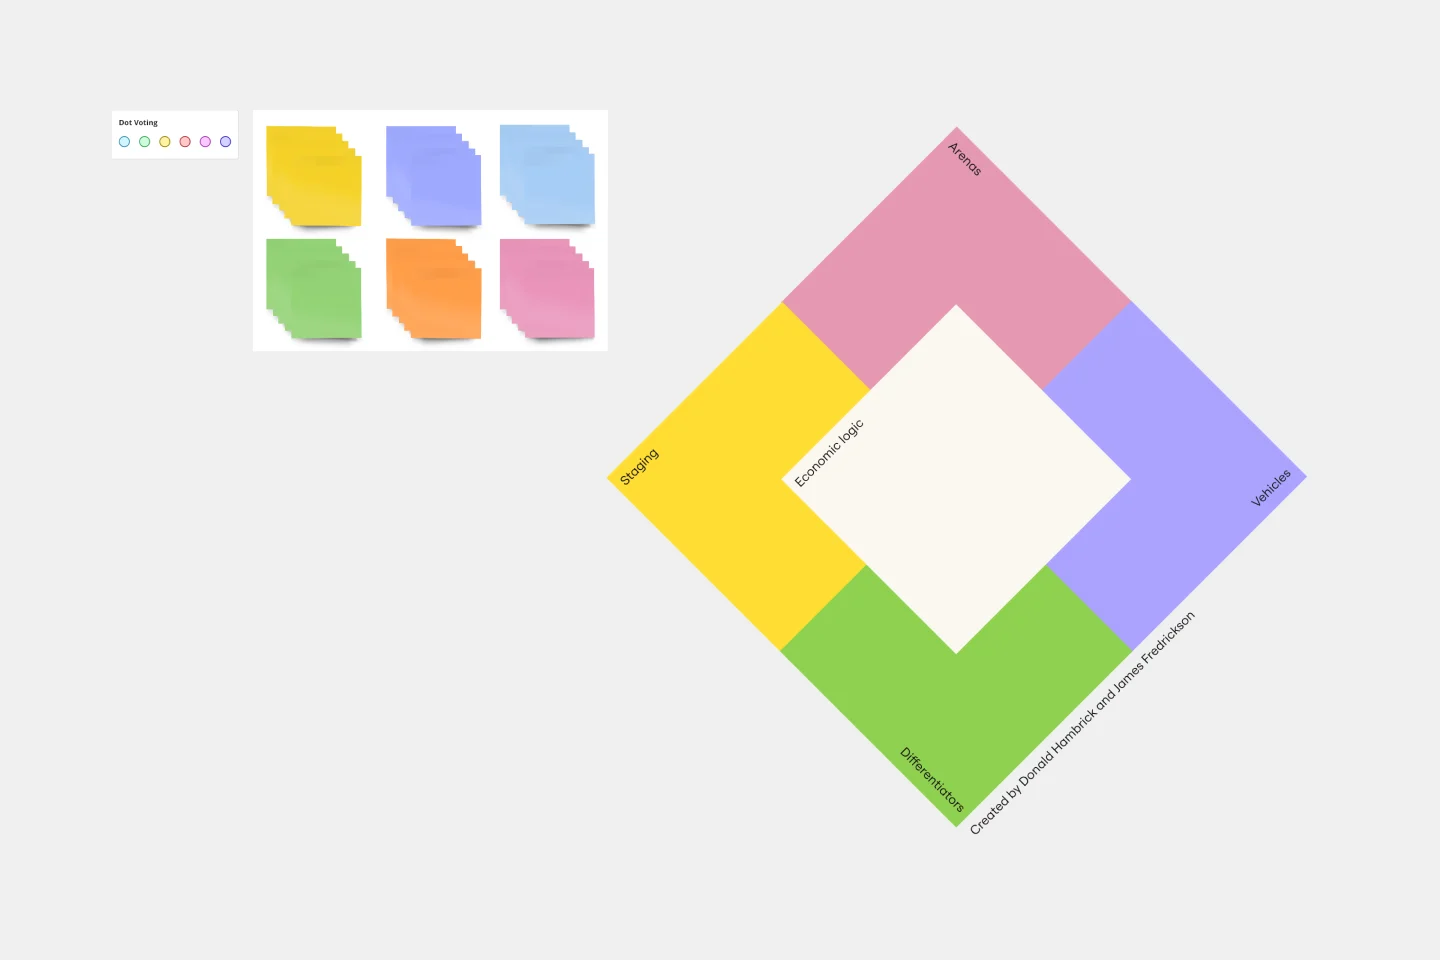
To achieve key objectives, every business assembles a series of strategies. But what elements should you consider when building a strategy? A strategy diamond is a collection of elements forming a coherent business strategy. These elements include: Arenas, Differentiators, Vehicles, Staging, and Economic Logic. Most strategic plans focus on just one or two of these elements, creating gaps that might cause problems for your business later on. A strategy diamond can help you stay focused and ensure you’re fulfilling all of your business’s needs rather than one or two.
Strategic Planning Template
Strategic Planning Template
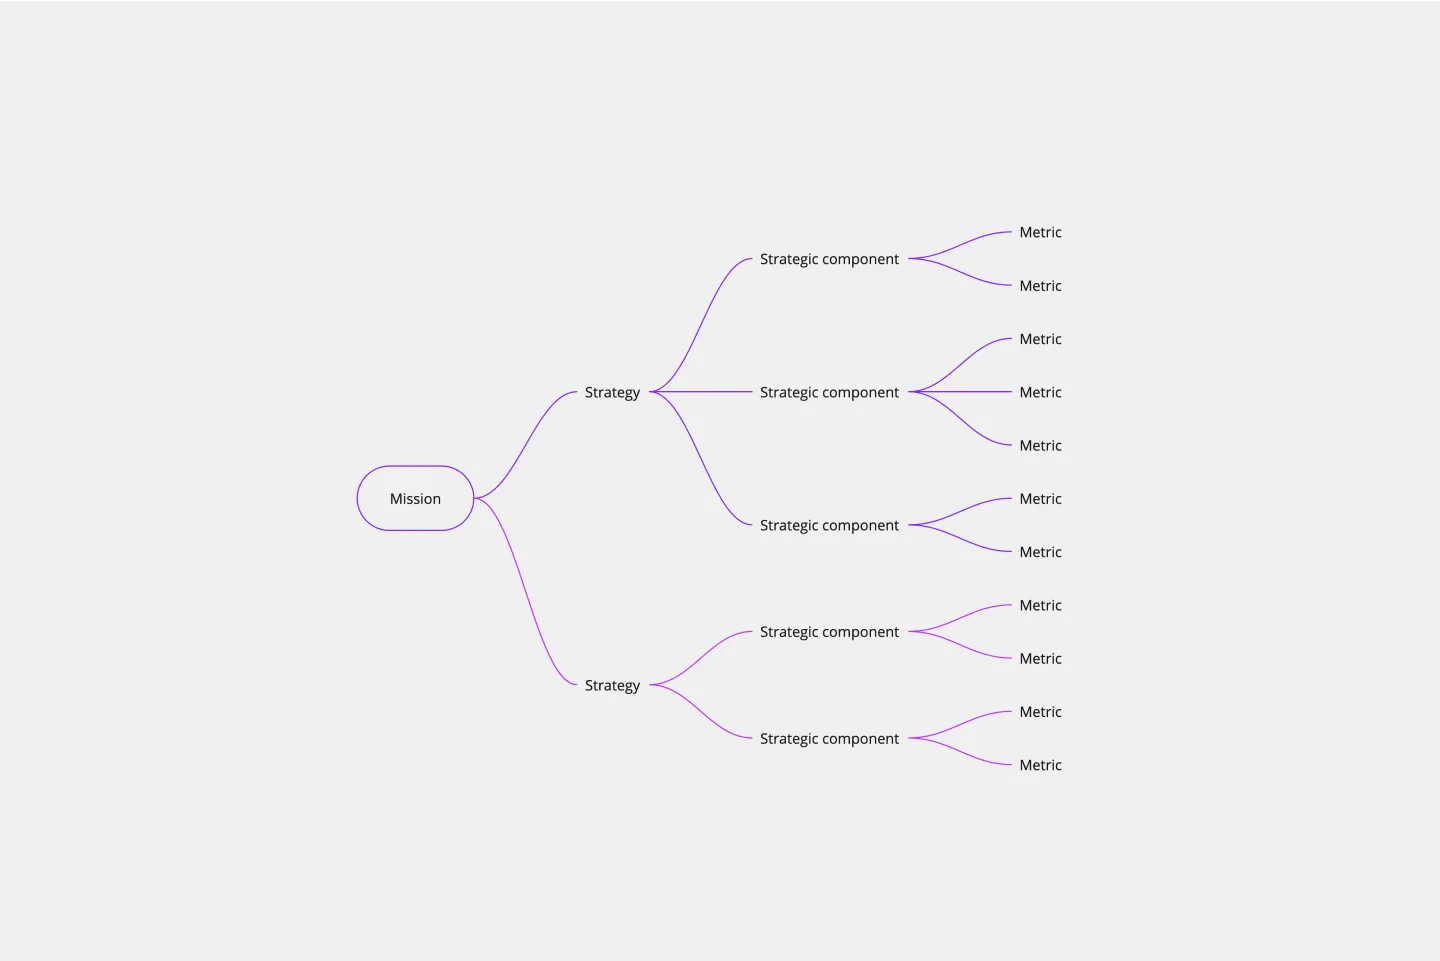
Whenever you need to define your goals and figure out the steps you’ll need to take to accomplish them, you’ll benefit from a Strategic Planning template. The Strategic Planning template guides you and your team through exercises to help you assess your current situation, determine their goals for the future, and develop a plan to help them get there. Generally, strategy considers the goals or reasons for doing something while planning refers to the specific actions you’ll take in order to achieve a specific goal. But with strategic planning, you’re considering both at the same time.
Disney Creative Strategy Template
Disney Creative Strategy Template
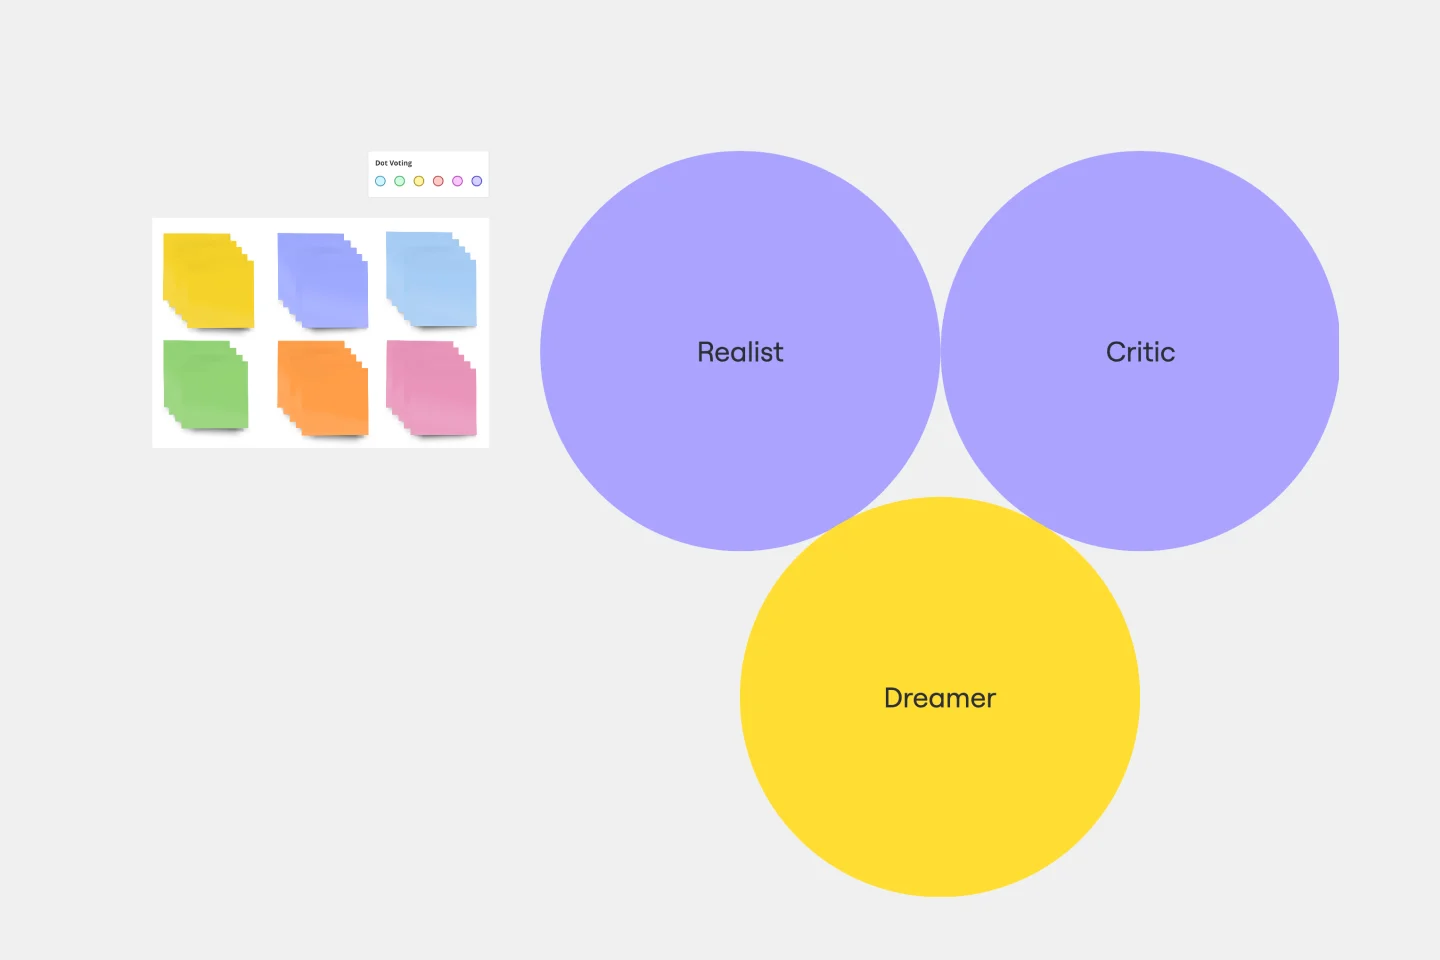
Know who knew a little something about coming up with ideas that set imaginations alight? Walt Disney. And he inspired the Disney Creative Strategy, an approach that establishes three types of thinkers—dreamers, realists, and critics—and gives each the space to do clear thinking. Your team will go through an engaging exercise of adopting the three mindsets, where they’ll focus on a specific aspect of the idea. The Disney Creative Strategy has a way of yielding brilliant ideas and great products. That’s why it’s used successfully by organizations of all kinds and sizes.
Product Positioning Template
Product Positioning Template
For better or for worse, your company’s chances for success hinge partially on your market. As such, before you start building products and planning strategies, it’s a good idea to conduct a product positioning exercise. A product positioning exercise is designed to situate your company and your offering within a market. The product positioning template guides you to consider key topics such as defining your product and market category, identifying your target segment and competitors, and understanding your key benefits and differentiation.
PDCA Template
PDCA Template
The PDCA template provides a visually compelling representation of the Plan-Do-Check-Act cycle, a foundational management methodology. Structured around four primary segments, this template helps teams systematically address challenges, test solutions, assess outcomes, and make necessary refinements. Using the PDCA template fosters continuous improvement. By cycling through each phase repeatedly, organizations can perpetually refine their strategies, ensuring they always move towards optimal solutions and processes.
Force Field Analysis Template
Force Field Analysis Template
A Force Field Analysis Template is a powerful tool that helps teams identify and analyze the forces supporting or hindering progress toward a specific change or goal. This template provides a visual space where you can brainstorm and plot out 'driving forces' that push objectives forward and 'restraining forces' that prevent advancement, all on a single, intuitive board. One of the primary benefits of utilizing the Force Field Analysis template is that it fosters a shared understanding among team members. By visually mapping out and discussing each force, teams can prioritize efforts, build consensus on the central issues to tackle, and collaboratively devise strategic plans to strengthen positive influences while reducing negative ones.
Strategy Diamond Template
Strategy Diamond Template
To achieve key objectives, every business assembles a series of strategies. But what elements should you consider when building a strategy? A strategy diamond is a collection of elements forming a coherent business strategy. These elements include: Arenas, Differentiators, Vehicles, Staging, and Economic Logic. Most strategic plans focus on just one or two of these elements, creating gaps that might cause problems for your business later on. A strategy diamond can help you stay focused and ensure you’re fulfilling all of your business’s needs rather than one or two.
Strategic Planning Template
Strategic Planning Template
Whenever you need to define your goals and figure out the steps you’ll need to take to accomplish them, you’ll benefit from a Strategic Planning template. The Strategic Planning template guides you and your team through exercises to help you assess your current situation, determine their goals for the future, and develop a plan to help them get there. Generally, strategy considers the goals or reasons for doing something while planning refers to the specific actions you’ll take in order to achieve a specific goal. But with strategic planning, you’re considering both at the same time.
Disney Creative Strategy Template
Disney Creative Strategy Template
Know who knew a little something about coming up with ideas that set imaginations alight? Walt Disney. And he inspired the Disney Creative Strategy, an approach that establishes three types of thinkers—dreamers, realists, and critics—and gives each the space to do clear thinking. Your team will go through an engaging exercise of adopting the three mindsets, where they’ll focus on a specific aspect of the idea. The Disney Creative Strategy has a way of yielding brilliant ideas and great products. That’s why it’s used successfully by organizations of all kinds and sizes.
Product Positioning Template
Product Positioning Template
For better or for worse, your company’s chances for success hinge partially on your market. As such, before you start building products and planning strategies, it’s a good idea to conduct a product positioning exercise. A product positioning exercise is designed to situate your company and your offering within a market. The product positioning template guides you to consider key topics such as defining your product and market category, identifying your target segment and competitors, and understanding your key benefits and differentiation.