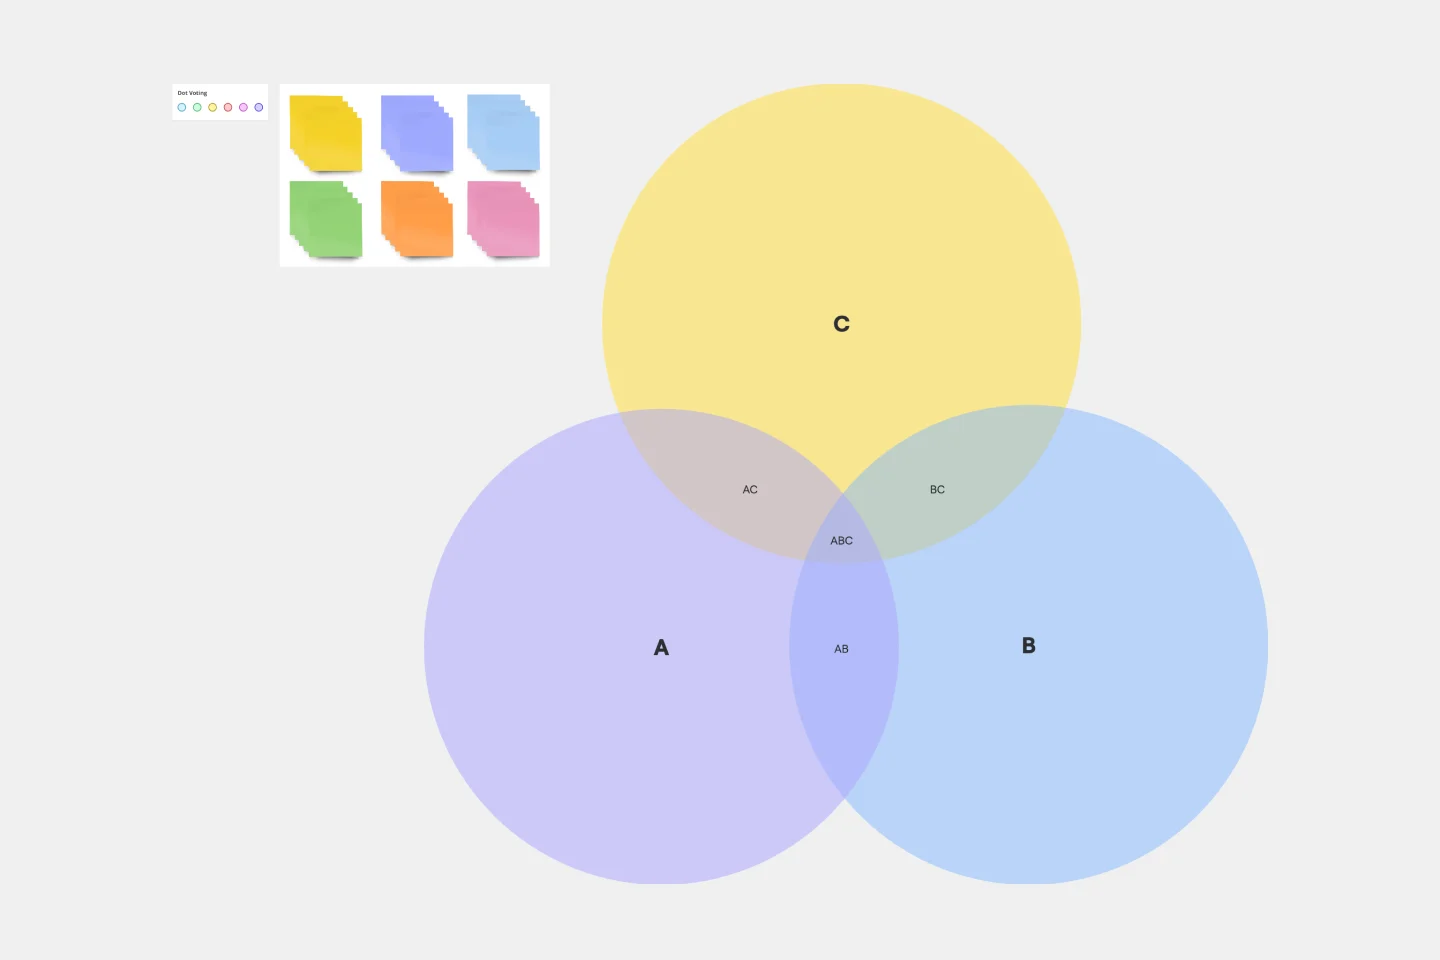
Onion Diagram Template
Discover the power and precision of the Onion Diagram Template. Visualize the components of a specific concept, system, or process and clarify their hierarchy and importance.
About the Onion Diagram Template
At Miro, we always look for innovative ways to visually represent complex ideas, making collaboration more intuitive and productive. Our Onion Diagram Template is yet another tool in our suite designed to help you streamline your processes and achieve clarity in your projects.
What's an Onion Diagram Template?
An onion diagram is a type of diagram that showcases layers of a concept, system, or process, much like the layers of an actual onion. Each layer of the diagram represents a different aspect or phase, starting from the innermost core and moving outwards to the outer layers. This structure allows viewers to understand relationships, hierarchies, or sequences in a visual, layered format.
What are the benefits of using an Onion Diagram Template?
Hierarchical visualization: Clearly see the priority or sequence of different elements in a process or system.
Easy analysis: Quickly identify bottlenecks, dependencies, or relationships between layers.
Universal usage: Suitable for various industries, including IT, business analysis, and education.
Enhanced collaboration: Team members can collectively analyze and change diagrams in real time.
How to use an Onion Diagram Template in Miro?
Using the Onion Diagram Template in Miro is straightforward:
Select the template: Go to Miro's Template Library and select the Onion Diagram Template.
Explore automated diagramming: Miro has automated diagramming features. Use our ready-made template and edit data as you see fit, or create an onion diagram from scratch using our shapes library. As you create your diagram, it can auto-adjust, making it easier to visualize complex layers.
Customize your diagram: Drag and drop elements, change colors, or add sticky notes to suit your specific needs.
Save and share: Once your onion diagram is complete, share the board link with team members for collaborative viewing and editing.
How many layers can I add to my onion diagram?
There's no strict limit to the number of layers. However, for clarity and usability, it's best to limit the layers to a number that's easily digestible for viewers.
Can I use the Onion Diagram Template on mobile devices?
Yes, Miro's platform is optimized for both desktop and mobile use, ensuring seamless collaboration regardless of the device.
Are there preset color schemes available for the onion diagram?
Yes, Miro provides a range of color palettes. You can also customize colors to align with your branding or preference.
Get started with this template right now.
Cross Functional (Swimlane) Chart
Works best for:
Flowcharts, Mapping, Diagrams
The Cross Functional (Swimlane) Chart template offers a visual tool for mapping out processes or workflows with multiple stakeholders or functional areas. It provides swimlanes for organizing tasks and responsibilities by department or role. This template enables teams to visualize process flows, identify handoffs, and improve coordination and collaboration across functions. By promoting transparency and accountability, the Cross Functional (Swimlane) Chart empowers organizations to streamline workflows and drive cross-functional alignment effectively.
SDLC Template
Works best for:
Diagramming
The Software Development Life Cycle (SDLC) template is a well-designed visual tool that helps software development teams follow a structured approach from the initial concept to the final deployment of the software. One of the most significant benefits of using this template is that it promotes clear, streamlined communication among team members. By breaking the development cycle into distinct phases, all stakeholders can stay informed about the progress of the project and understand their responsibilities within the larger context. This enhanced communication reduces the chances of misunderstandings and ensures that everyone works together towards the common goal of delivering high-quality software. The template acts not only as a roadmap but also as a shared language for the team, improving collaboration and the efficient progression of the project through each critical stage.
Cloudflare RAG Architecture Knowledge Queries Template
The Cloudflare RAG Architecture Knowledge Queries template is a cutting-edge tool designed to streamline the process of diagramming and understanding the intricate architecture of Cloudflare's Retrieval Augmented Generation (RAG) system. This template is a boon for teams aiming to visualize, query, and optimize Cloudflare's infrastructure collaboratively.
Service Blueprint by Edmond Gozo
Works best for:
Diagramming
The Service Blueprint template is a visual tool for designing and optimizing service experiences. It provides a structured framework for mapping customer journeys, identifying touchpoints, and aligning internal processes. This template enables teams to visualize the entire service ecosystem, uncover pain points, and innovate solutions to enhance customer satisfaction. By promoting customer-centricity and collaboration, the Service Blueprint empowers organizations to deliver exceptional service experiences and drive sustainable growth.
Miro for AWS Well-Architected Framework Reviews
Works best for:
Diagramming, AWS
This AWS Well-Architected Framework Review (WAFR) template provides you and your team with a dedicated space to conduct a Well-Architected Framework Review with a client.
Phylogenetic Tree Template
Works best for:
Diagramming
The Phylogenetic Tree Template is a powerful tool that allows scientists and researchers to visualize evolutionary relationships between species. It is a visual representation of the history of the evolution of life on Earth and helps users identify the relationships between other organisms and their ancestors. The key benefit of this template is that it organizes complex data and makes it more understandable to everyone. Additionally, it offers an efficient way to collect and analyze data, saving time and effort and enabling users to identify significant patterns and relationships in the data.