About the Milestone Chart Template
A milestone chart is a visual representation of important events, known as milestones, planned in a project’s timeline. Milestone charts show one milestone per vertical line, with a description on the left-hand side of the milestone, and a horizontal timescale for the whole project.
When to use a milestone chart
Anytime your team collaborates on a large project with multiple tasks and deadlines, you can use a milestone chart. You may also find it useful to share the milestone chart with your managers or customers to update them on your progress and the likelihood of meeting your overall deadline.
Benefits of using a milestone chart
Unless your team tracks your milestones, you have no way of knowing whether you’re getting closer to your destination. By deciding on and tracking key milestones for your project, you can stay on schedule and reach your goals on time.
How to create a milestone chart
If your project has been planned or is in the process of being planned, here’s how to create a simple but effective milestone chart.
Step 1: Determine major milestones
For project managers and stakeholders, it can be difficult to parse out milestones from tasks. Milestones are distinct because they signify shifts in a project’s development. Think of them as road signs that help you stay on the right path as you work to complete a project.
To decide on a milestone, you might find it helpful to ask the following questions:
Does this task impact our deadline?
Is this a task or a deliverable?
Will this point in the project signify significant forward progress?
Does this task need to be reviewed by stakeholders?
If this task doesn’t get done, can we still complete the project?
Step 2: Create a milestone chart from a template
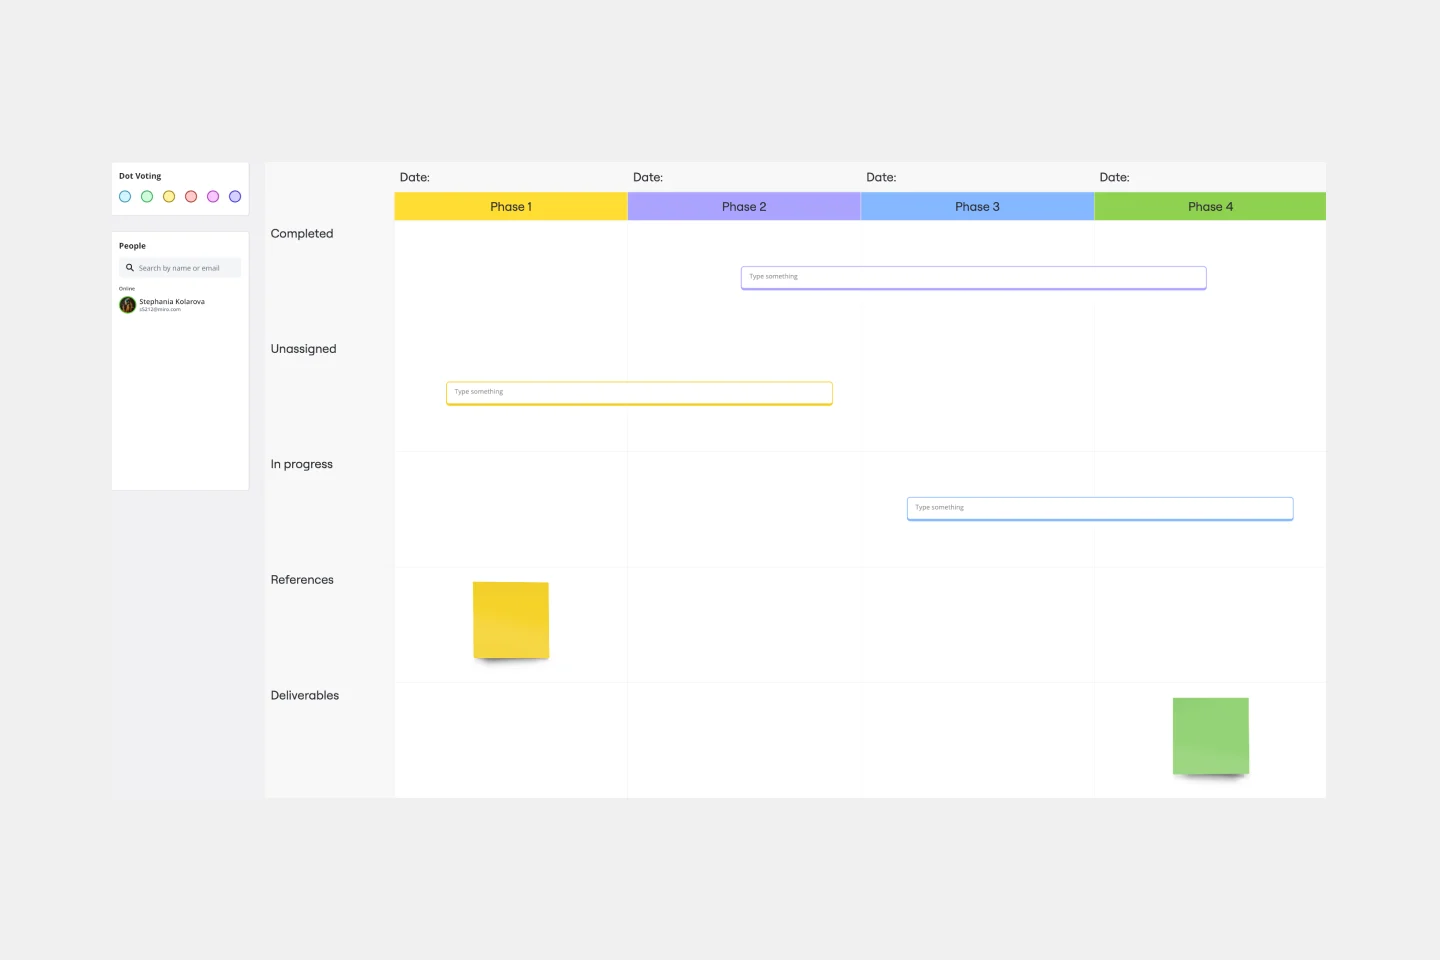
Miro is the perfect tool to create and share your milestone chart. Get started by selecting this milestone chart template. Use our simple template to visually track the smaller steps within a large project. For each milestone, we’ve pre-populated the template with several columns; as well as rows to track deadlines, steps, and deliverables. Then, customize the template to fit the needs of your particular project.
Step 3: Track each major milestone as a column
In our milestone chart template, each column is for a unique milestone. Once created, you can customize the milestone chart by adding as many columns for unique milestones as you need to. Remember, be careful to distinguish between major milestones and minor tasks. The number of milestones you chose to track will vary by project type and size, but it’s generally helpful to isolate only the most important milestones.
Step 4: Define dates, steps, and deliverables
The first row of a milestone chart is dedicated to displaying the date or dates that the particular milestone is expected to be completed. These can be specific dates, or time ranges depending on your need.
The second row of the milestone chart is for the high-level steps that need to be completed in order for the milestone to be reached. These don’t need to be very granular to avoid cluttering the chart.
The third row of the milestone chart is for specific deliverables. Ideally, these deliverables will be used to measure whether or not the milestone has been reached. Take the time to make sure these deliverables account for all major indicators of your milestone completion.
Step 5: Customize and track
Milestone charts are by design customizable for the specific project's needs. As a project progresses, you may find the need to make changes to accommodate for unforeseen problems. Keep track of each milestone’s progress, and make sure to collaborate regularly with your team on new developments.
Milestone Chart FAQ
What is the typical format of a Milestone Chart?
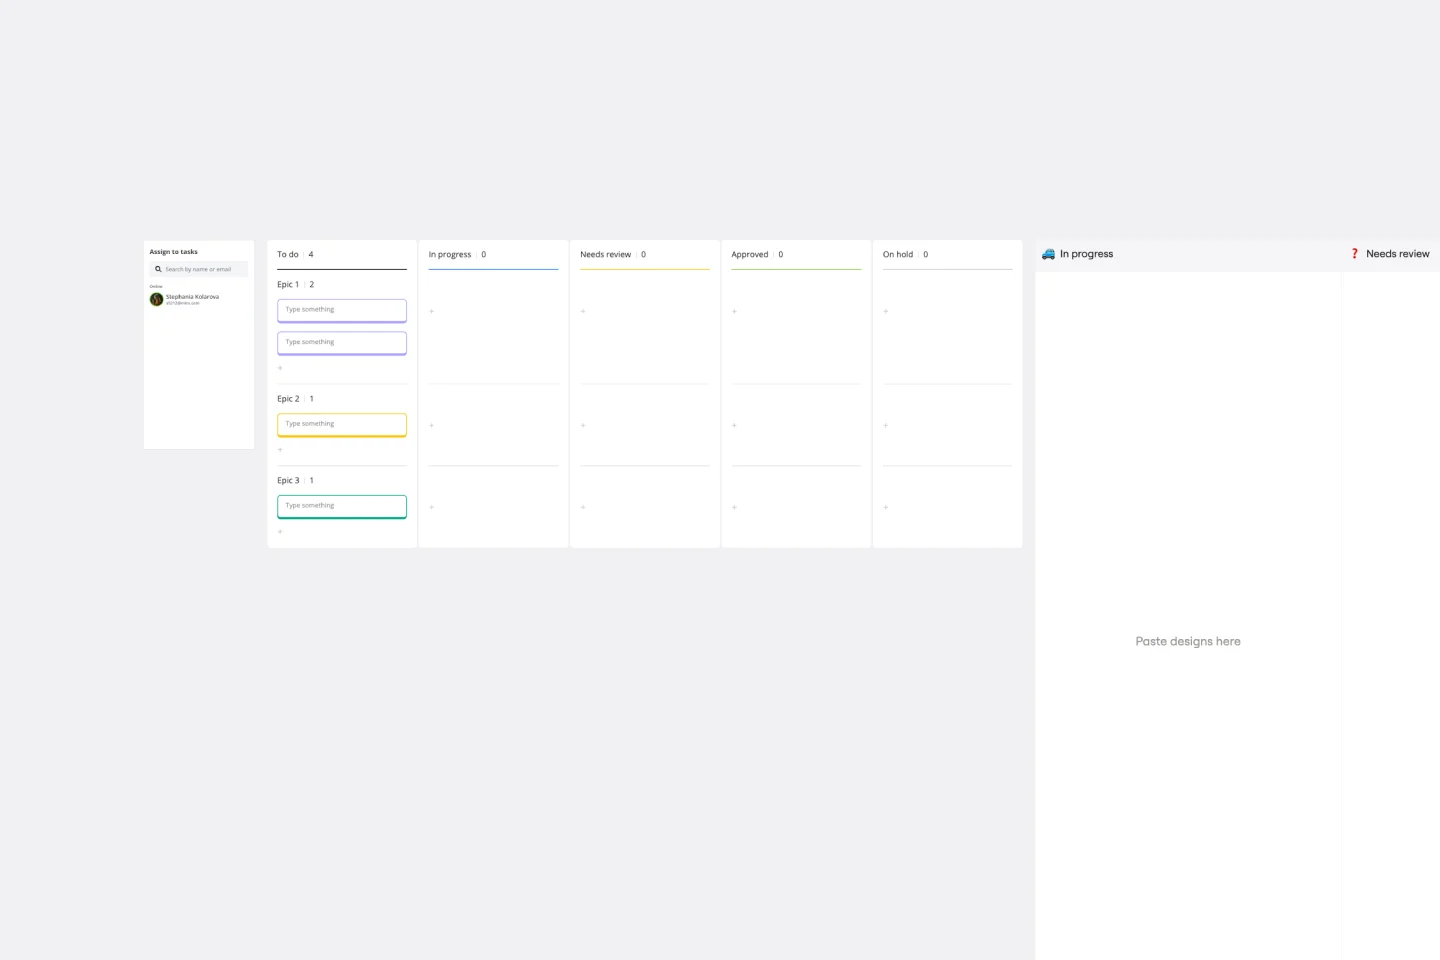
Track each project milestone, both on a visual timeline and on a static chart, with this detailed project milestone template. Identify who is assigned to each task, the status of each task, and any comments that accompany those tasks. Use the status key to see which tasks have yet to be started, which are on hold, and which are in progress.
How do you use a milestone chart?
Map out your project and each individual task across a predetermined timeline with this project timeline with milestones template. Show each task across a certain timeline, such as by month, quarter, or year, so you can get an accurate portrayal of the work left to be completed. Point out specific milestones that your team needs to hit in order to maintain the project timeline.

Miro
Your virtual workspace for innovation
Miro is an innovation workspace designed for teams of every size, everywhere, to dream, design, and build the future together. Our mission? To empower these teams to create the next big thing, powered by AI at every step of the way. Over 90 million users around the world rely on Miro to untangle complex ideas, put customer needs first, and deliver products and services faster. All supported by best-in-class security, compliance, and scalability.
Categories
Similar templates
Project Kickoff Template
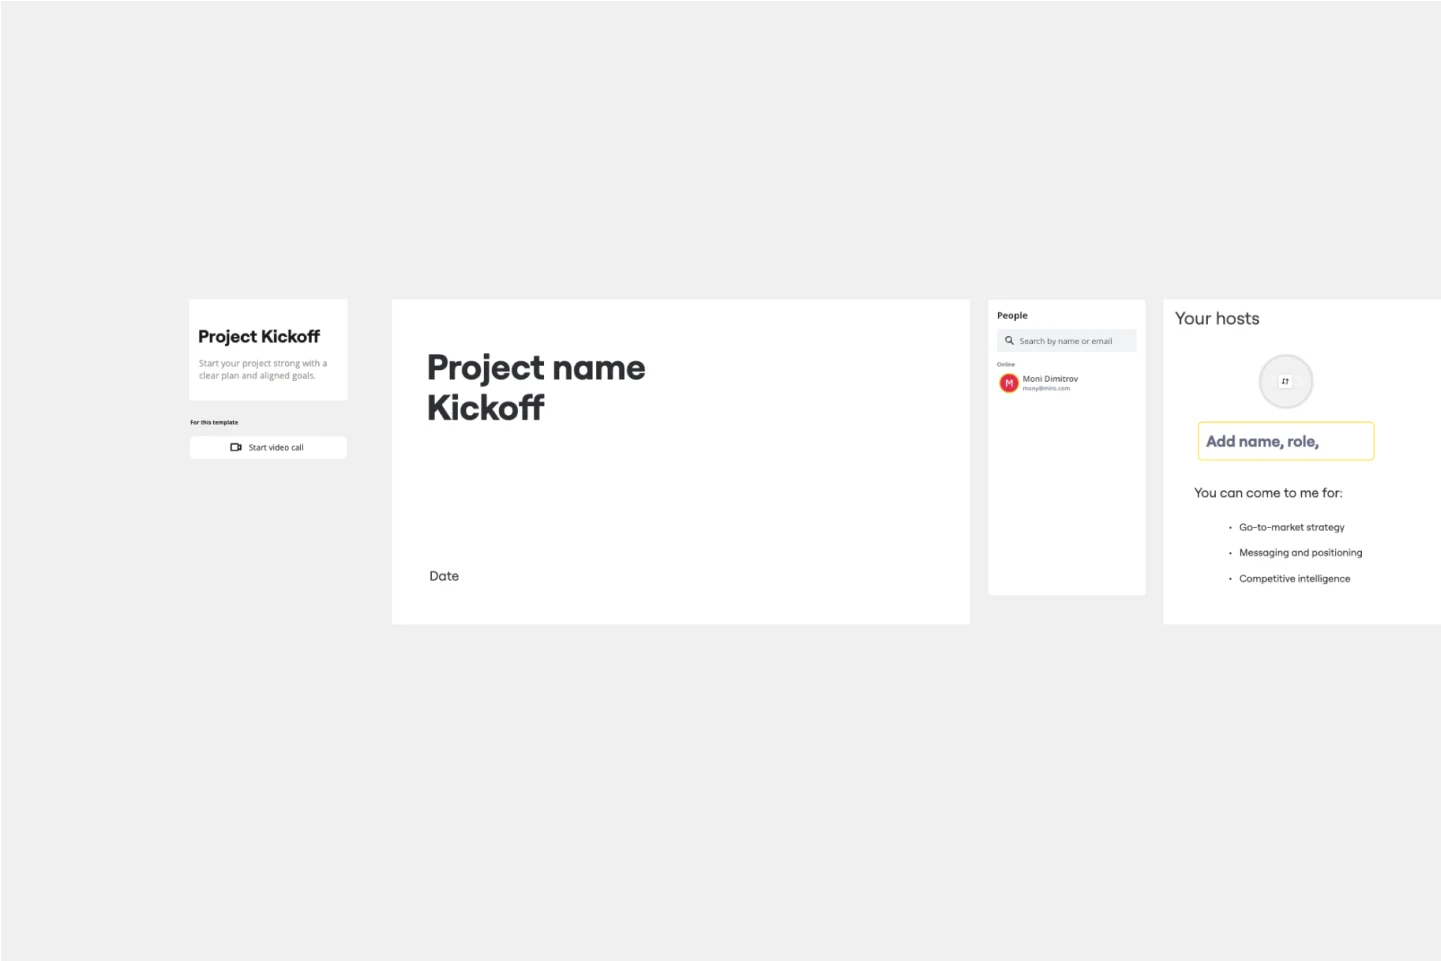
Project Kickoff Template
This Project Kickoff Meeting Template helps you have all the information about your project in one shared space, like a project manifesto. This template has seven activities to define your project’s goals and objectives, the team’s roles and responsibilities, and the next steps and resource materials for further consultation. Use the Project Kickoff Meeting Template to manage projects effectively and keep everyone aligned.
Timeline Workflow
Timeline Workflow
A timeline is a visual tool that chronologically plots out projects step by step. It’s an ideal tool for your team to tell stories (such as an overview of events in your organization) and visualize your projects or processes. The Timeline Workflow template is perfect for any project that relies on visual content. You may find it beneficial to use with your team and also to share with other stakeholders or clients to keep them in the loop on your progress.
Workflow Template
Workflow Template
The digital world requires collaboration, and better collaboration leads to better results. A workflow is a project management tool that allows you to sketch out the various steps, resources, timeline and roles necessary to complete a project. It can be used on any multi-step project, whether it’s a business process or otherwise, and is ideal for plotting out the tangible actions you’ll need to take to achieve a goal and the order in which you need to complete those actions.
Business Model Canvas Template
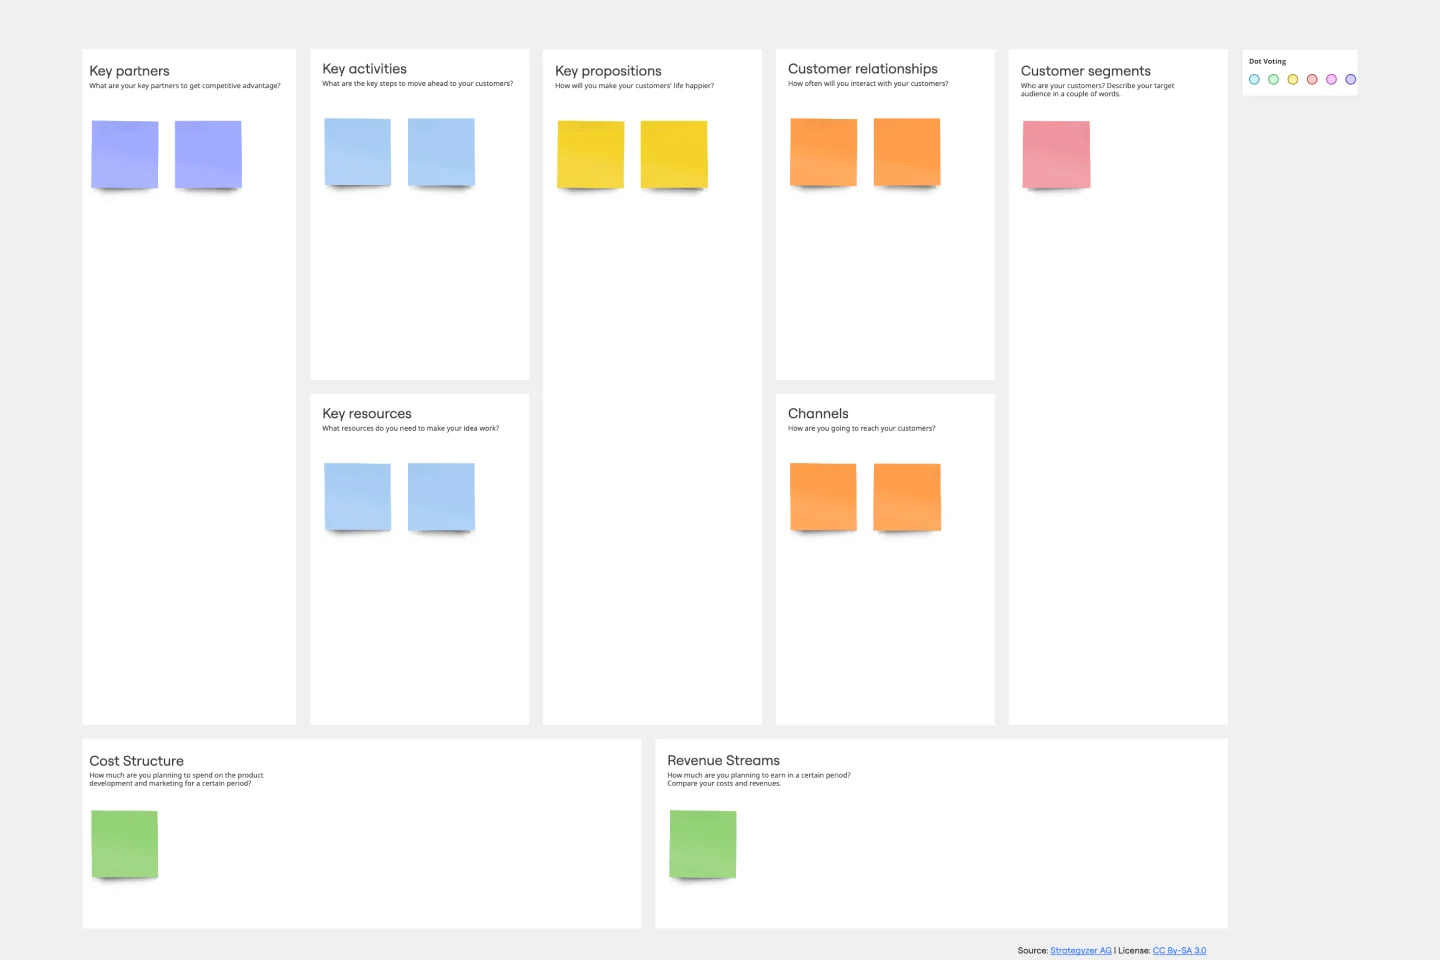
Business Model Canvas Template
Your business model: Nothing is more fundamental to who you are, what you create and sell, or ultimately whether or not you succeed. Using nine key building blocks (representing nine core business elements), a BMC gives you a highly usable strategic tool to develop and display your business model. What makes this template great for your team? It’s quick and easy to use, it keeps your value proposition front and center, and it creates a space to inspire ideation.
Project Kickoff Template
Project Kickoff Template
This Project Kickoff Meeting Template helps you have all the information about your project in one shared space, like a project manifesto. This template has seven activities to define your project’s goals and objectives, the team’s roles and responsibilities, and the next steps and resource materials for further consultation. Use the Project Kickoff Meeting Template to manage projects effectively and keep everyone aligned.
Timeline Workflow
Timeline Workflow
A timeline is a visual tool that chronologically plots out projects step by step. It’s an ideal tool for your team to tell stories (such as an overview of events in your organization) and visualize your projects or processes. The Timeline Workflow template is perfect for any project that relies on visual content. You may find it beneficial to use with your team and also to share with other stakeholders or clients to keep them in the loop on your progress.
Workflow Template
Workflow Template
The digital world requires collaboration, and better collaboration leads to better results. A workflow is a project management tool that allows you to sketch out the various steps, resources, timeline and roles necessary to complete a project. It can be used on any multi-step project, whether it’s a business process or otherwise, and is ideal for plotting out the tangible actions you’ll need to take to achieve a goal and the order in which you need to complete those actions.
Business Model Canvas Template
Business Model Canvas Template
Your business model: Nothing is more fundamental to who you are, what you create and sell, or ultimately whether or not you succeed. Using nine key building blocks (representing nine core business elements), a BMC gives you a highly usable strategic tool to develop and display your business model. What makes this template great for your team? It’s quick and easy to use, it keeps your value proposition front and center, and it creates a space to inspire ideation.