About the Market Segmentation Matrix Template
Market segmentation helps you to better understand your market. This practice divides your target market into subsets based on demographics, geography, needs, interests, psychographics, and behavior. With this information on hand, it’s easier to leverage these divisions of your target market so you can build better product, sales, and marketing strategies.
Keep reading to learn more about market segmentation.
What is the market segmentation matrix?
The market segmentation matrix is an analytical business tool that allows your team to see how various segments have performed with a set of products. Market segmentation divides a market into different parts and helps your business offer the right products to the target market's customers.
The four market segments
The Market Segmentation Matrix template is divided into four quadrants, each of them representing one market segment: geographic, psychographic, behavioral, and demographic.
Because market segmentation analyzes consumers’ traits, behaviors, and overall characteristics, the template is an effective way to build demographic profiles of your customers. This template contains the most commonly-used segments, but you can easily add additional characteristics based on your needs and industry.
How to use the Market Segmentation Template
As mentioned previously, the Market Segmentation Matrix template is made up of four quadrants:
Quadrant 1: Geographic
Add any information regarding the location of your consumers. Zip codes, regions, and countries go into this quadrant. Think about economic zones and entire continents if you target a larger audience.
Quadrant 2: Psychographic
Add your consumer’s personality traits and interests. What are their emotions? What do they need? What are their beliefs?
Build a psychological profile of your consumer, identifying their lifestyles and preferences.
Quadrant 3: Behavioral
Like the psychographic quadrant, analyze how your consumers feel and behave with your product or service. Do they use your product? Are they loyal to your brand? How do they shop online? Map out any behavior they have when in contact with your business.
Quadrant 4: Demographic
Here, you can add demographic details such as age, occupation, education level, and gender identity. These characteristics should be quantifiable, allowing you to collect the primary data behind your consumers.
When creating or building your Market Segmentation template in Miro, invite your teammates to join the board and collaborate with you. Add ideas with sticky notes and upload photos, videos, or any other file type as needed. You may also want to color-code the sticky notes according to segment size or feasibility of pursuing a segmentation strategy with that particular group.
Benefits of using a market segmentation matrix
With the market segmentation matrix, it’s easier to market to customers and prospects. Because the barrier to entry is so low, it’s important to act with precision and avoid wasting resources.
Customers and prospects have high expectations for how, when, where, and why they buy and use products and services—and they have transferred those expectations onto marketing and advertising. These expectations are also constantly in flux, so your organization must stay aware of customer needs, behaviors, and desires.
Your market segmentation matrix lets you keep track of customer and prospect behavior, create marketing experiences that resonate, and boost your bottom line.
Without segmentation, you risk wasting resources by creating a marketing campaign that is too broad or targets the wrong population. By targeting the right people and double-checking to ensure that that population hasn’t shifted, your business will be better off in the long run and gain a competitive advantage.
When to use a market segmentation matrix
Your team should use a market segmentation matrix anytime you work on a new, existing, or planned marketing campaign. It allows you to track customer and prospect behavior and expectations easily, create more targeted marketing experiences, and improve your growth potential.
FAQ about the Market Segment template
How do you write a market segmentation plan?
First, set your ultimate marketing objective when creating your market segmentation plan. Are you trying to launch a new product or campaign? Better target your ads? Define your goals, and afterward, run user and market research to know your consumer’s characteristics and behaviors. Add this data to your Market Segmentation template and use this information to tailor your ads and target the right audience or build your product with the right consumer in mind.
How do you identify market segments and targets?
You can identify market segments and targets by conducting market and user research. Analyzing their behavior and patterns is a good starting point. If you need complementary information, some analytics tools are also helpful in identifying consumer profiles and how they interact with your product, service, or brand.

Miro
Your virtual workspace for innovation
Miro is an innovation workspace designed for teams of every size, everywhere, to dream, design, and build the future together. Our mission? To empower these teams to create the next big thing, powered by AI at every step of the way. Over 90 million users around the world rely on Miro to untangle complex ideas, put customer needs first, and deliver products and services faster. All supported by best-in-class security, compliance, and scalability.
Categories
Similar templates
BCG Matrix Template
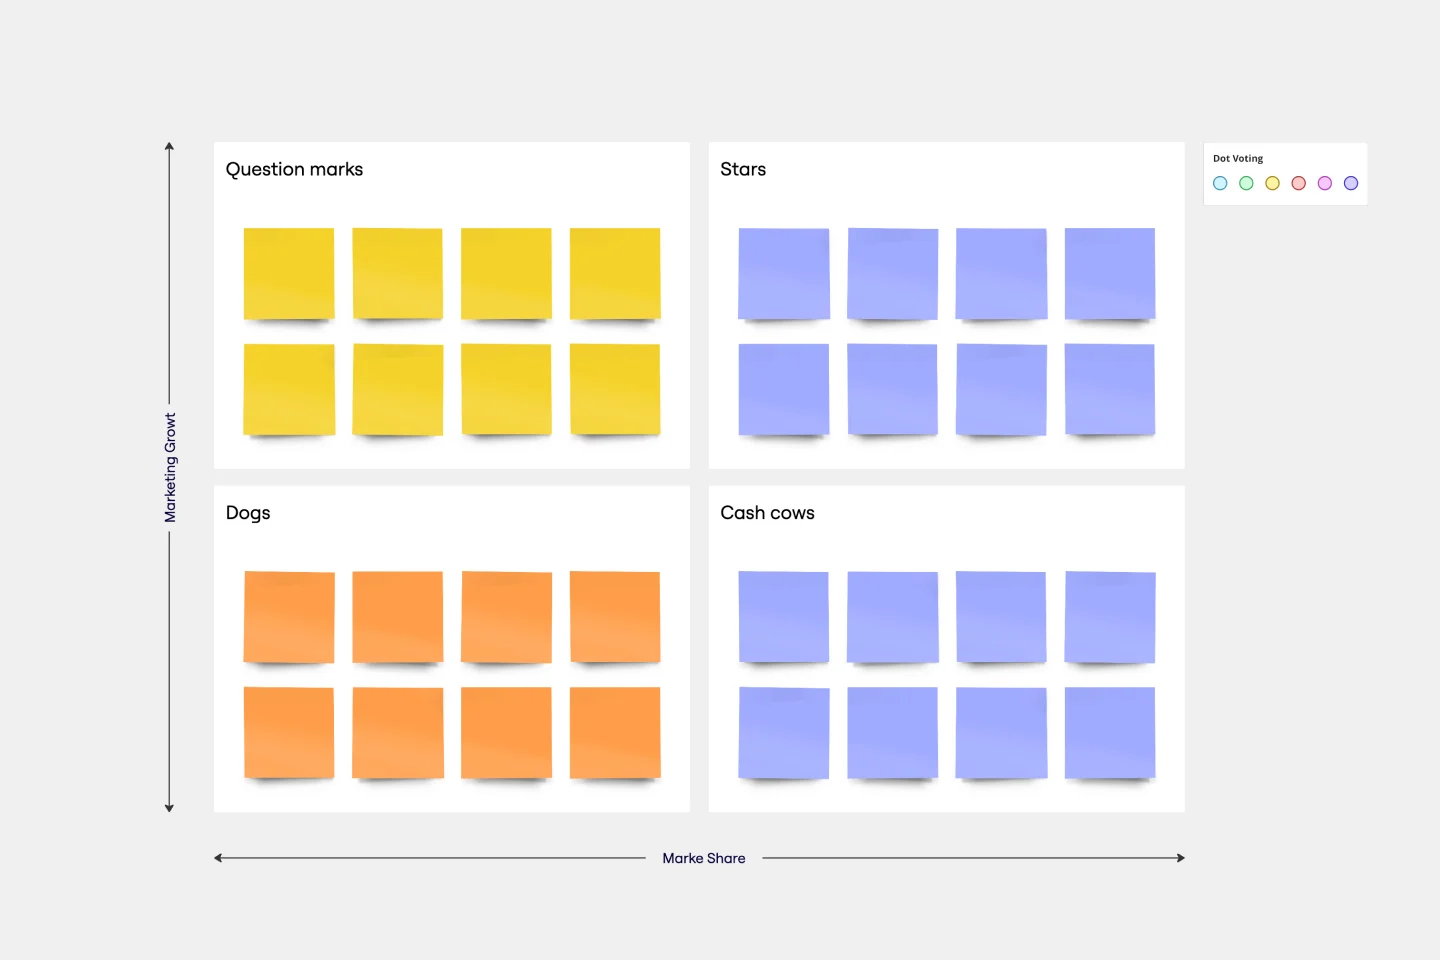
BCG Matrix Template
Use the BCG matrix template to make informed and strategic decisions about growth opportunities for your business. Assign your portfolio of products to different areas within the matrix (cash cows, dogs, question marks, stars) to prioritize where you should invest your time and money to see the best results.
How Now Wow Matrix Template
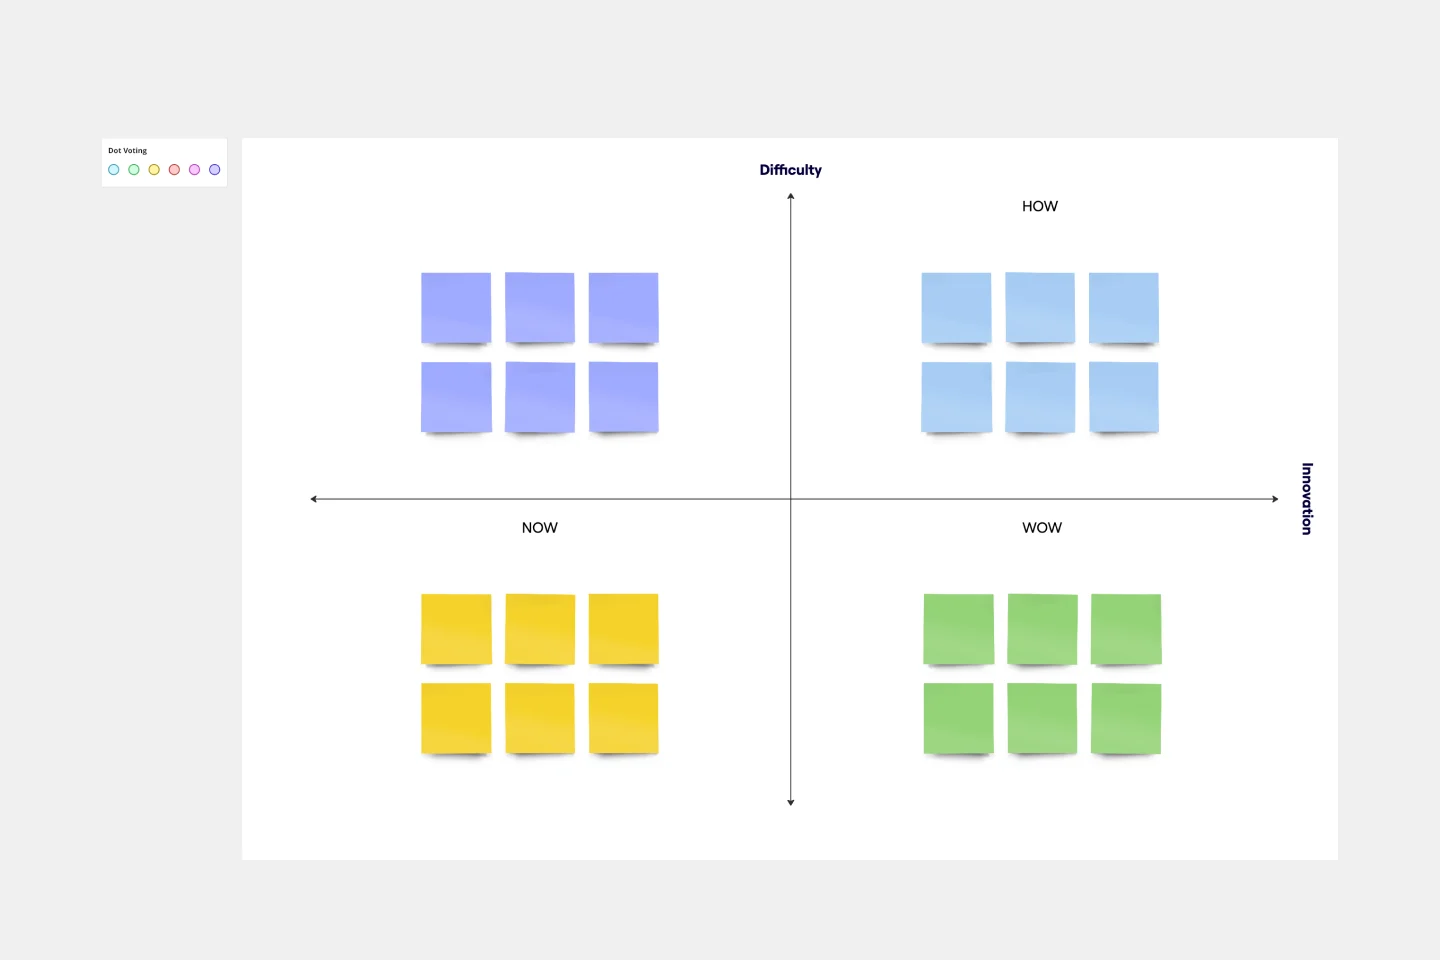
How Now Wow Matrix Template
There are no bad ideas in a brainstorm — but some are more original and easier to implement. The How Now Wow matrix is a tool that helps you identify and organize those great ideas, as well as reinvigorates your team to think creatively and take risks (a taller order as you scale). Grab this template to create your own matrix, then rank the ideas you generated in a brainstorm as “How” (difficult to implement), “Now” (easy to implement), or “Wow” (both original and easy to implement).
Eisenhower Matrix Template
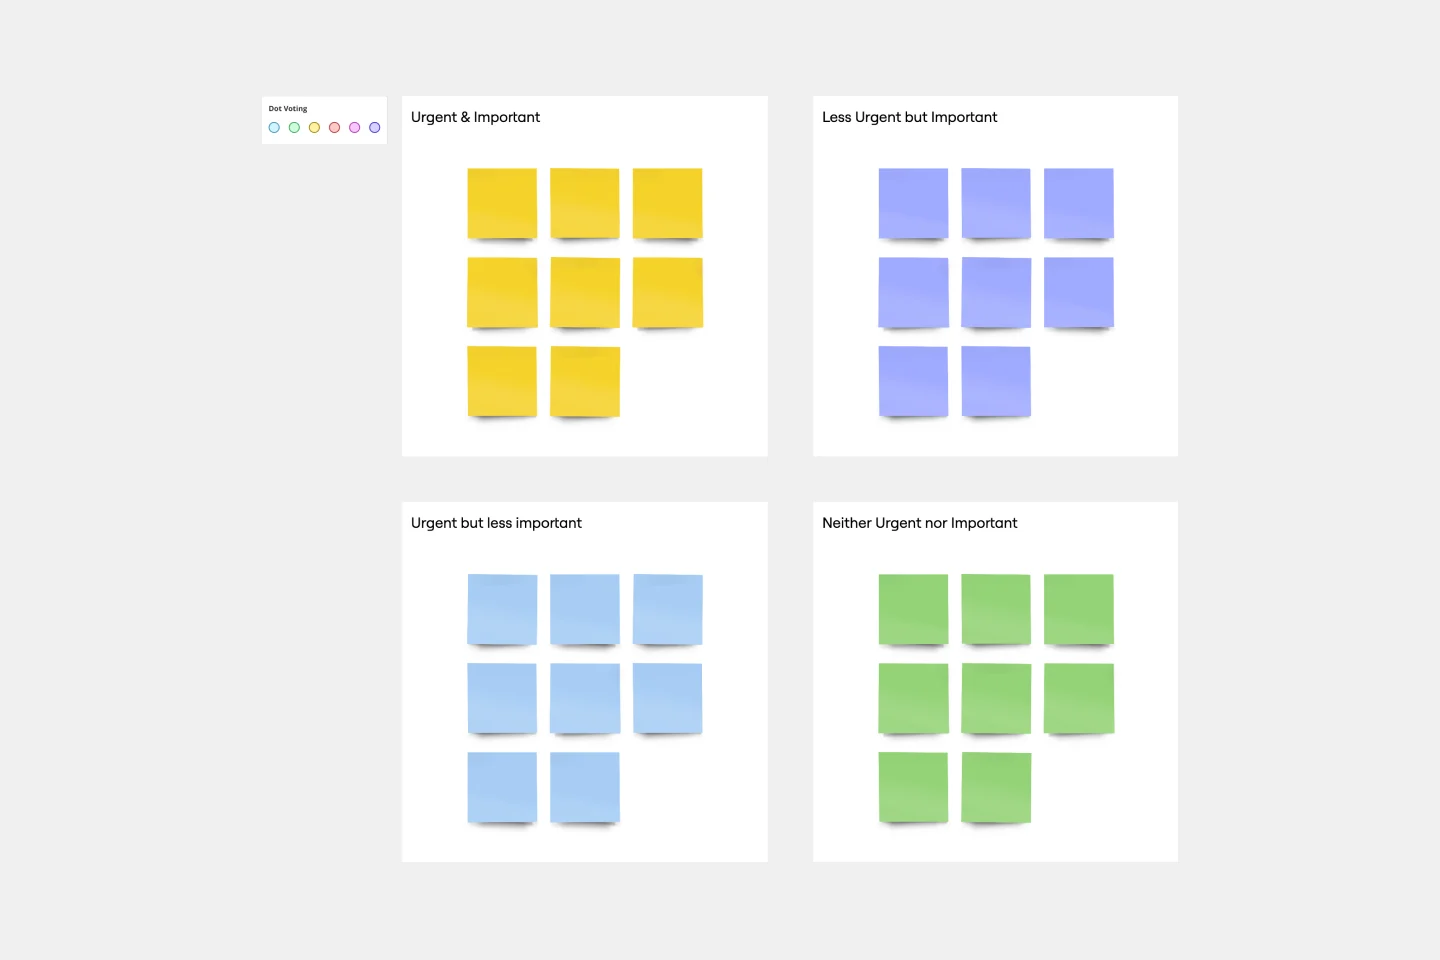
Eisenhower Matrix Template
Have an overwhelming list of to-dos? Prioritize them based on two key factors: urgency and importance. It worked for American president Dwight D. Eisenhower, and it can work for you—this decision-making framework will help you know where to start and how to plan your day. With our template, you can easily build an Eisenhower Matrix with a quadrant of key areas (Do, Schedule, Delegate, and Don’t Do) and revisit it throughout the day as your priorities change.
BCG Matrix Template
BCG Matrix Template
Use the BCG matrix template to make informed and strategic decisions about growth opportunities for your business. Assign your portfolio of products to different areas within the matrix (cash cows, dogs, question marks, stars) to prioritize where you should invest your time and money to see the best results.
How Now Wow Matrix Template
How Now Wow Matrix Template
There are no bad ideas in a brainstorm — but some are more original and easier to implement. The How Now Wow matrix is a tool that helps you identify and organize those great ideas, as well as reinvigorates your team to think creatively and take risks (a taller order as you scale). Grab this template to create your own matrix, then rank the ideas you generated in a brainstorm as “How” (difficult to implement), “Now” (easy to implement), or “Wow” (both original and easy to implement).
Eisenhower Matrix Template
Eisenhower Matrix Template
Have an overwhelming list of to-dos? Prioritize them based on two key factors: urgency and importance. It worked for American president Dwight D. Eisenhower, and it can work for you—this decision-making framework will help you know where to start and how to plan your day. With our template, you can easily build an Eisenhower Matrix with a quadrant of key areas (Do, Schedule, Delegate, and Don’t Do) and revisit it throughout the day as your priorities change.