About the KPI Tree Template
As our business initiatives evolve, tracking and understanding key performance indicators (KPIs) becomes paramount. The KPI Tree Template is designed to offer a visually compelling method for aligning objectives, strategies, tactics, and KPIs. This ensures cohesion and understanding across the team, streamlining our efforts toward shared goals.
What's a KPI Tree Template?
A KPI Tree Template is a structured visual tool that systematically breaks down an organization's primary objectives into detailed strategies, tactics, and measurable KPIs. By presenting these elements hierarchically, organizations can better discern the relationships between various components and how each contributes to the overarching goals.
One of the primary benefits of using this template is its ability to provide clarity. Instead of viewing goals and strategies as isolated entities, teams can witness the interplay of different elements, ensuring that all efforts are harmonized and directed toward achieving the organization's mission. Also, this visual mapping promotes enhanced communication and understanding among team members, reducing potential misalignments and fostering a unified approach to achieving business milestones.
How to use a KPI Tree Template in Miro
Miro's automated diagramming features make creating and navigating your KPI tree a breeze. Here's a step-by-step guide to using the KPI Tree Template:
Start your tree with an objective: Define the primary objective or goal your organization wishes to achieve. This serves as the root from which all other branches will grow.
Branch out with strategies: For every objective, outline the strategies you intend to employ. These broader courses of action or approaches will help achieve the objective.
Dive deeper with tactics: Under each strategy, list out the tactics. These are specific actions or methods you will undertake to execute your strategy.
Define and attach KPIs: For every tactic, set measurable KPIs that will help you track the progress and effectiveness of that specific tactic. KPIs should be clear, quantifiable, and directly linked to the tactic it's measuring.
Throughout the process, use Miro's automated diagramming feature to quickly expand your KPI tree components by clicking on the shapes and selecting the blue dots to add more.
KPI Tree Template FAQs
Can multiple people collaborate on the KPI Tree Template in real time?
Yes, Miro allows for real time collaboration, ensuring team members can work on the template simultaneously, share ideas, and make instantaneous updates.
Is the KPI Tree Template customizable?
Yes, the template is fully customizable. You can adjust colors, fonts, and even the structure to better fit your organization's branding and preferences.
Can I link external data or documents to the KPIs in the template?
Certainly! Miro supports linking to external resources, allowing you to provide more detailed insights or references directly from your KPI Tree.
What should I do if I run out of space while expanding my KPI Tree?
No worries! Miro's automated diagramming features enable you to enlarge the tree easily. If a section grows too extensive, you can effortlessly adjust and reorganize it to make room for additional information.

Miro
Your virtual workspace for innovation
Miro is an innovation workspace designed for teams of every size, everywhere, to dream, design, and build the future together. Our mission? To empower these teams to create the next big thing, powered by AI at every step of the way. Over 90 million users around the world rely on Miro to untangle complex ideas, put customer needs first, and deliver products and services faster. All supported by best-in-class security, compliance, and scalability.
Categories
Similar templates
Problem Tree Template
Problem Tree Template
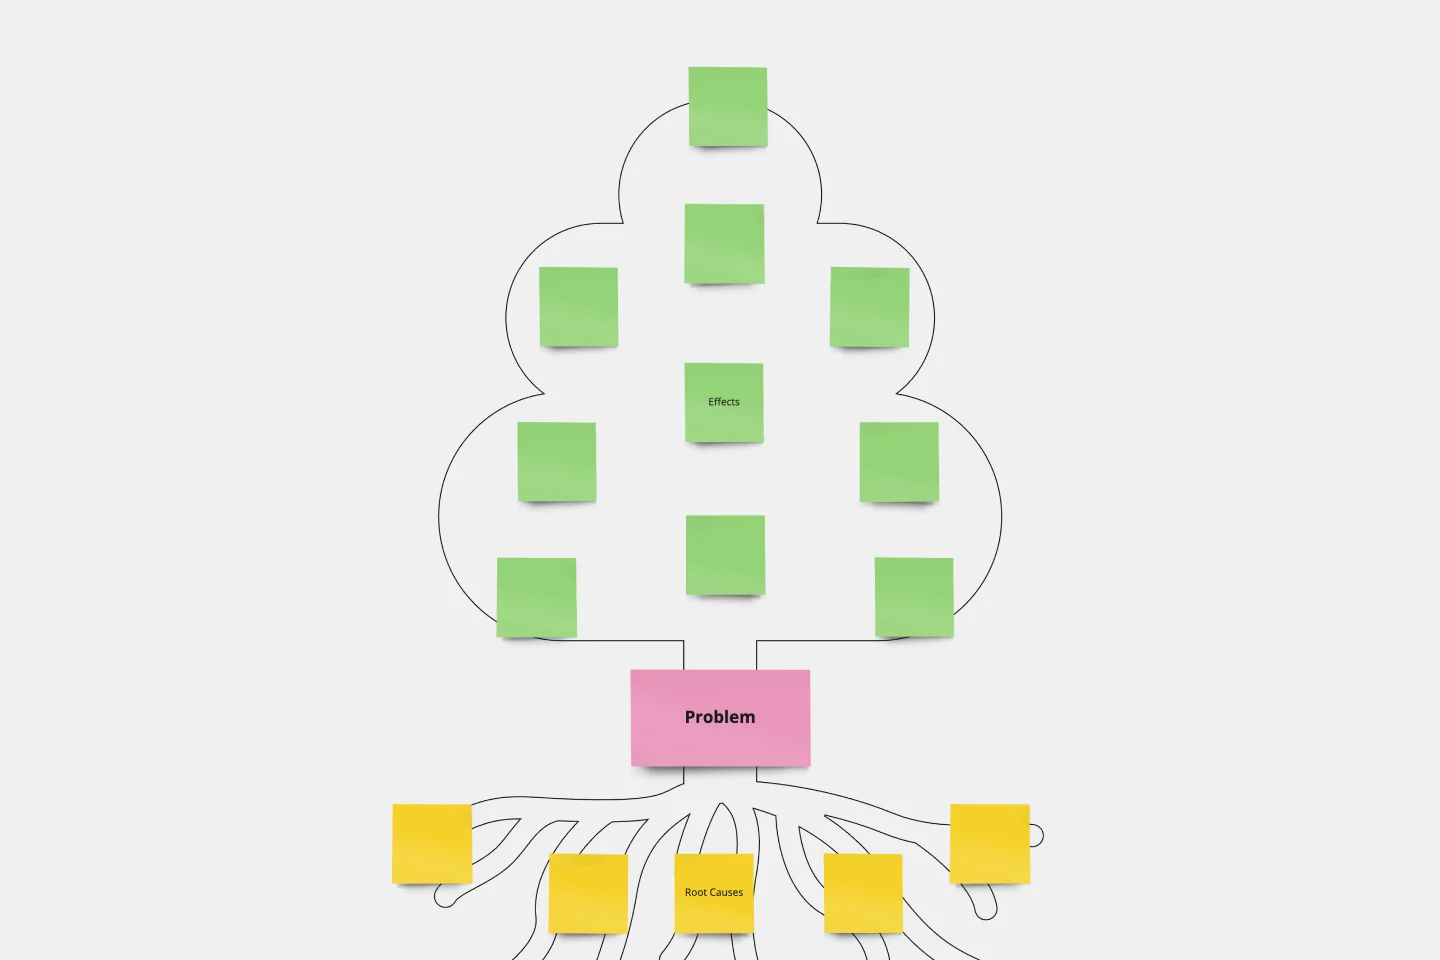
The Problem Tree Template is a visual tool crafted to examine a primary issue, its consequential effects, and its foundational causes. Picture it: The tree's trunk embodies the central dilemma, its branches display the direct ramifications, and the roots delve into the underlying reasons. By organizing a challenge in such an illustrative manner, users can comprehensively grasp their situation.
Opportunity Solution Tree Template
Opportunity Solution Tree Template
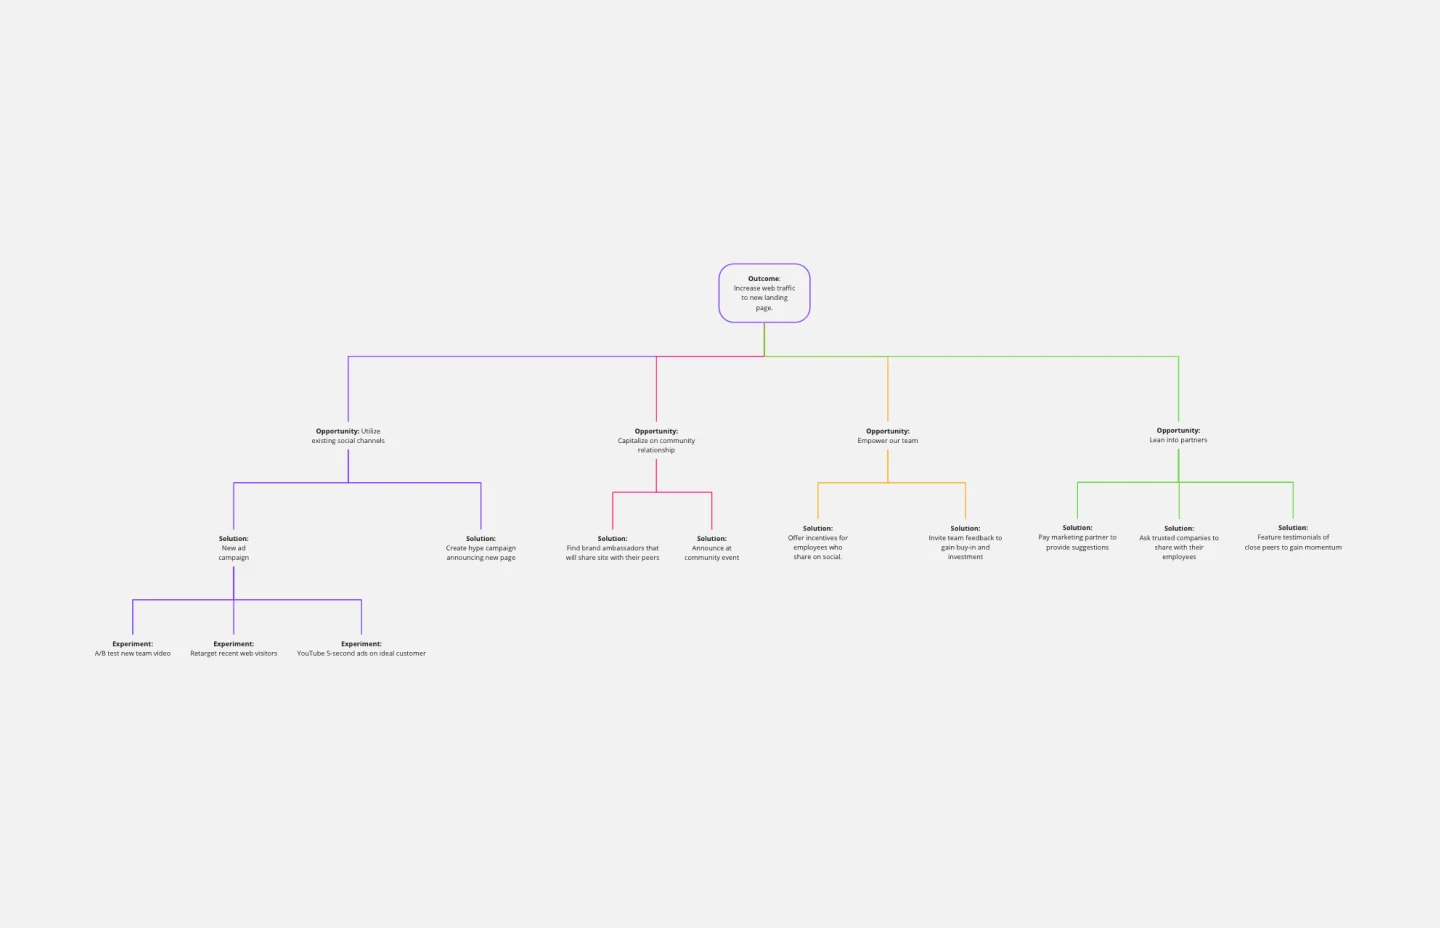
Solving problems — successful companies and productive teams just know how to do it. They’re able to identify many possible solutions, then settle on the one that leads to the desired outcome. That’s the power an Opportunity Solution Tree gives you. Designed by Teresa Torres, a product discovery coach, this mind map breaks down your desired outcome into opportunities for the product to meet user needs, then gives your team an effective way to brainstorm potential solutions.
Decision Tree Template
Decision Tree Template
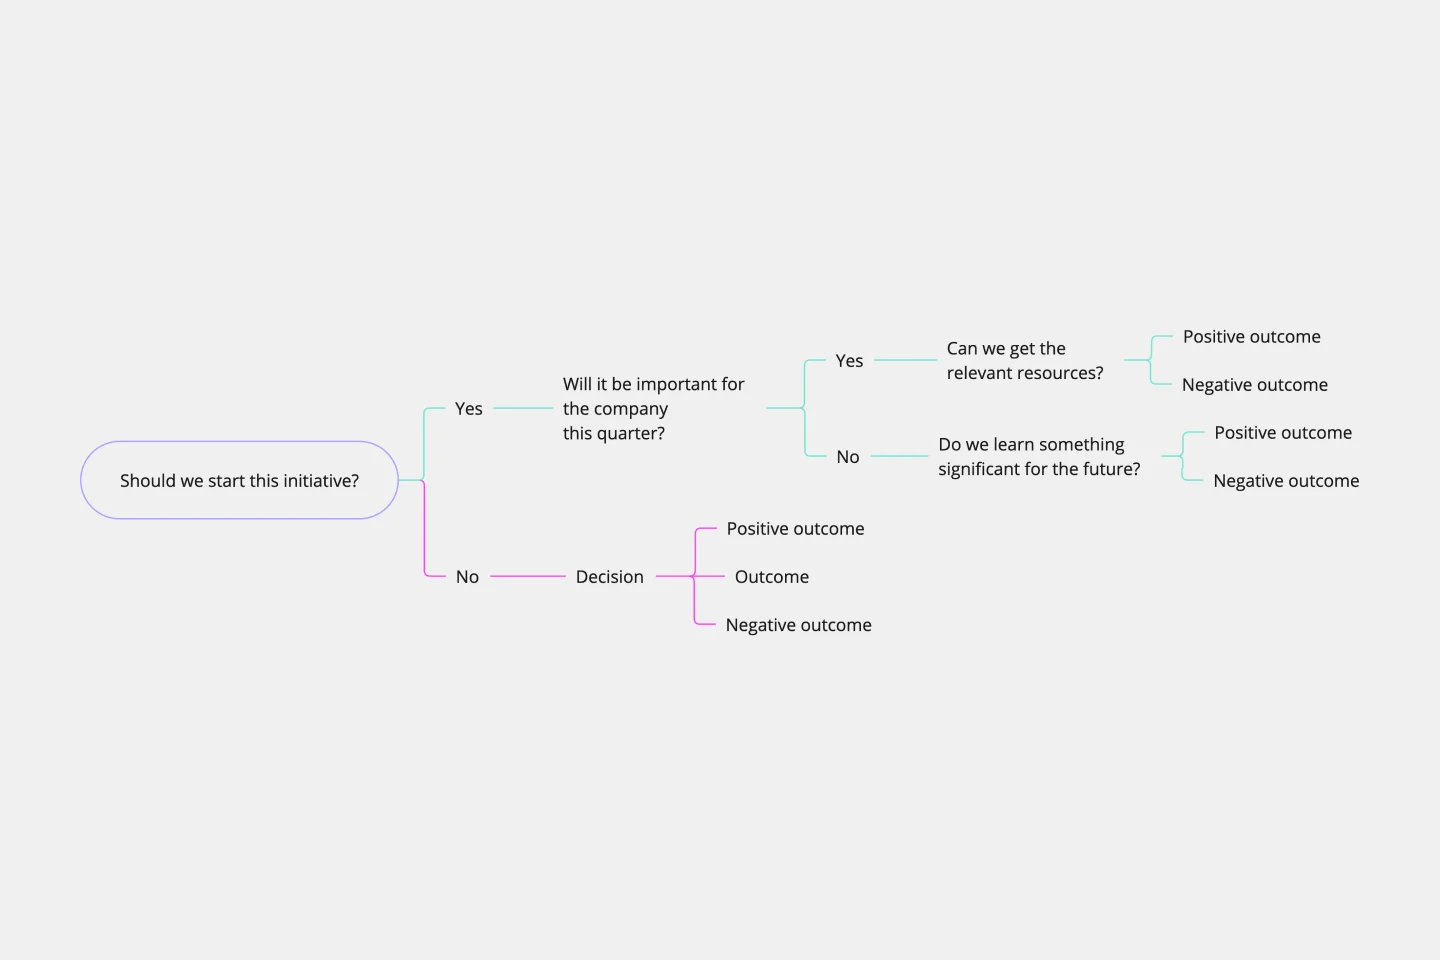
Making difficult decisions gets easier when you can look clearly at your choices and visualize the outcomes. That’s just what a decision tree will help you do, empowering you to invest your time and money with confidence. A decision tree is a flowchart that looks just how you’d imagine—with “branches” that represent your available choices. It provides a stylized way to play out a series of decisions and see where they lead before you commit your real-world resources, which is especially valuable for startups and smaller companies.
Family Tree Template
Family Tree Template
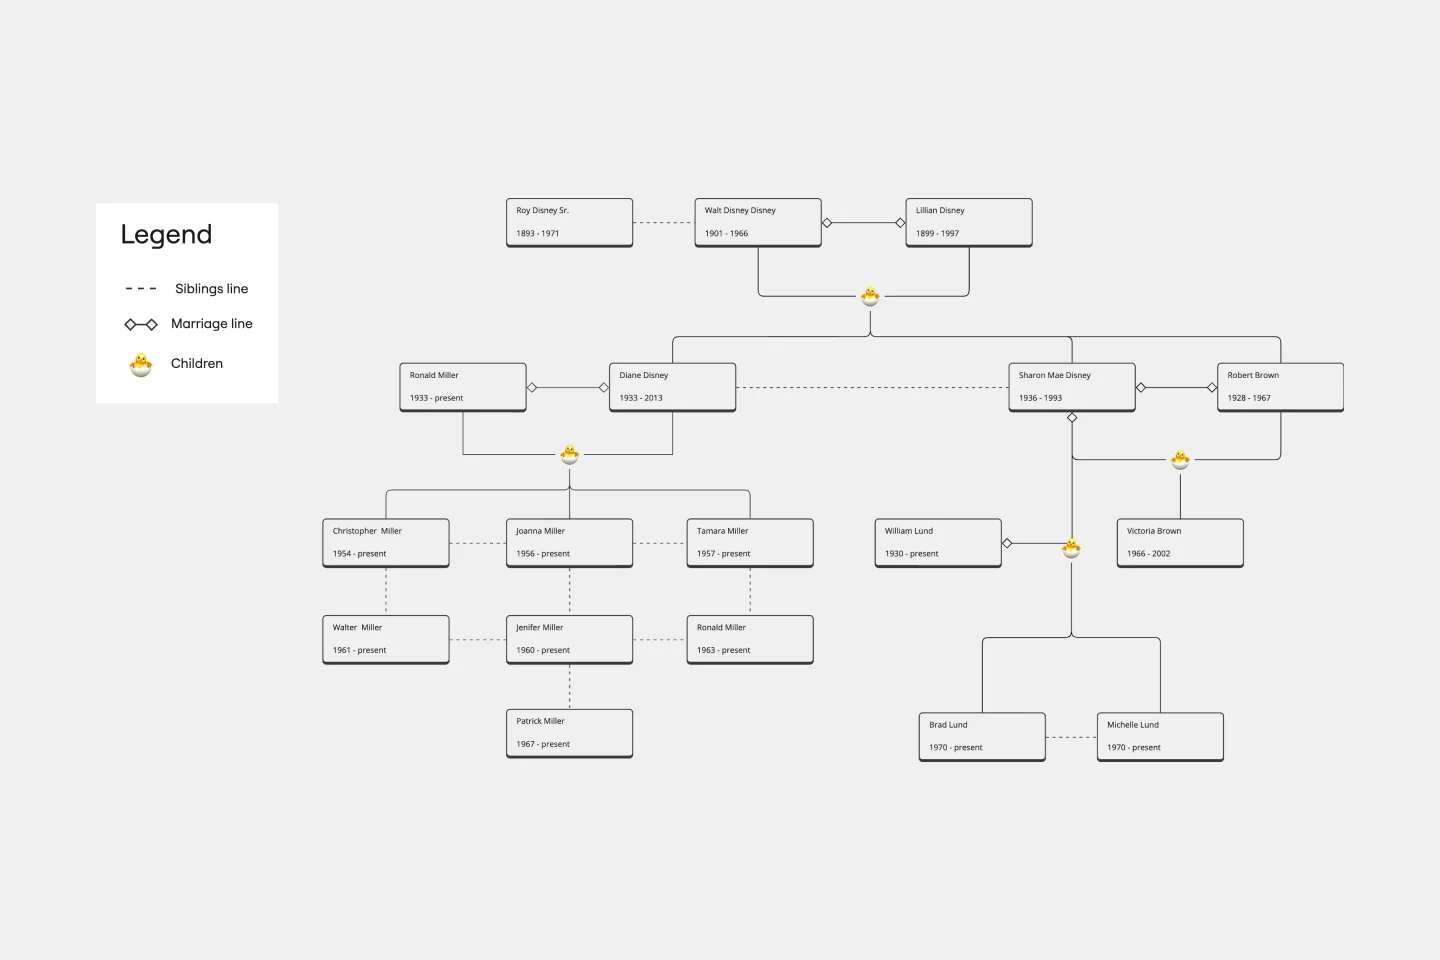
Family trees help you make sense of complicated family relationships, even generations back. With this Family Tree Template, you can quickly and easily add your siblings, parents, and extended family members. Plus, add extra information, notes, and even images to create a vibrant family tree.
Prune the Product Tree Template
Prune the Product Tree Template
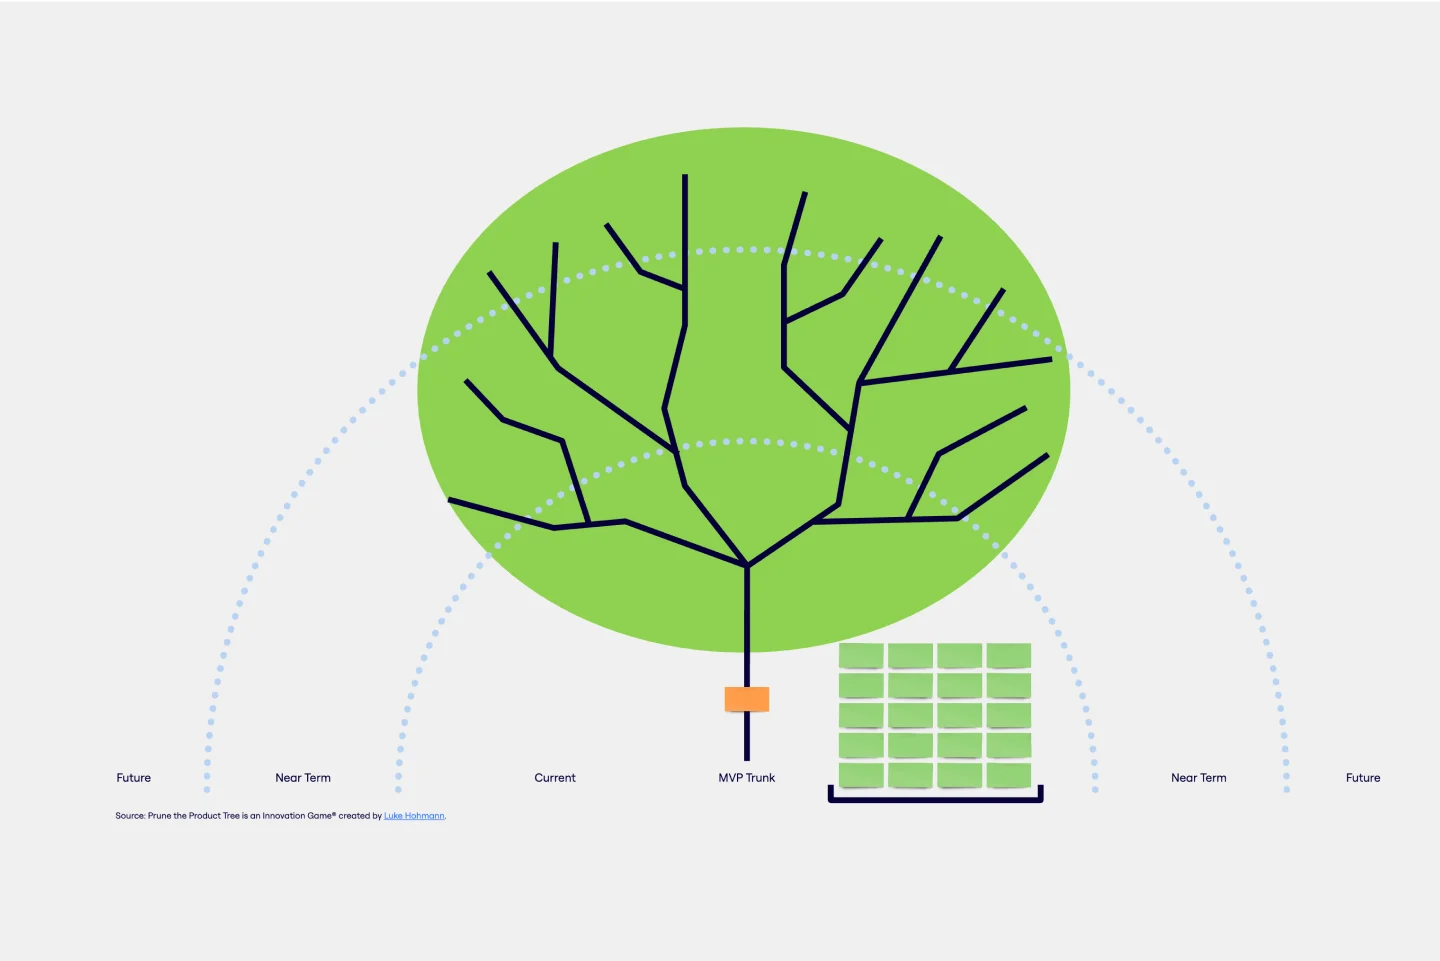
Prune the Product Tree (also known as the product tree game or the product tree prioritization framework) is a visual tool that helps product managers organize and prioritize product feature requests. The tree represents a product roadmap and helps your team think about how to grow and shape your product or service by gamifying feedback-gathering from customers and stakeholders. A typical product tree has four symbolic features: the trunk, which represents the existing product features your team is building; the branches, each of which represents a product or system function; roots, which are technical requirements or infrastructure; and leaves, which are new ideas for product features.
Problem Tree Template
Problem Tree Template
The Problem Tree Template is a visual tool crafted to examine a primary issue, its consequential effects, and its foundational causes. Picture it: The tree's trunk embodies the central dilemma, its branches display the direct ramifications, and the roots delve into the underlying reasons. By organizing a challenge in such an illustrative manner, users can comprehensively grasp their situation.
Opportunity Solution Tree Template
Opportunity Solution Tree Template
Solving problems — successful companies and productive teams just know how to do it. They’re able to identify many possible solutions, then settle on the one that leads to the desired outcome. That’s the power an Opportunity Solution Tree gives you. Designed by Teresa Torres, a product discovery coach, this mind map breaks down your desired outcome into opportunities for the product to meet user needs, then gives your team an effective way to brainstorm potential solutions.
Decision Tree Template
Decision Tree Template
Making difficult decisions gets easier when you can look clearly at your choices and visualize the outcomes. That’s just what a decision tree will help you do, empowering you to invest your time and money with confidence. A decision tree is a flowchart that looks just how you’d imagine—with “branches” that represent your available choices. It provides a stylized way to play out a series of decisions and see where they lead before you commit your real-world resources, which is especially valuable for startups and smaller companies.
Family Tree Template
Family Tree Template
Family trees help you make sense of complicated family relationships, even generations back. With this Family Tree Template, you can quickly and easily add your siblings, parents, and extended family members. Plus, add extra information, notes, and even images to create a vibrant family tree.
Prune the Product Tree Template
Prune the Product Tree Template
Prune the Product Tree (also known as the product tree game or the product tree prioritization framework) is a visual tool that helps product managers organize and prioritize product feature requests. The tree represents a product roadmap and helps your team think about how to grow and shape your product or service by gamifying feedback-gathering from customers and stakeholders. A typical product tree has four symbolic features: the trunk, which represents the existing product features your team is building; the branches, each of which represents a product or system function; roots, which are technical requirements or infrastructure; and leaves, which are new ideas for product features.