
Innovation Diagram_S.PSS
Create an innovation diagram easily thanks to this template.
Aims
The objective of the Innovation Diagram_S.PSS is to
position and characterize existing offers;
map competitors strategic positioning;
select promising system sustainability ideas and help achieve a newconcepts profiling.
What it consists of
polarity diagram + concept profiler
digital post-it (one colour)
a repository of labels
This template was created by LeNSlab Polimi.
Get started with this template right now.
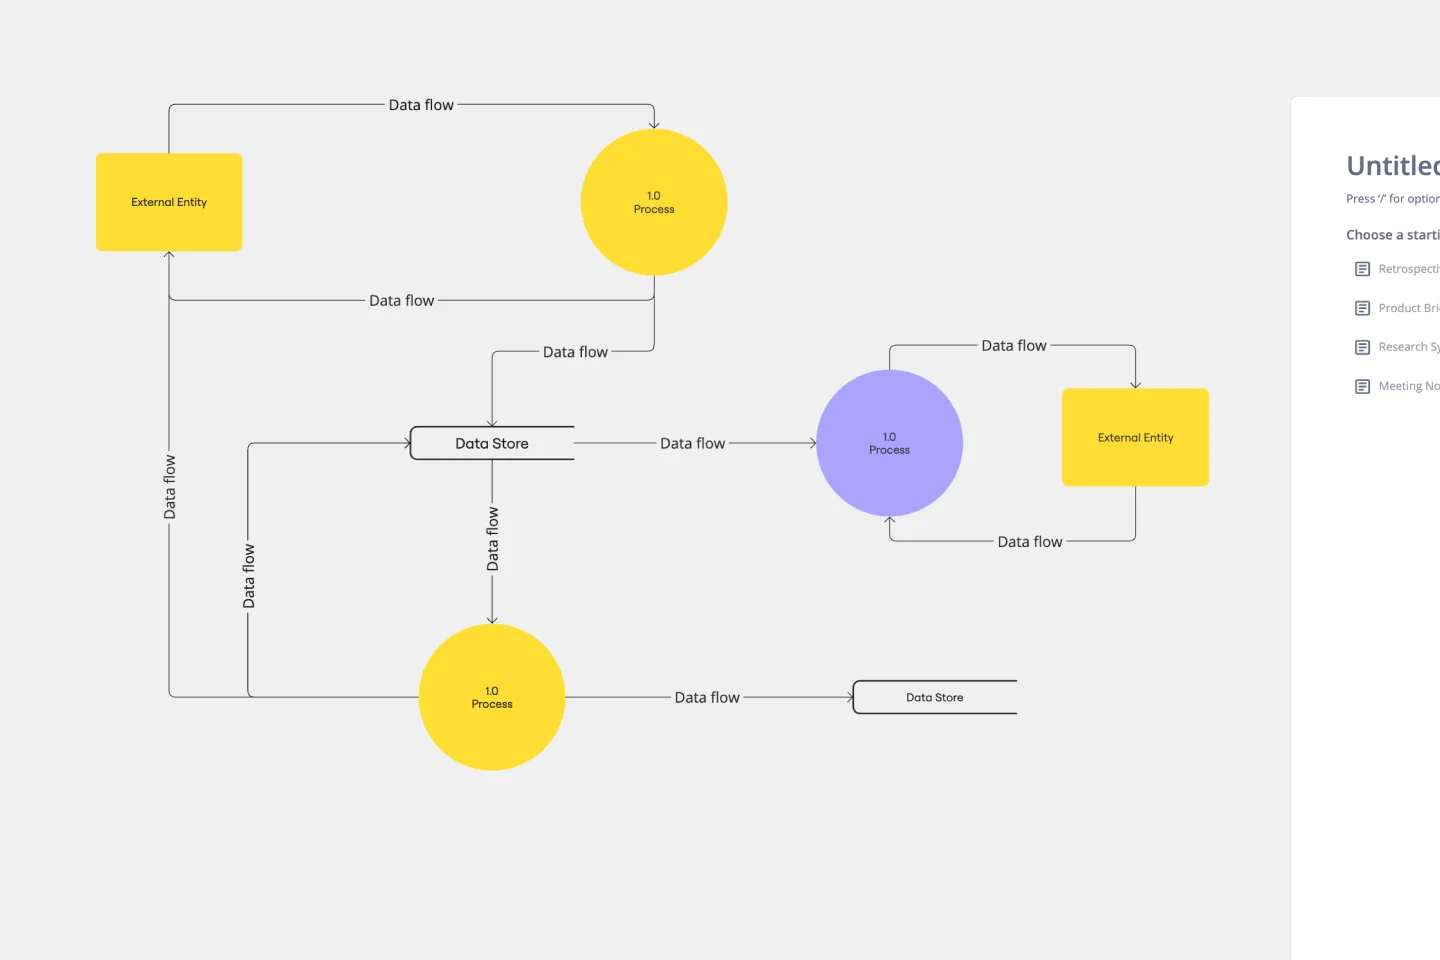
Data Flow Diagram Template
Works best for:
Flowcharts, Software Development, Diagrams
Any process can get pretty complex, especially when it has multiple components. Get a better grasp of your process through a data flow diagram (DFD). DFDs create a simple visual representation of all components in the flow of data and requirements in an entire system. They’re most often used by growth teams, data analysts, and product teams, and they’re created with one of three levels of complexity—0, 1, or 2. This template will help you easily build the best DFD for your process.
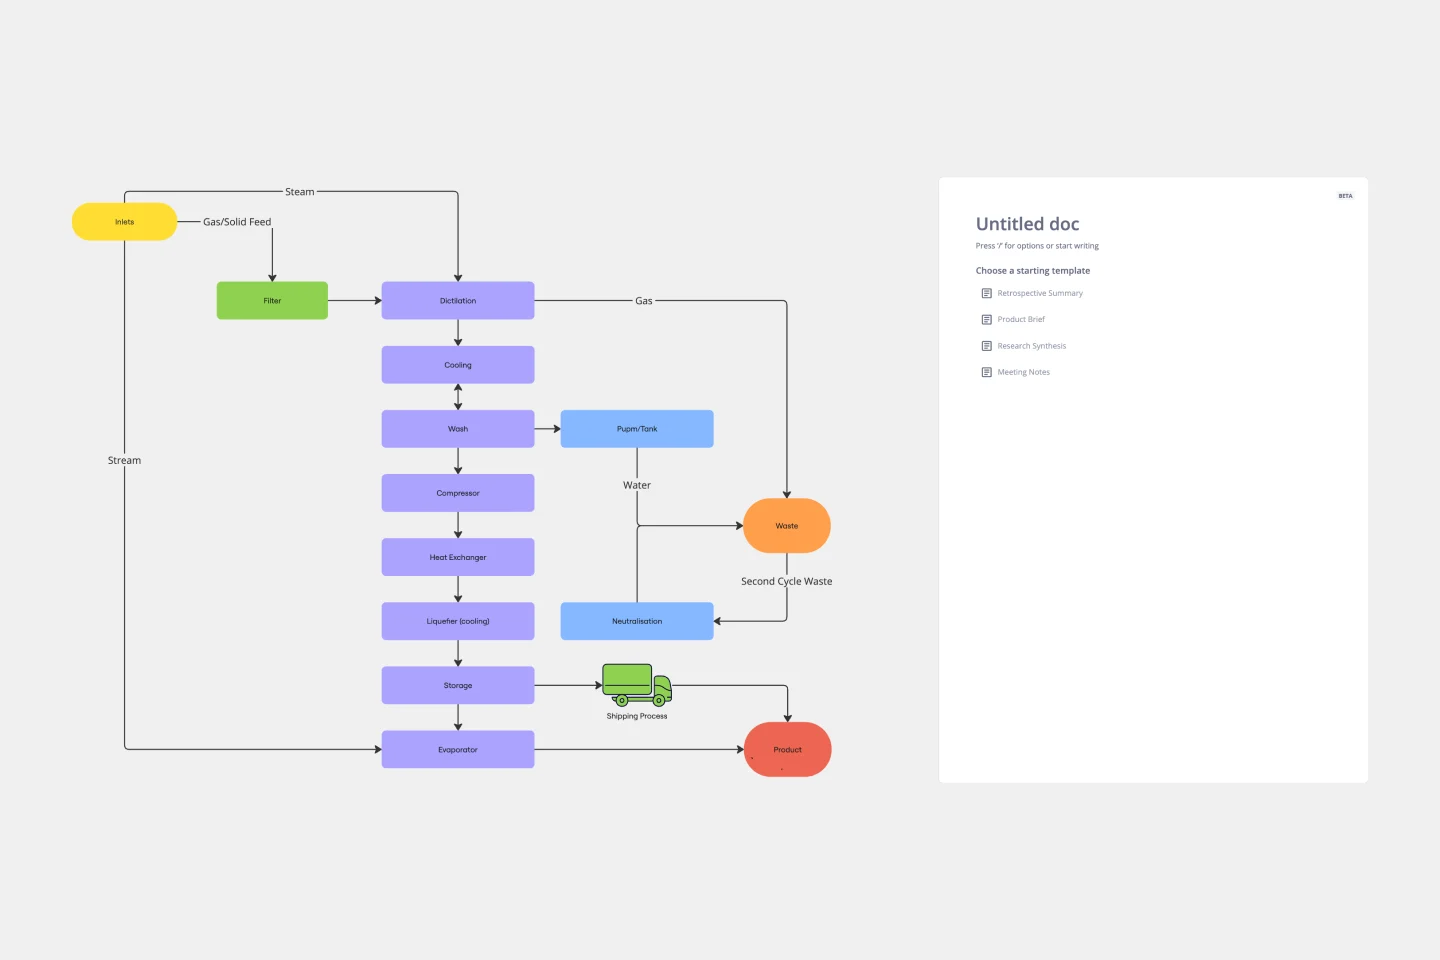
Block Diagram Template
Works best for:
Mapping, Software Development, Diagrams
Use this template to illustrate technical systems. Blocks represent important objects in the system, and arrows demonstrate how the objects relate to each other. Perfect for engineers, workflow managers, or anyone trying to build a better process.
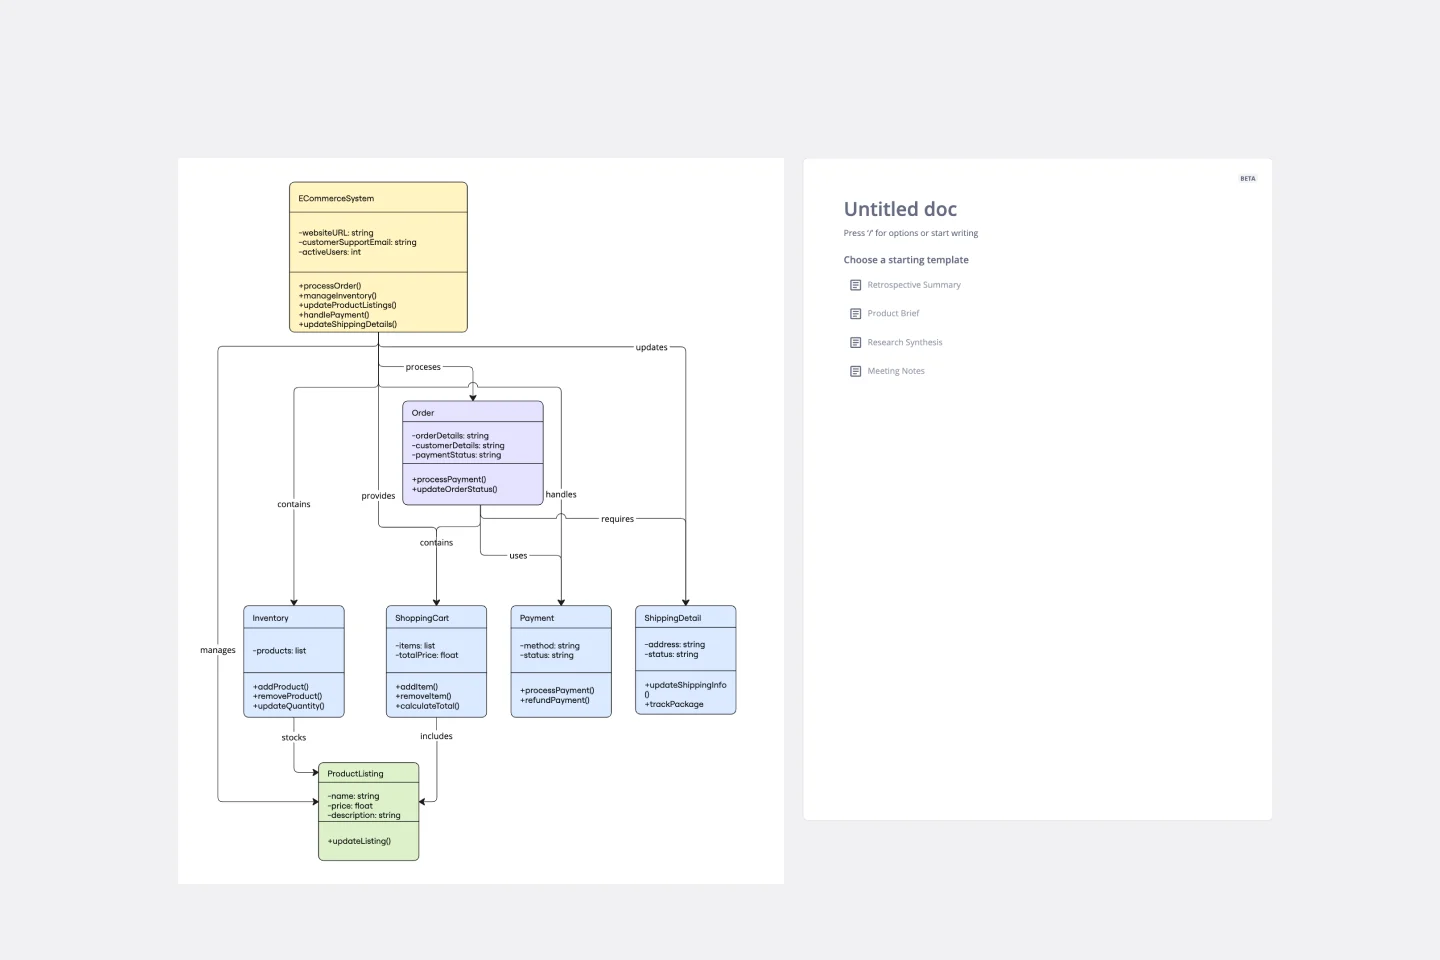
UML Class E-Commerce System Template
Works best for:
UML
The UML Class E-Commerce System Template streamlines the process of creating and visualizing the class structure of an e-commerce system. It provides a comprehensive framework that includes typical online shop features such as product listings, inventory management, shopping carts, orders, payments, and shipping details. This template facilitates a clear understanding of how these elements interact during an online sales transaction, making it an invaluable tool for teams working on e-commerce projects. By using this template, teams can save time, enhance collaboration, and ensure that their system architecture is robust and efficient, ready to adapt to their business's evolving needs.
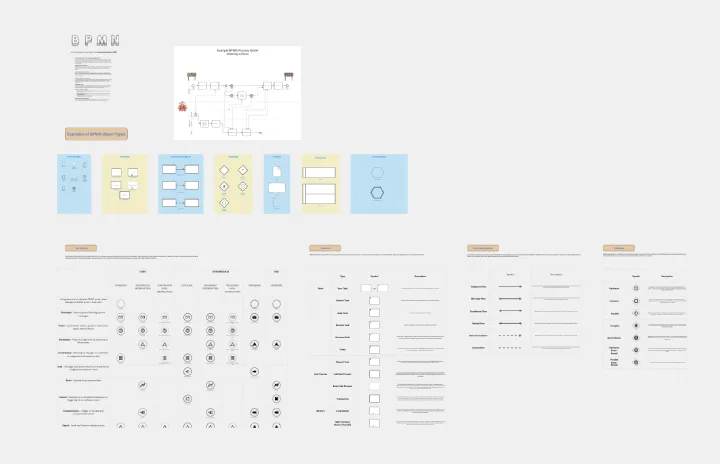
Comprehensive Guide to BPMN
Works best for:
BPMN, Diagramming
Tame the Workflow Beast: Your Visual Guide to BPMN with Miro!
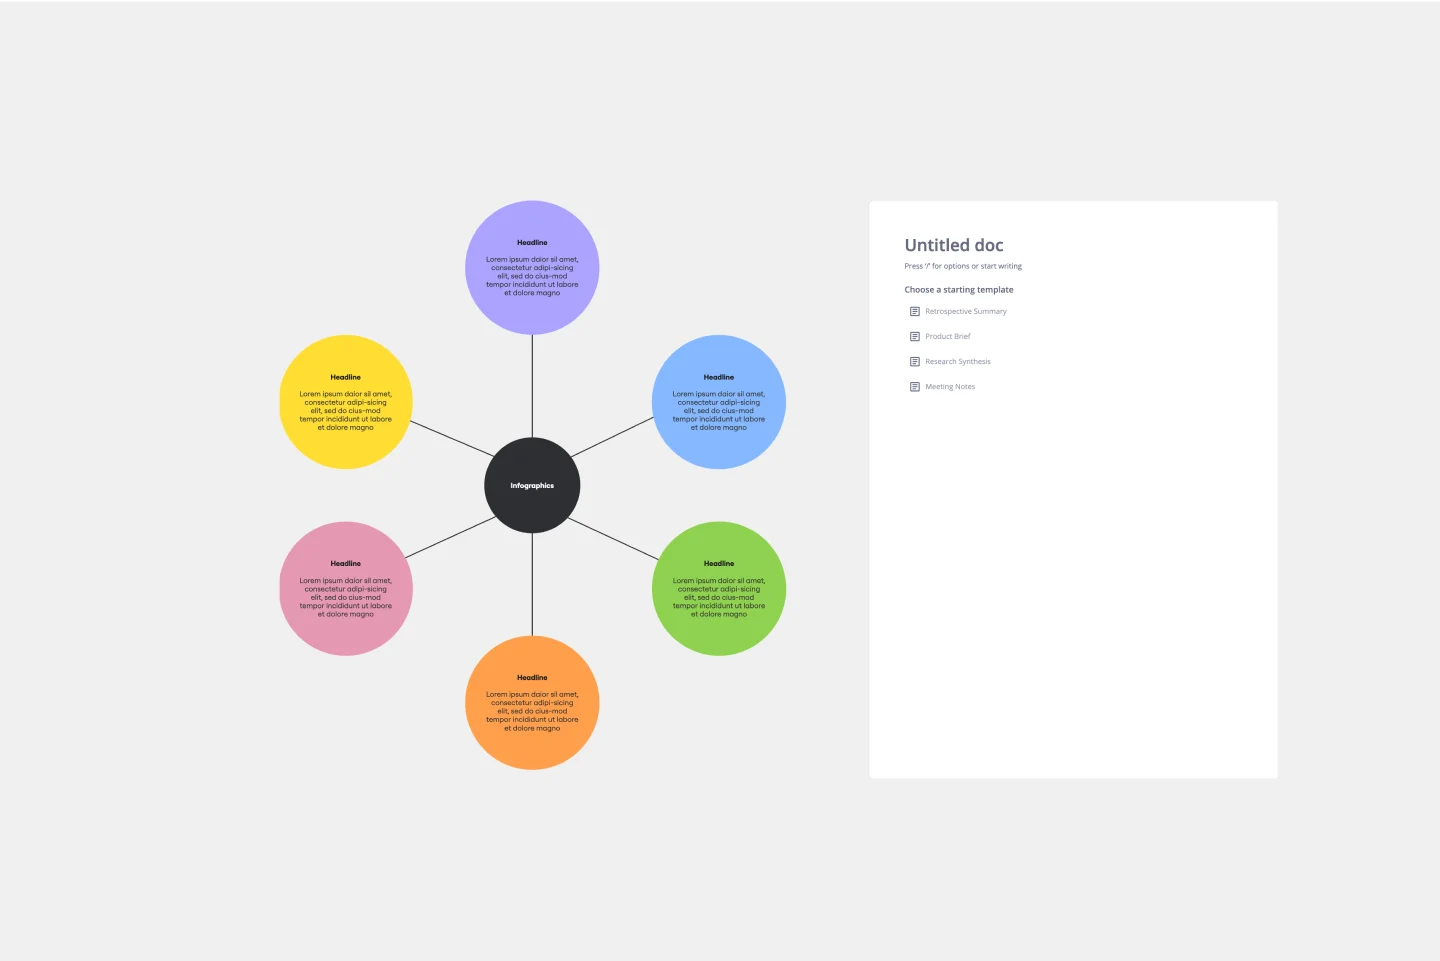
Web Diagram Template
Miro's Web Diagram Template simplifies complex project organization and promotes effective communication. It allows users to easily connect elements and gain a comprehensive understanding of complex relationships, making it a versatile and invaluable asset for diverse projects.
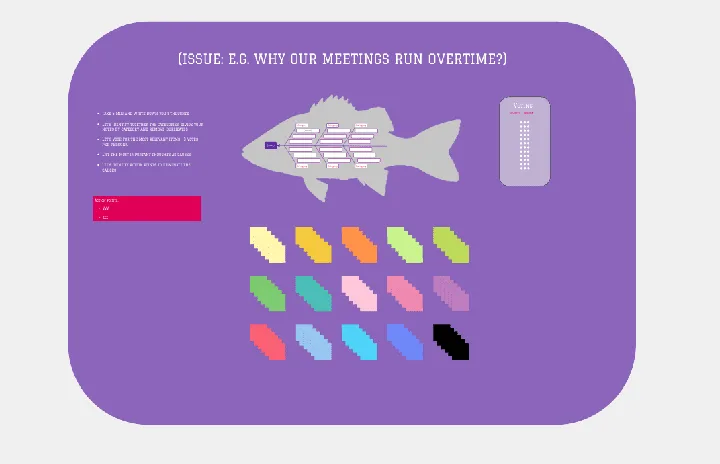
Fishbone Diagram by Hanna Havulinna
Works best for:
Diagramming
The Fishbone Diagram template, also known as the Ishikawa or Cause-and-Effect diagram, offers a visual tool for identifying and analyzing root causes of problems or issues. It provides a structured framework for categorizing potential causes into major categories such as people, process, environment, and equipment. This template enables teams to conduct root cause analysis systematically, facilitating problem-solving and decision-making. By promoting a structured approach to problem analysis, the Fishbone Diagram empowers teams to address issues effectively and implement corrective actions efficiently.