About the ICS Org Chart Template
In today's work environment, having tools that provide flexibility and clarity is crucial, particularly when it comes to coordinating teams and ensuring seamless communication. The ICS Org Chart Template is an excellent solution in this regard. ICS, which stands for Incident Command System, is a standardized all-hazard incident management concept used in the United States. It is a complex system that demands careful organization and structure.
The ICS Org Chart Template is specifically designed to help teams understand the structure of this system. It provides a clear and visual representation of roles, responsibilities, and chains of command, making it an invaluable tool for any organization.
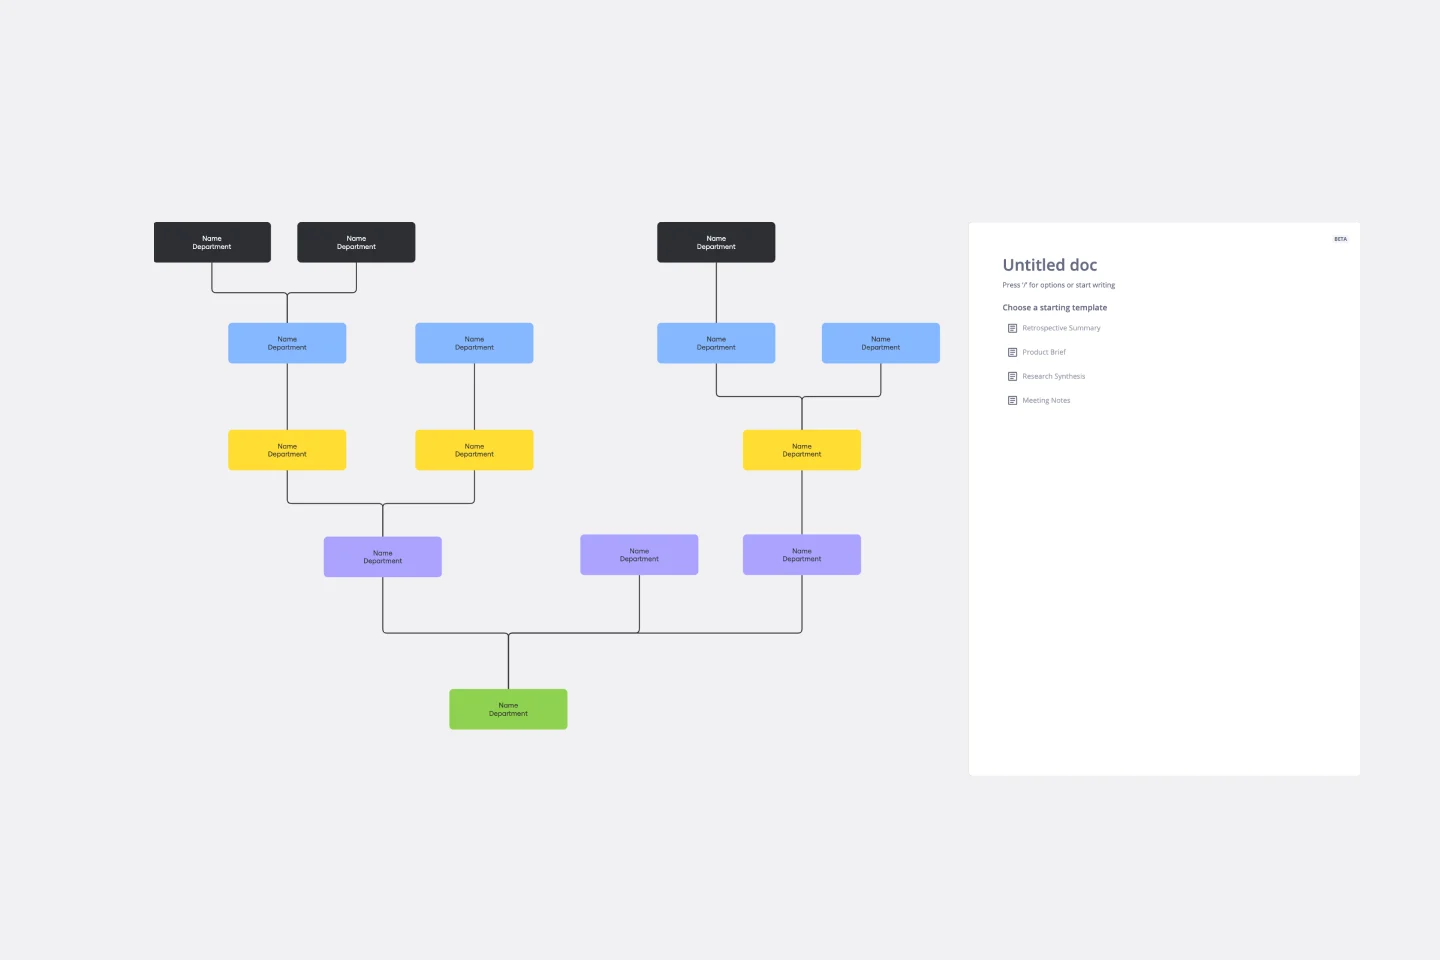
This template offers a structured blueprint of the ICS hierarchy, which can be easily customized per the user's requirements. Each section of the template represents a specific area of responsibility within the ICS, and the sections are connected via connector lines to show the flow of command and reporting lines. With clearly defined roles for each position, from the Incident Commander to the various branches and units, users can navigate the complex ICS web with ease and make necessary modifications according to their specific needs.
How to use the ICS Org Chart Template
Customize the template: Click on any shape or connector line. You'll notice that editing them is straightforward—resize, relabel, or reposition as needed.
Expand: If your organizational structure requires more layers or units, add more shapes and connect them using the automated diagramming features. This ensures consistency in design and flow.
Add context: To provide more detailed information, you can effortlessly drag and drop any artifact onto the board. Whether it's a document, image, or link, it integrates seamlessly, enriching the context.
Why should you use an ICS Org Chart Template?
Clarity and visualization: It provides a clear and visual representation of roles and reporting lines, ensuring that everyone understands their responsibilities and who they should report to.
Standardization: It maintains consistency in the representation of the ICS structure, which is essential for effective communication.
Flexibility: Although it offers a standardized view, the template is highly customizable to cater to various organizational needs.
Efficiency: It reduces the time spent on creating an organizational chart from scratch and ensures rapid onboarding of team members for efficient task execution.
Integration: It allows easy addition of external resources, ensuring a comprehensive view of processes and responsibilities.
Miro is the perfect organizational chart builder to help visualize and understand your organization's hierarchical structure and reporting lines between roles. If you're interested in learning more about organizational charts you can read our in-depth guide.
ICS Org Chart FAQs
Can I integrate external links and resources into the chart?
The template allows seamless integration of external artifacts, providing a richer context.
How many levels can I add to the chart?
The template is flexible, allowing you to add as many levels as required by your organizational structure.
Is the template suitable for organizations outside the U.S.?
While the ICS system originates from the U.S., the principles of organization and structure are universal. The template can be adapted and used by organizations globally.
Do I need prior knowledge of ICS to use this template?
While prior knowledge is helpful, the template is intuitive enough for those unfamiliar with ICS, serving as both a learning tool and an organizational asset.

Miro
Your virtual workspace for innovation
Miro is an innovation workspace designed for teams of every size, everywhere, to dream, design, and build the future together. Our mission? To empower these teams to create the next big thing, powered by AI at every step of the way. Over 90 million users around the world rely on Miro to untangle complex ideas, put customer needs first, and deliver products and services faster. All supported by best-in-class security, compliance, and scalability.
Categories
Similar templates
Inverted Org Chart Template
Inverted Org Chart Template
The Inverted Org Chart Template is a tool that reimagines the traditional hierarchical model by placing frontline employees at the top of the organizational structure. This innovative approach highlights the crucial role played by those who interact with customers directly, ensuring that their insights and contributions are not only recognized but also celebrated. One of the key advantages of this template is that it fosters a feedback-driven environment. Prioritizing frontline workers promotes a culture where valuable insights from the ground can quickly reach the top of the hierarchy, streamlining decision-making processes and ensuring that strategies are based on real-world experiences.
Partnership Org Chart Template
Partnership Org Chart Template
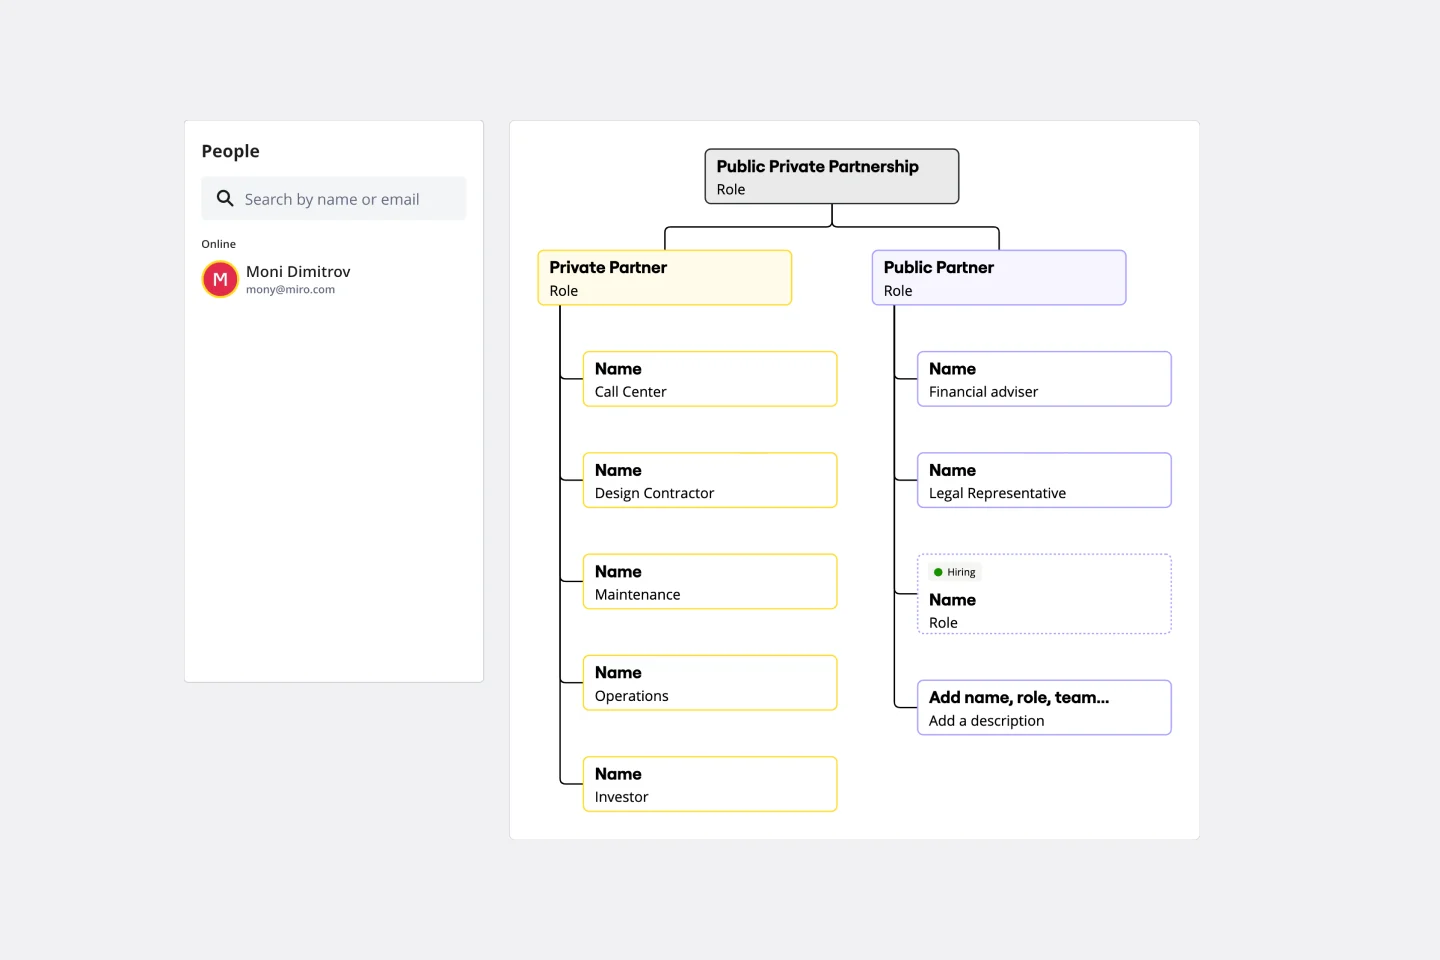
The Partnership Org Chart Template is an interactive tool that visually represents the intricate network of relationships between business partners. It provides a clear and structured layout that helps users grasp how different entities align and interact within a collaborative ecosystem. One of its standout benefits is the clarity it offers. In the often complex world of inter-organizational relationships, having a straightforward, visual representation of partnerships eliminates ambiguities and ensures all stakeholders are on the same page. This fosters more effective collaboration and strategic planning, making it an essential business tool.
Vertical Organizational Chart
Vertical Organizational Chart
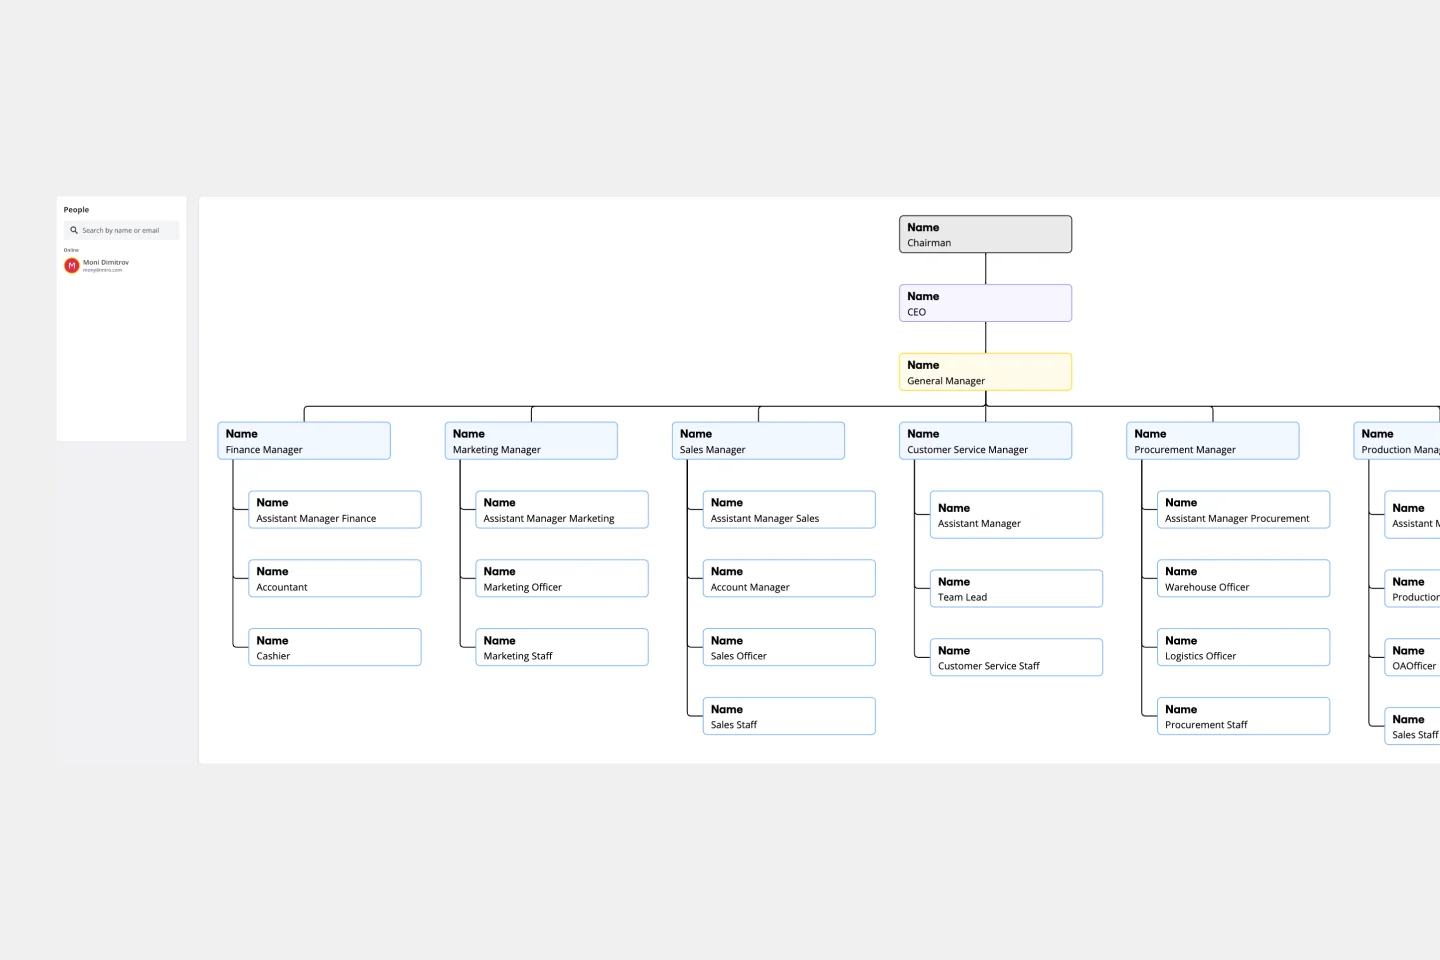
The Vertical Organizational Chart Template is an efficient way to illustrate the hierarchy of an entity in a top-down format. This tool helps represent roles and relationships in a clear manner, starting from the topmost authority and branching downwards. It allows for a better understanding of the flow of responsibilities and communication channels within the organization. One of its most significant advantages is promoting clear communication. Depicting the organization's structure helps avoid misunderstandings and ensures everyone is on the same page regarding the chain of command.
Flat Org Chart Template
Flat Org Chart Template
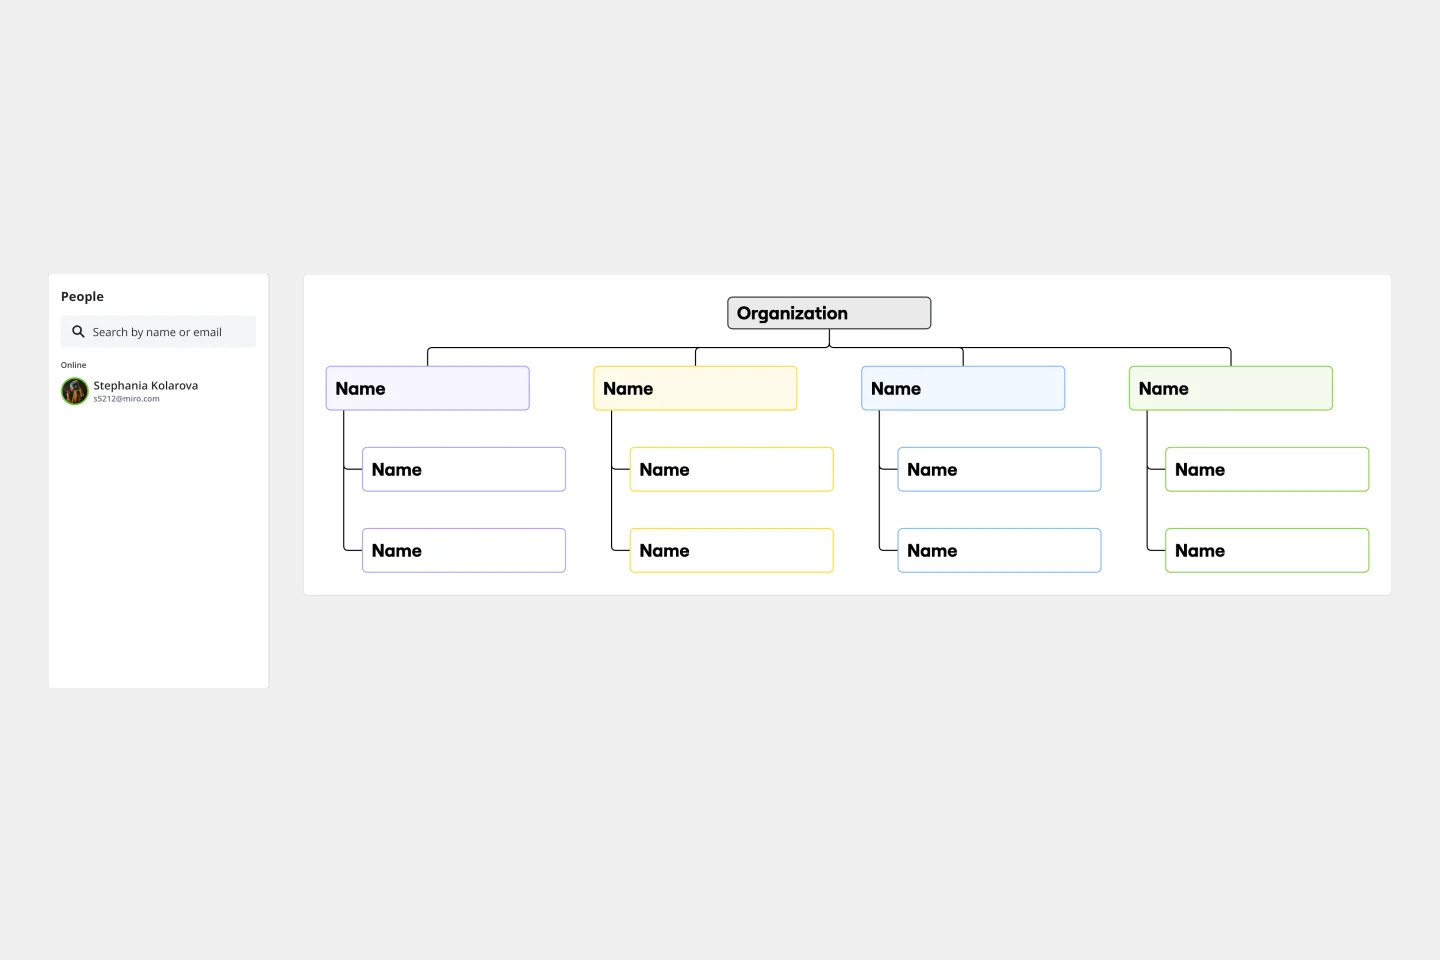
The flat org chart template provides a clear and visual representation of modern organizational structures that prioritize collaboration and horizontal relationships over complex hierarchical chains of command. One of the major advantages of using this template is that it promotes clarity and transparency, making it easy for organizations to showcase team configurations and ensure that all team members understand their roles in the larger context. This clarity fosters a more inclusive and collaborative environment, which aligns perfectly with contemporary organizational values. The template is a great tool for promoting effective communication and teamwork.
Matrix Org Chart
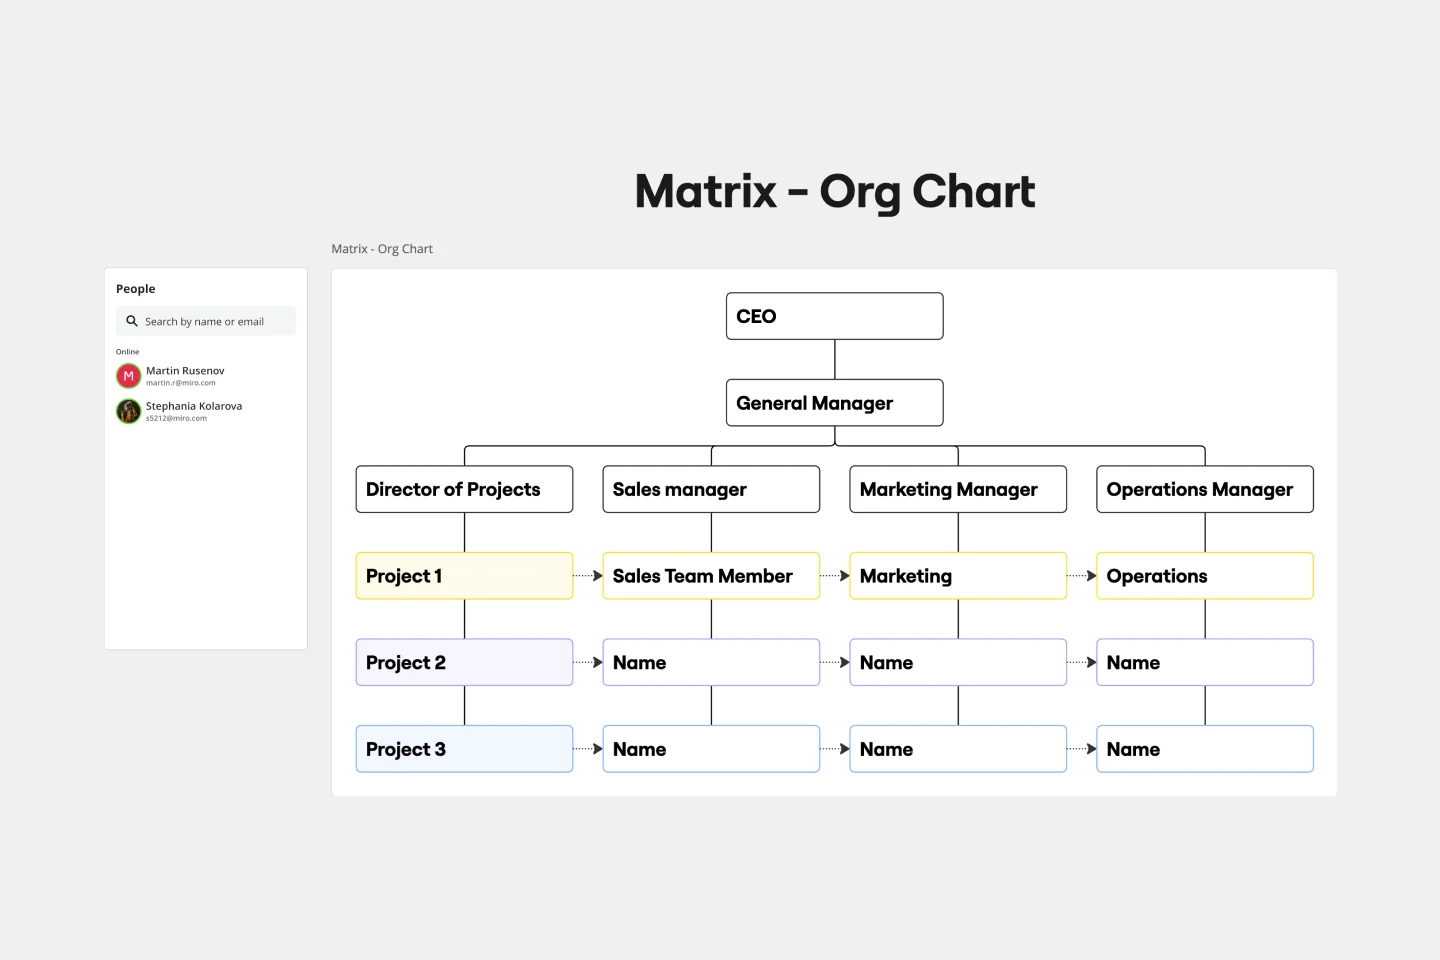
Matrix Org Chart
The matrix org chart template organizes teams efficiently and promotes effective communication. It is an essential tool for businesses that require complex decision-making capabilities and rapid response times. With this template, people can easily visualize their roles, responsibilities, and relationships within the organization, leading to improved alignment and performance.
Accountability Chart Template
Accountability Chart Template
The Accountability Chart Template is a visual map detailing the various roles within an organization and the responsibilities tied to each. This systematic layout ensures clarity in defining duties and fosters a culture of accountability. A standout benefit of using this template is its capacity to eliminate role ambiguity. The Accountability Chart template ensures that every team member understands tasks by clearly depicting who is responsible for what. This leads to enhanced productivity and reduced task overlaps or missed assignments.
Inverted Org Chart Template
Inverted Org Chart Template
The Inverted Org Chart Template is a tool that reimagines the traditional hierarchical model by placing frontline employees at the top of the organizational structure. This innovative approach highlights the crucial role played by those who interact with customers directly, ensuring that their insights and contributions are not only recognized but also celebrated. One of the key advantages of this template is that it fosters a feedback-driven environment. Prioritizing frontline workers promotes a culture where valuable insights from the ground can quickly reach the top of the hierarchy, streamlining decision-making processes and ensuring that strategies are based on real-world experiences.
Partnership Org Chart Template
Partnership Org Chart Template
The Partnership Org Chart Template is an interactive tool that visually represents the intricate network of relationships between business partners. It provides a clear and structured layout that helps users grasp how different entities align and interact within a collaborative ecosystem. One of its standout benefits is the clarity it offers. In the often complex world of inter-organizational relationships, having a straightforward, visual representation of partnerships eliminates ambiguities and ensures all stakeholders are on the same page. This fosters more effective collaboration and strategic planning, making it an essential business tool.
Vertical Organizational Chart
Vertical Organizational Chart
The Vertical Organizational Chart Template is an efficient way to illustrate the hierarchy of an entity in a top-down format. This tool helps represent roles and relationships in a clear manner, starting from the topmost authority and branching downwards. It allows for a better understanding of the flow of responsibilities and communication channels within the organization. One of its most significant advantages is promoting clear communication. Depicting the organization's structure helps avoid misunderstandings and ensures everyone is on the same page regarding the chain of command.
Flat Org Chart Template
Flat Org Chart Template
The flat org chart template provides a clear and visual representation of modern organizational structures that prioritize collaboration and horizontal relationships over complex hierarchical chains of command. One of the major advantages of using this template is that it promotes clarity and transparency, making it easy for organizations to showcase team configurations and ensure that all team members understand their roles in the larger context. This clarity fosters a more inclusive and collaborative environment, which aligns perfectly with contemporary organizational values. The template is a great tool for promoting effective communication and teamwork.
Matrix Org Chart
Matrix Org Chart
The matrix org chart template organizes teams efficiently and promotes effective communication. It is an essential tool for businesses that require complex decision-making capabilities and rapid response times. With this template, people can easily visualize their roles, responsibilities, and relationships within the organization, leading to improved alignment and performance.
Accountability Chart Template
Accountability Chart Template
The Accountability Chart Template is a visual map detailing the various roles within an organization and the responsibilities tied to each. This systematic layout ensures clarity in defining duties and fosters a culture of accountability. A standout benefit of using this template is its capacity to eliminate role ambiguity. The Accountability Chart template ensures that every team member understands tasks by clearly depicting who is responsible for what. This leads to enhanced productivity and reduced task overlaps or missed assignments.