
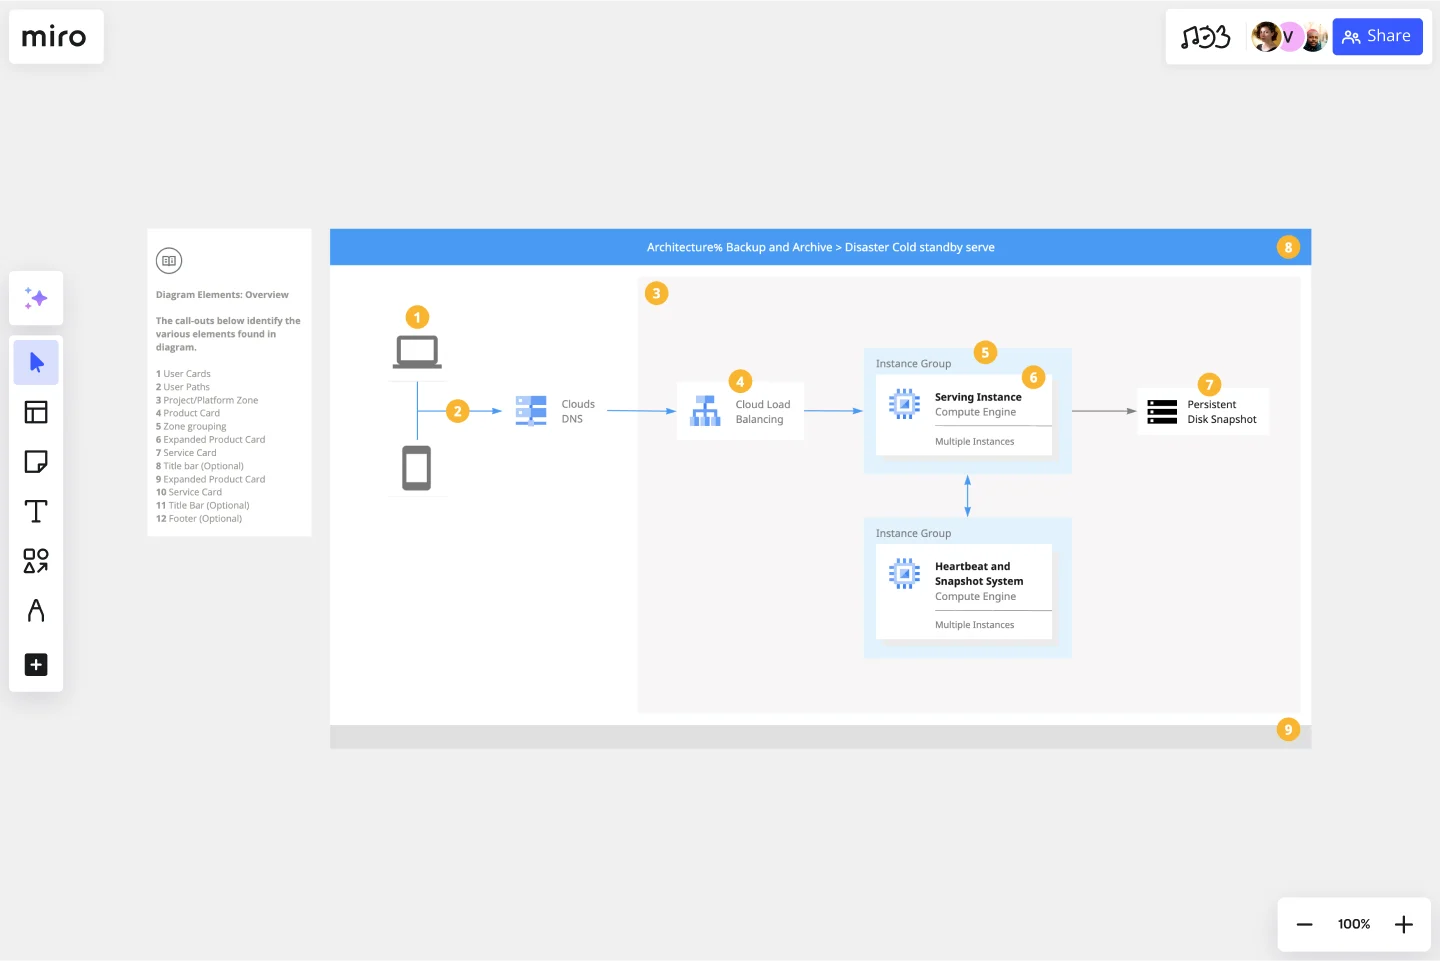
Google Cloud Architecture Diagram Template
Visualize the deployment of your applications with Google Cloud Architecture Diagram template and optimize your processes.
Available on Enterprise, Business, Education plans.
About the Google Cloud Architecture Diagram Template
A Google Cloud Architecture Diagram template is where you can visually represent and manage application development, deployment, and documentation. You can use this Google Cloud Architecture Diagram template to stay in sync with your team, have an excellent application architecture overview, and quickly iterate if needed.
Keep reading to learn more about the Google Cloud Architecture Diagram Template.
GCP Architecture diagram for network optimization
Developers and IT managers use the Google Cloud Architecture Diagram template to make changes and accurately document the network infrastructure.
The GCP Architecture Diagram also allows people to quickly understand your Google Cloud architecture’s network design and operation, facilitating communication across your organization.
How do I create a Google Cloud Architecture Diagram template?
A Google Cloud Architecture Diagram template allows you to visualize the management of apps.
To create a basic Google Cloud Architecture Diagram template with Miro, you can follow these steps:
List your Google Cloud Architecture components, using our set of Google Cloud Icons.
Organize your diagram by adding in the components of the network.
Add connection lines between the component shapes and set the arrows in the direction of the flow.
Format and customize your Google Cloud Architecture Diagram template with shapes and frames.
In Miro, you can quickly build a GCP Diagram from scratch using our design tools and icons set, or use our Google Cloud Architecture Diagram template and customize it as you see fit.
Other than Google Cloud Platform (GCP), Miro has icons for AWS, Azure, Cisco, and many more, making Miro the perfect cloud and network diagramming tool for you and your team.
What is Google Cloud Platform used for?
The Google Cloud Platform is used to make network management and development of network infrastructure accessible and flexible, allowing organizations to create cloud-native apps and manage and analyze data quickly. The Google Cloud Platform helps you navigate many services categories from computer networks to storage and database.
How do I draw a Google cloud architecture?
There are many ways you can draw a Google Cloud Architecture Diagram with Miro. You can either use our template or draw your GCP diagram from scratch. Follow these steps to draw your Google Cloud Architecture Diagram in Miro: select which GCP icons to use for your diagram from Miro’s Google Cloud Platform component library. Next, use connector lines and other shapes to outline and describe your network, and lastly, add arrows to represent the flow of information.
Get started with this template right now. Available on Enterprise, Business, Education plans.
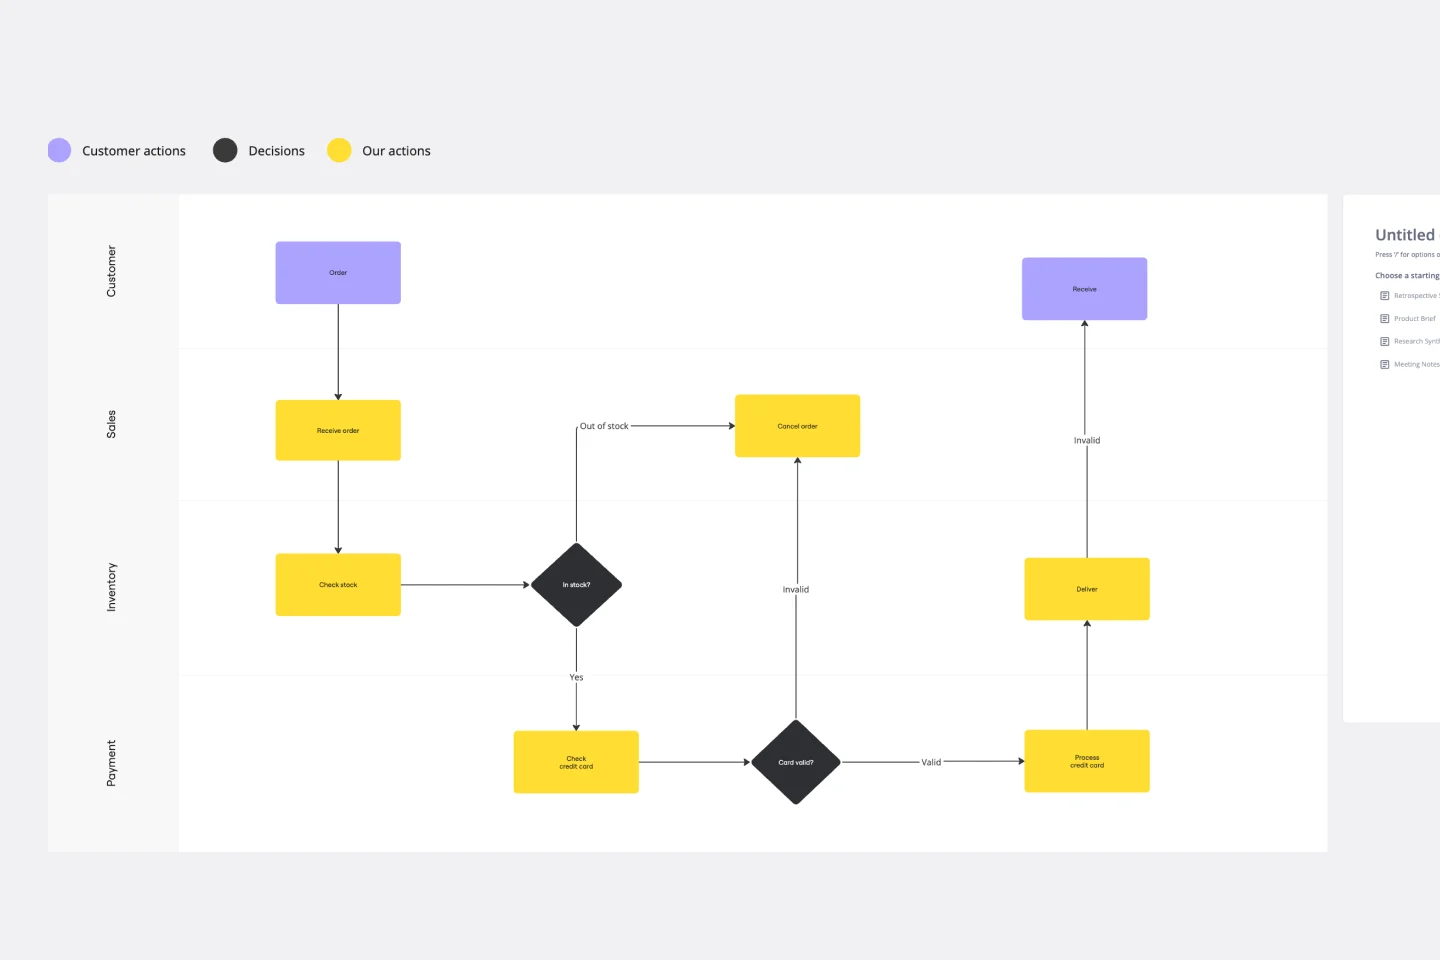
Swimlane Diagram Template
Works best for:
Flowcharts, Diagrams, Workflows
A swimlane diagram shows you which stakeholders are responsible for each area of your critical processes. You can use it to understand current processes or plan new ones.
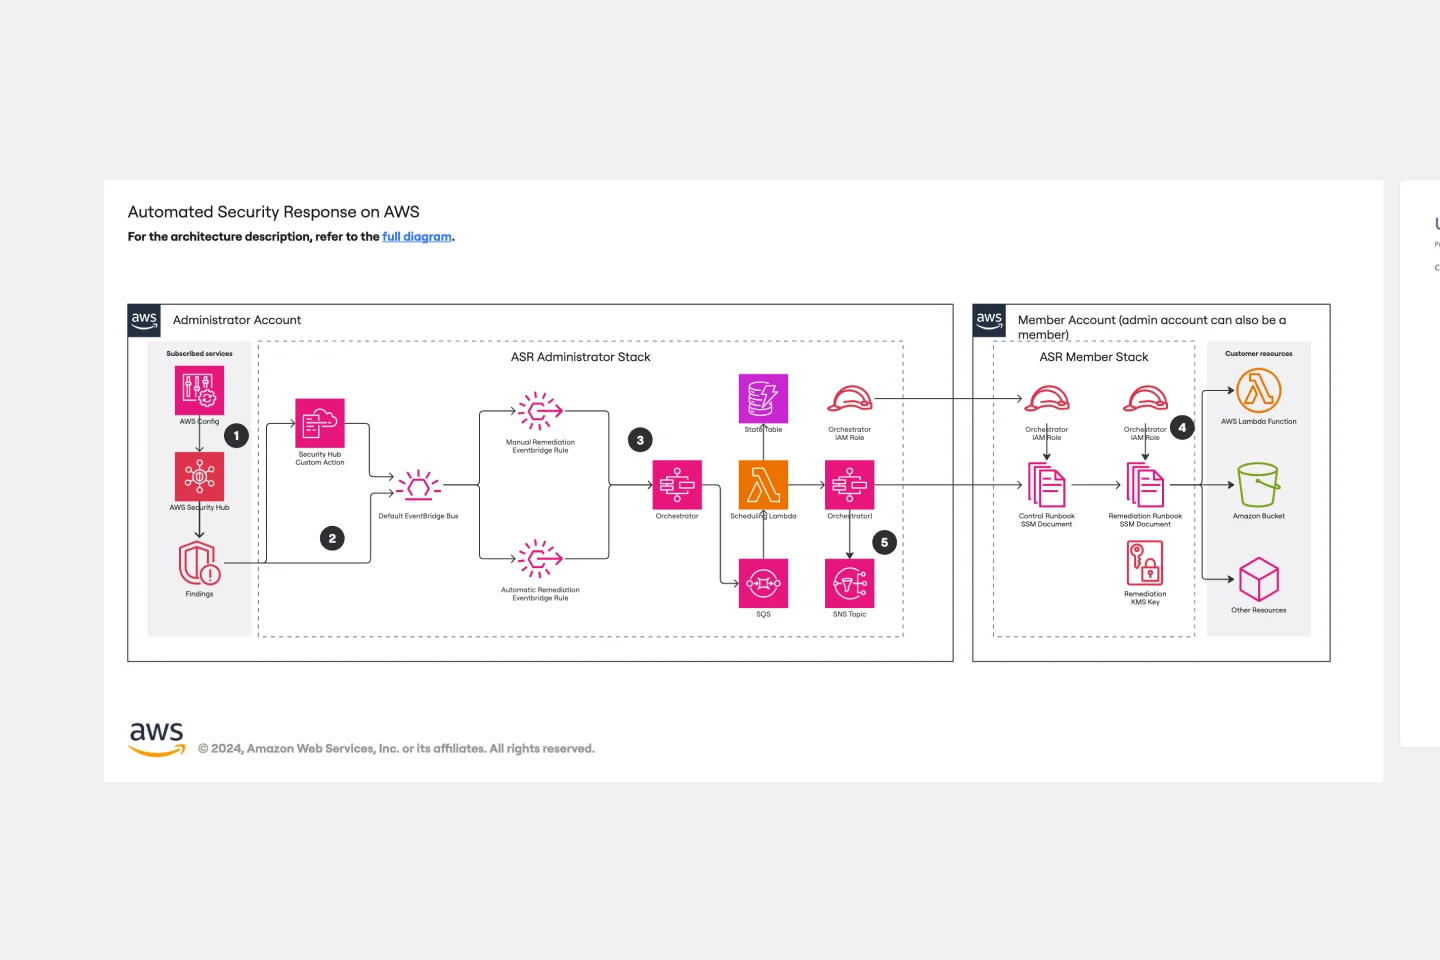
Automated Security Response on AWS Template
Works best for:
AWS
The Automated Security Response on AWS template is a tool for enhancing AWS security through automation, enabling quick identification and mitigation of threats with minimal manual effort. It integrates with AWS security services for a dynamic response mechanism, ensuring infrastructure security against evolving threats. This template streamlines operational efficiency, offers scalable and customizable security strategies, and accelerates threat response times, making it essential for improving AWS security posture.
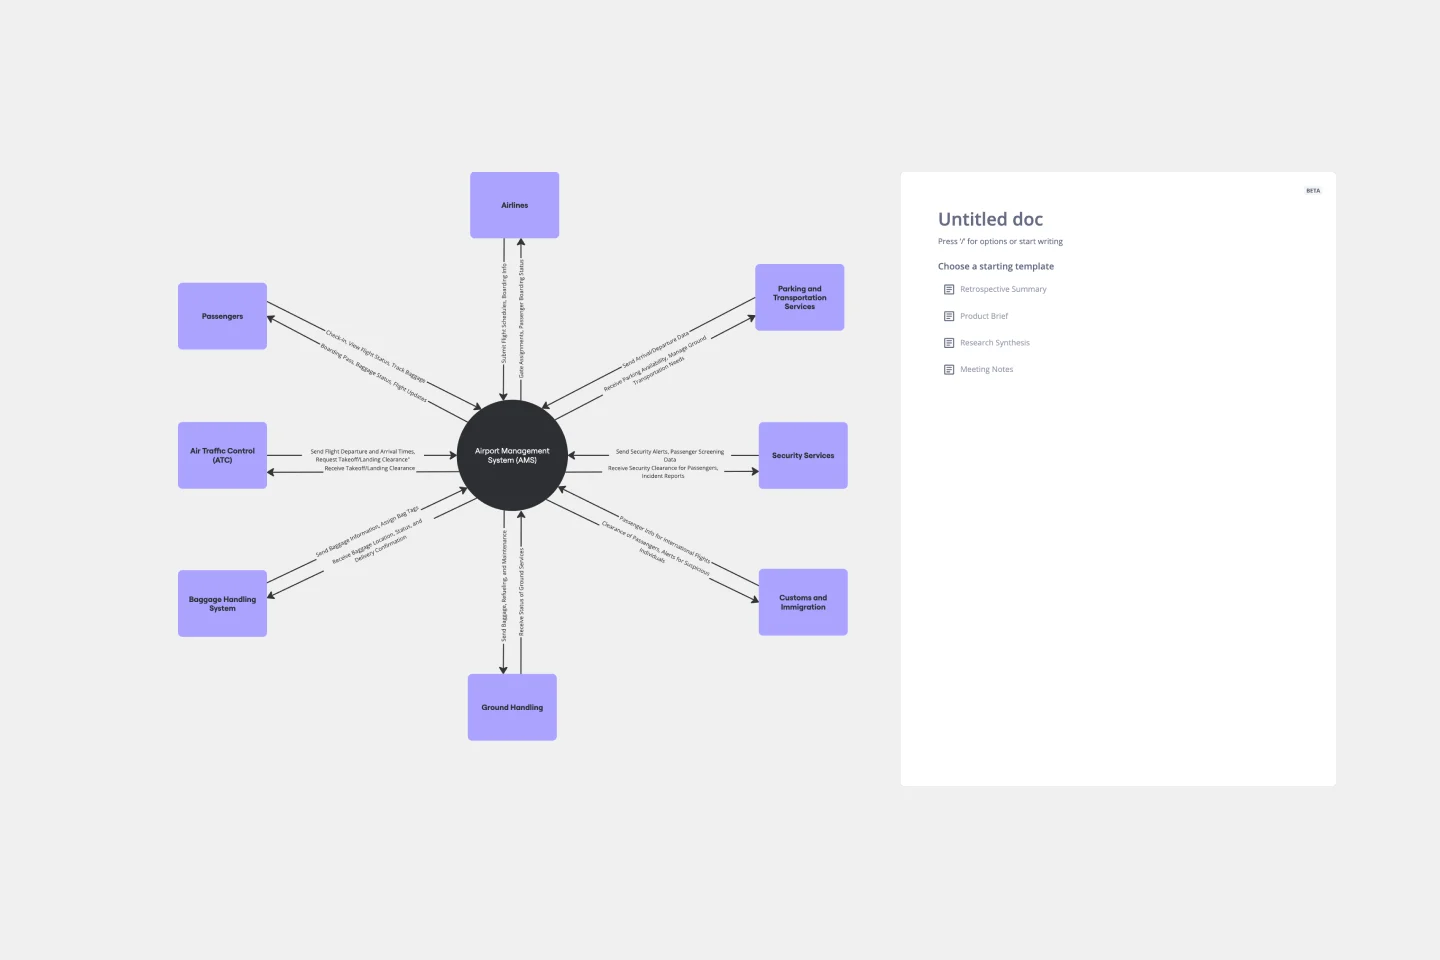
Context Diagram Template
Works best for:
Business Management, Mapping, Diagrams
A context diagram is a perfect tool to view an entire system as a single process and understand how external factors interact with it. These external factors can include customers, developers, management, and more. The Context Diagram Template is your tool for creating this diagram.
Portfolio Template
Works best for:
Presentations, UX Design
The portfolio template is a way for you to showcase your best work in a visual manner. Think of your work portfolio as a way to present who you are as a professional and describe with more detail what you have achieved and what is your unique expertise. You will use a portfolio template as a way to market yourself to future employers when applying for jobs, universities, and training programs.
Kubernetes Application Template
Works best for:
Software Development, Diagrams
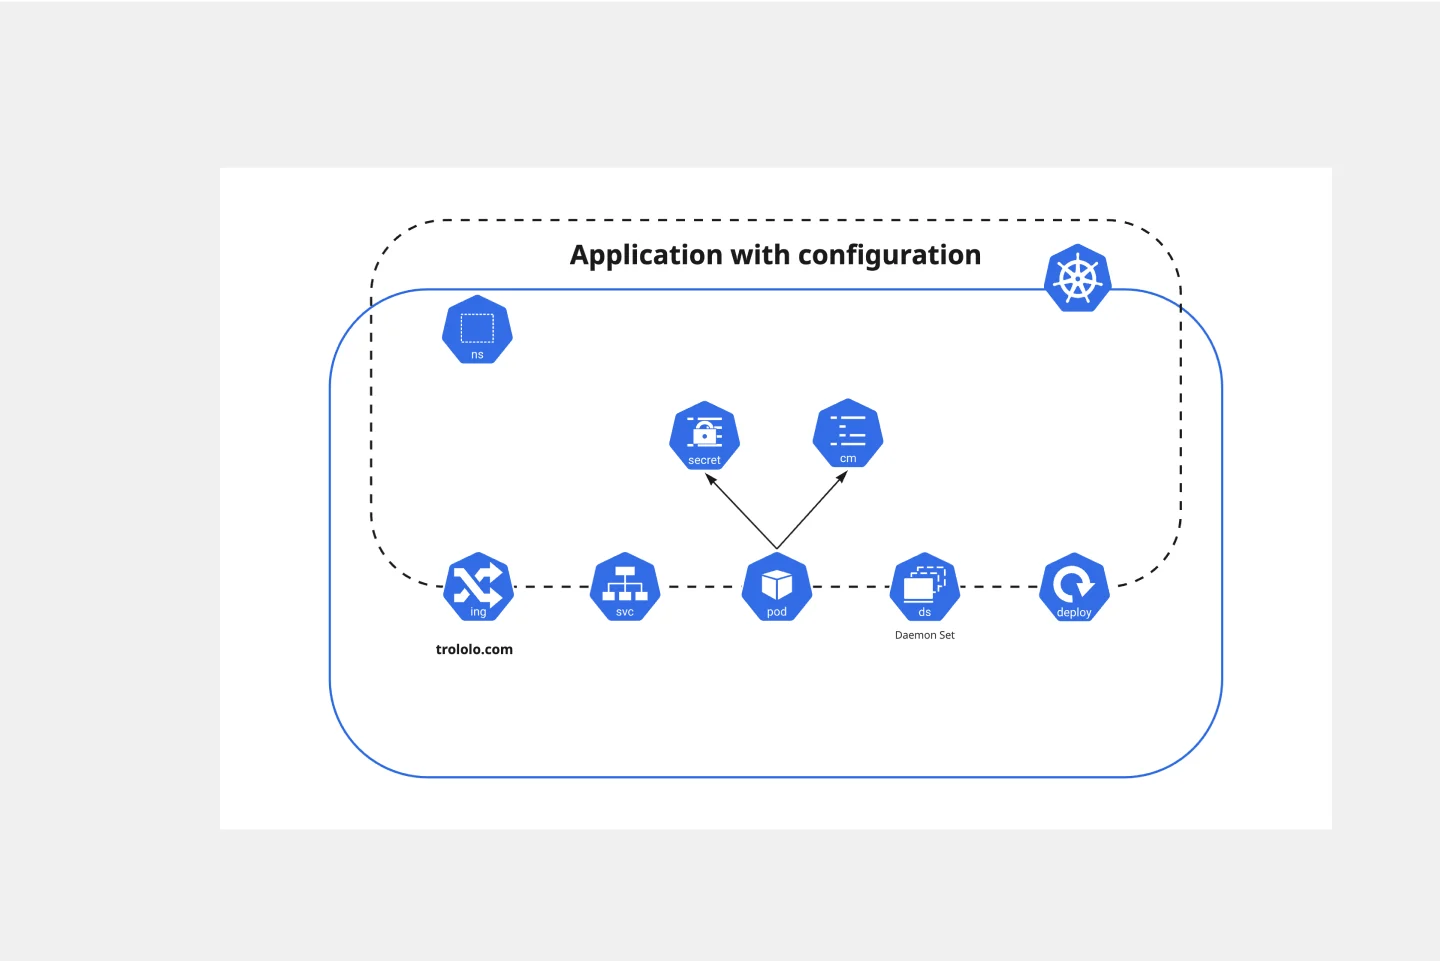
Use the Kubernetes Application template to manage enterprise-ready containerized applications better. You can now get your team more agile when dealing with portability, licensing, and consolidated billing. The Kubernetes Application template allows you to run deployments anywhere, facilitating the management of your applications. Try it out and see if it’s the best fit for you and your team.
Assumption Grid Template
Works best for:
Leadership, Decision Making, Strategic Planning
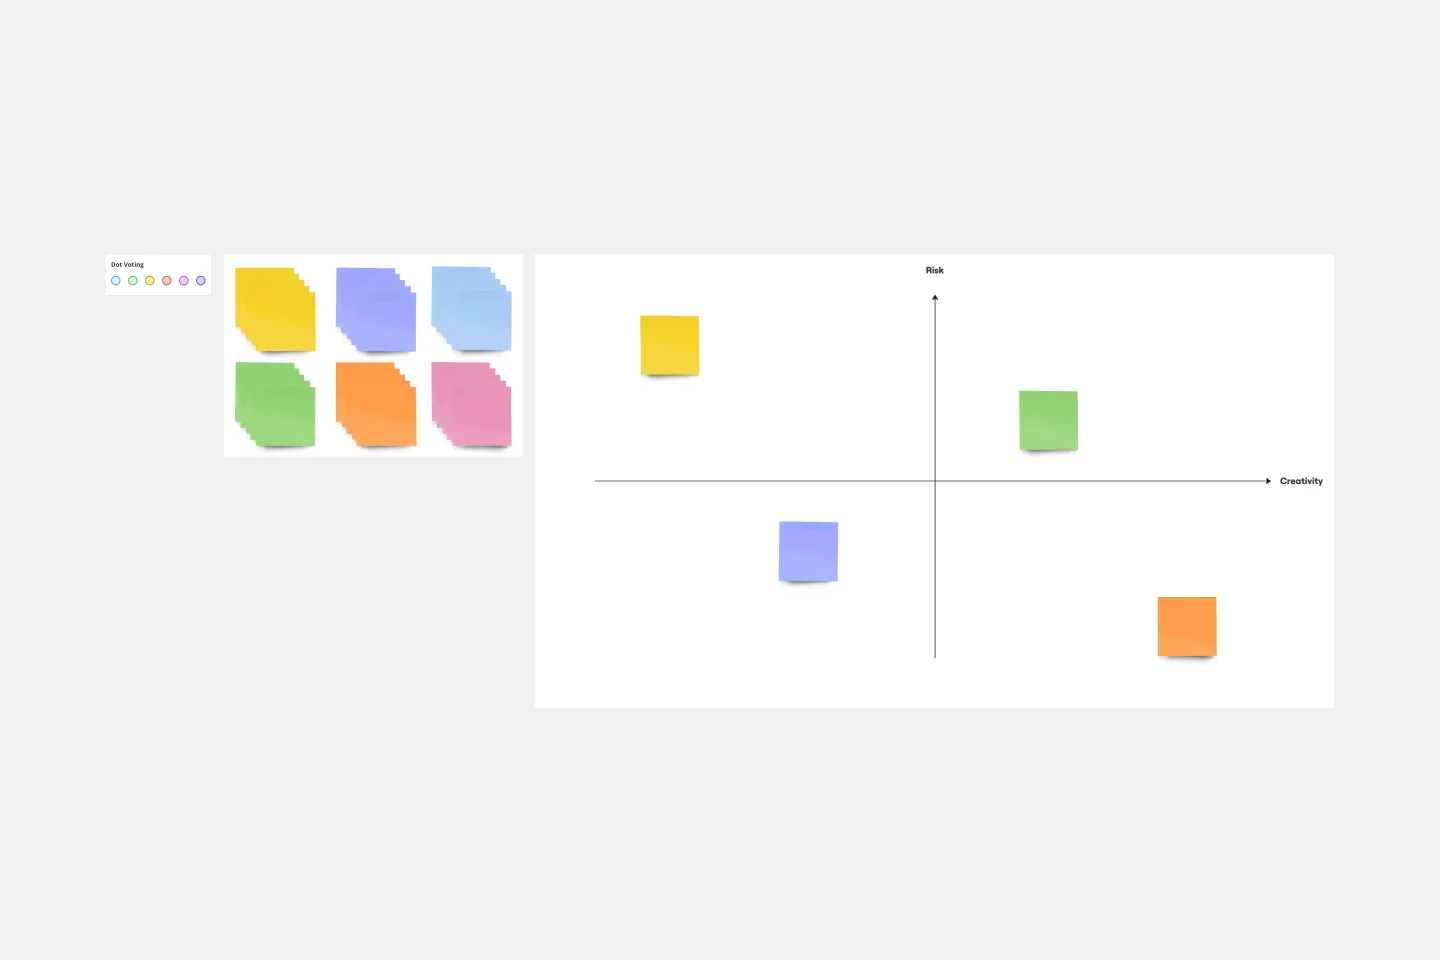
Someone wise once said that nothing in life is certain. But the waters of the business world? It can seem especially uncertain and unclear. An Assumption Grid can help you navigate those waters and make your decisions confidently. It organizes your business ideas according to the certainty and risk of each — then your team can discuss them and make judgment calls, prioritize, mitigate risk, and overcome uncertainties. That’s why an Assumption Grid is a powerful tool for getting past the decision paralysis that every team occasionally faces.