Fishbone Diagram for Process Improvement
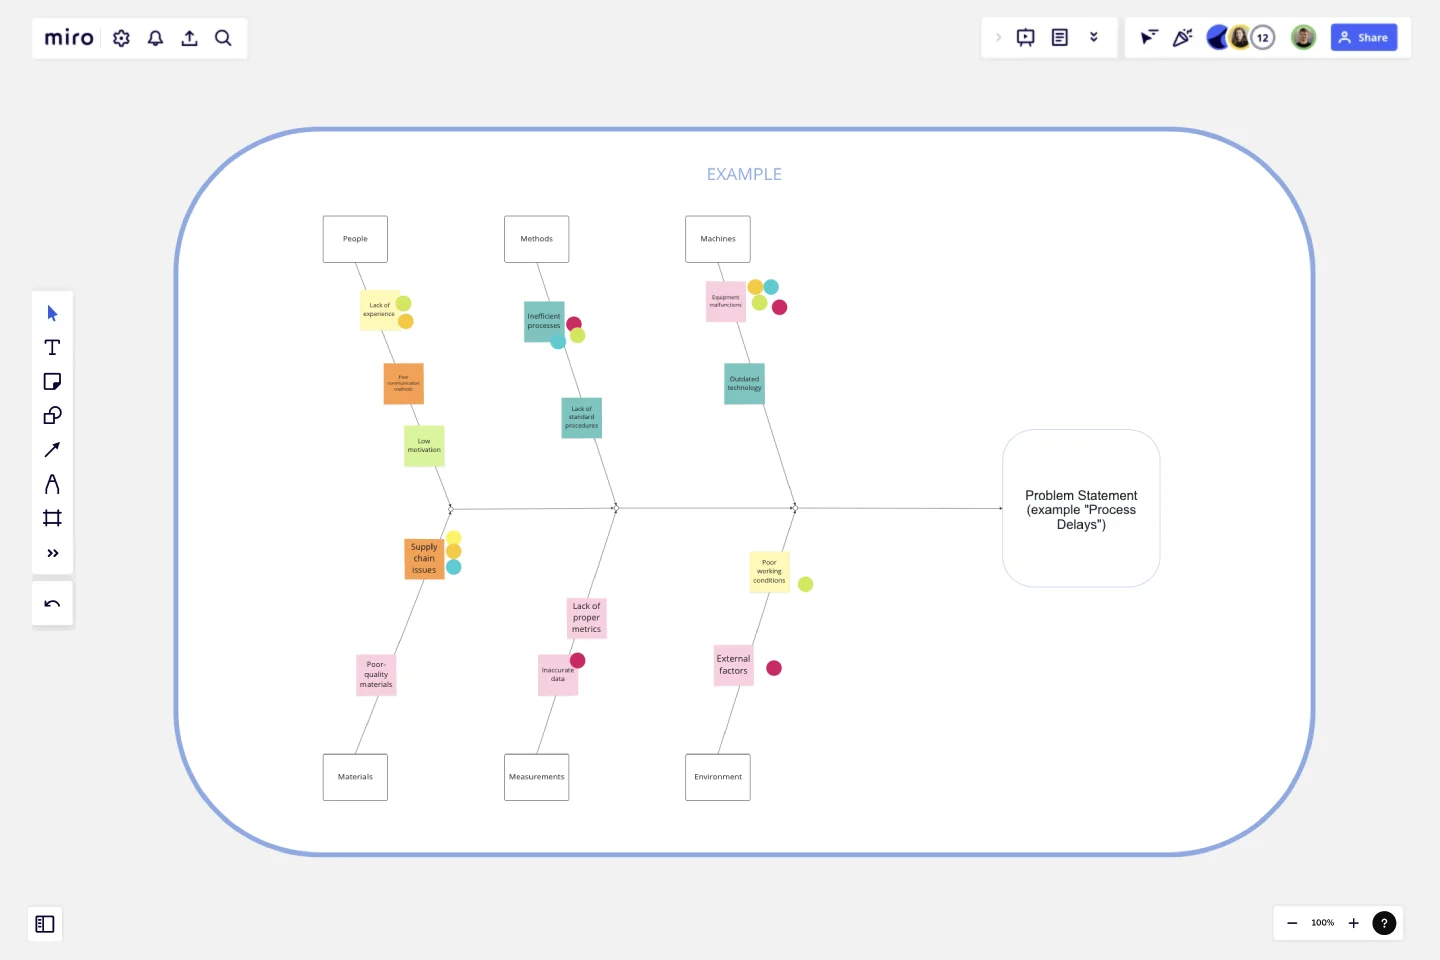
The Fishbone Diagram for Process Improvement template is a specialized tool designed to help teams systematically analyze and identify the root causes of process-related issues.
Here’s why you should consider using this template:
Key Features:
Problem-Centric Design:
The diagram starts with a clear definition of the problem or effect you are addressing, such as "Process Delays" or "Inefficiencies," providing a focused approach to problem-solving.
Major Categories:
The template includes predefined categories relevant to process improvement, such as People, Methods, Machines, Materials, Measurements, and Environment. These categories help in organizing potential causes systematically.
Structured Brainstorming:
Each category has branches for listing potential causes, encouraging thorough brainstorming and ensuring that no aspect of the process is overlooked.
Collaborative Framework:
The template is designed for team collaboration, allowing multiple users to contribute their insights and ideas in a structured manner, fostering a comprehensive analysis.
Visual Clarity:
The fishbone (Ishikawa) diagram's visual structure makes it easy to understand the relationships between the problem and its potential causes, facilitating better communication and discussion among team members.
Why Use This Template?
Systematic Problem Analysis:
The Fishbone Diagram for Process Improvement template helps in systematically breaking down complex problems into manageable parts, making it easier to identify root causes.
Holistic View:
By considering multiple categories, the template ensures that all possible aspects of the process are examined, leading to a more thorough investigation.
Improved Collaboration:
The template promotes team collaboration, ensuring that diverse perspectives are considered, which can lead to more innovative solutions and a better understanding of the problem.
Enhanced Decision-Making:
The structured approach of the template aids in prioritizing causes based on their impact, helping teams focus on the most critical areas first, thus improving decision-making and action planning.
Effective Communication:
The visual nature of the fishbone diagram makes it easier to communicate findings and strategies to stakeholders, ensuring that everyone is on the same page.
By using the Fishbone Diagram for Process Improvement template, teams can effectively analyze process issues, identify root causes, and develop targeted action plans to improve process efficiency and effectiveness.
This template was created by Anthony.
Get started with this template right now.
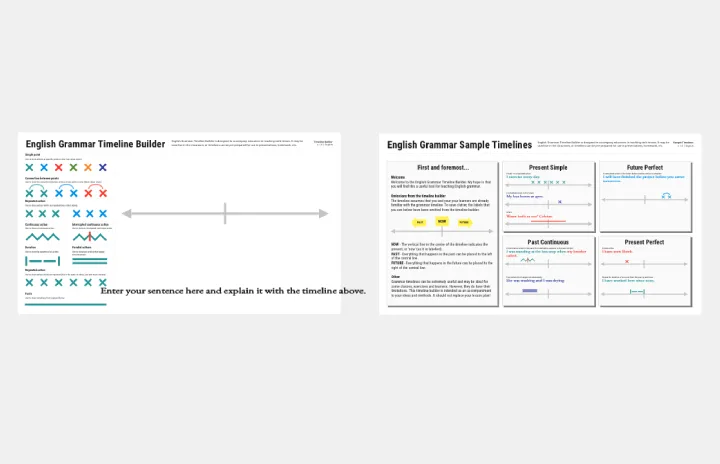
English Grammar Timeline Builder
The English Grammar Timeline template helps you map out the progression of grammar concepts over time. This is a great tool for educators and students to visualize the sequence and relationship between different grammar topics, making learning and teaching more effective.
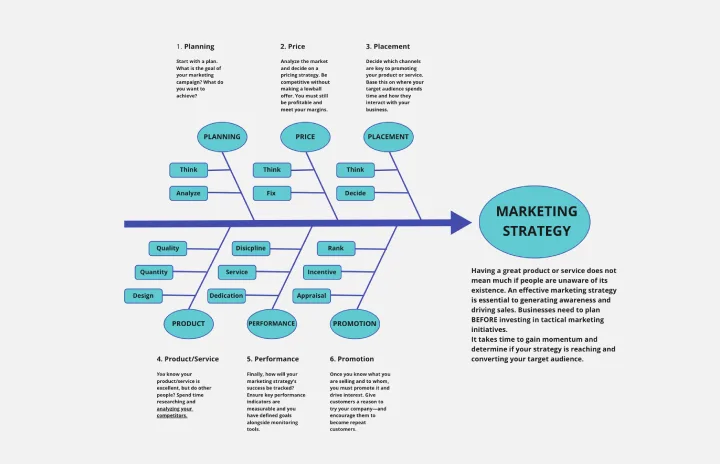
Fishbone Diagram for Marketing
Works best for:
Fishbone diagram
Identifying the root causes of marketing challenges is essential for effective strategy development. The Fishbone Diagram for Marketing template helps you systematically explore factors affecting your marketing efforts. Categorize potential causes into areas such as market research, product positioning, promotional strategies, and distribution channels. This structured analysis enables your team to pinpoint and address issues, optimizing marketing campaigns.
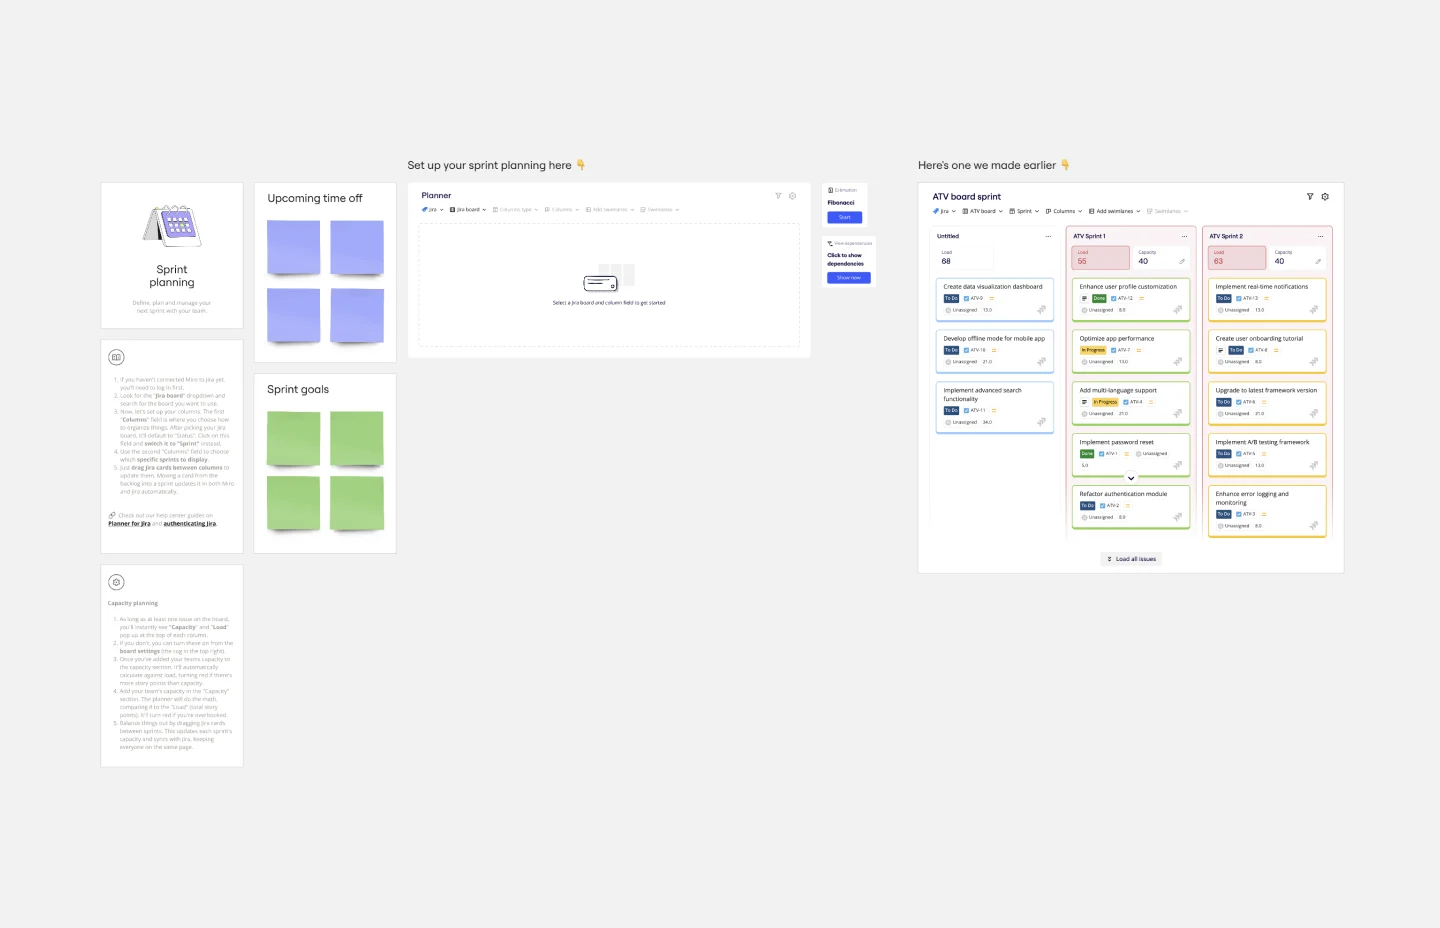
Sprint Planning with Jira Template
Works best for:
Sprint Planning, Agile
The Sprint Planning with Jira template in Miro is a powerful tool designed to streamline and enhance your sprint planning sessions. One of the key benefits of this template is its Jira integration, which saves time and effort when planning and aligning teams. By integrating directly with Jira, the template allows for seamless import and management of tasks, ensuring that all your Jira tickets are up-to-date and easily accessible within Miro. This reduces the need for manual updates and minimizes errors, making the planning process more efficient and effective.
Entity–Relationship Diagram (ERD) HR Management System Template
Works best for:
ERD
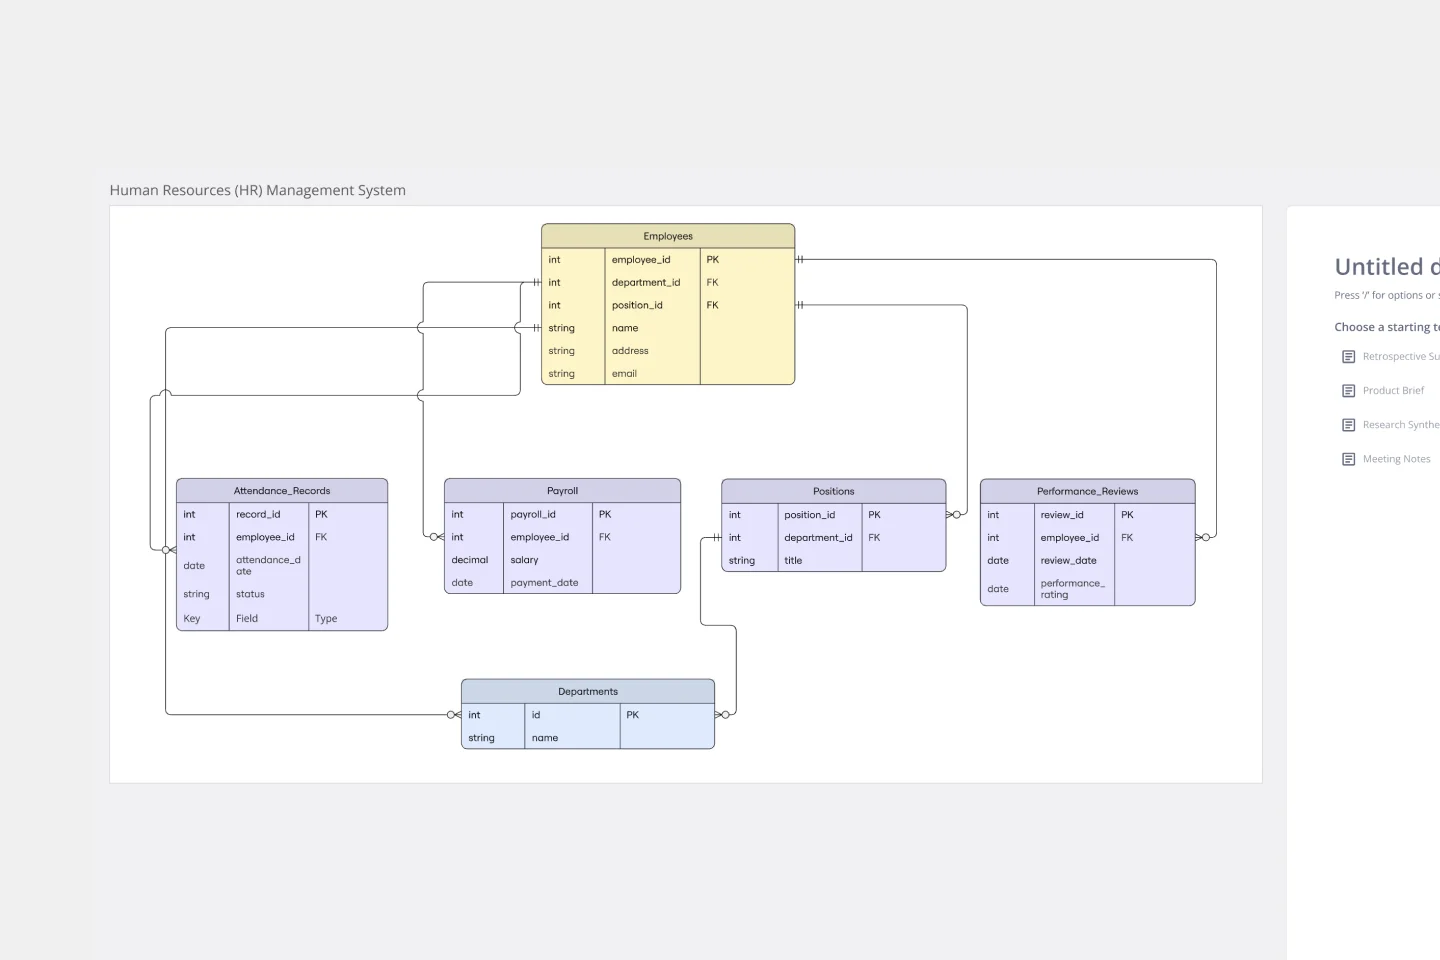
The Entity–Relationship Diagram (ERD) HR Management System Template in Miro is designed to streamline the management of employee-related information and processes within an organization. This template allows for the visualization and organization of complex HR systems, making it easier to understand relationships and processes. It enables users to map out departments, positions, and employee details, including attendance records, payroll, and performance reviews.
What's on Your Radar Template
Works best for:
Business Management, Operations, Strategic Planning
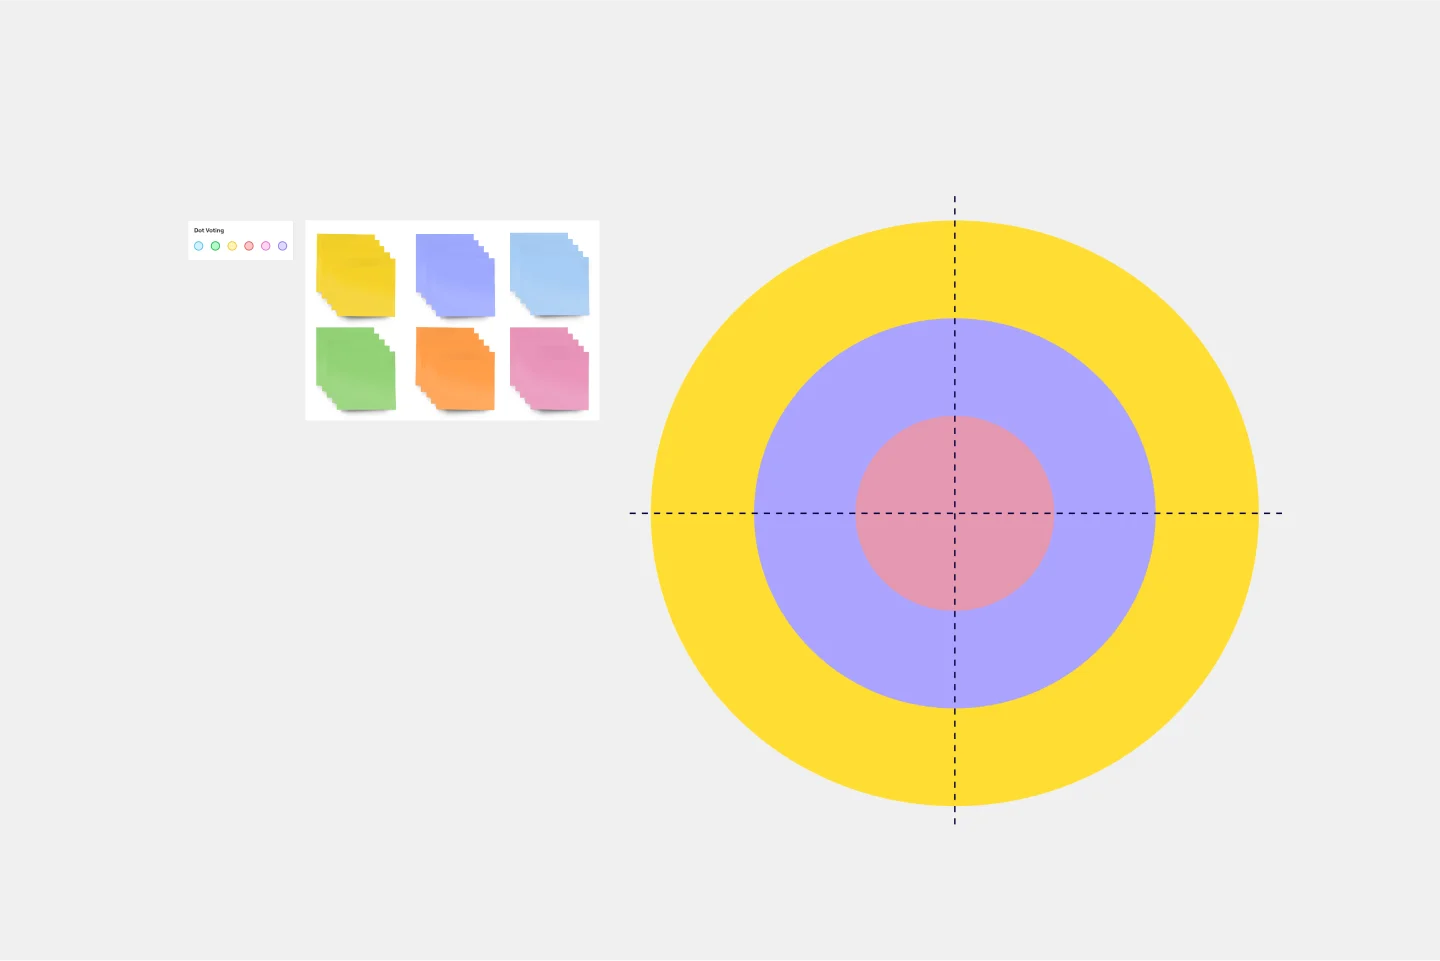
Do you or your team feel overburdened by tasks? Having trouble focusing on particular problems? What’s on Your Radar is a thought exercise in which you plot ideas according to their importance or relevance. Designers and teams use what’s on your radar to ensure that their ideas are within the scope of a given project. They also rely on the method to assess whether a given solution is likely to solve the problem at hand. But even if you’re not a designer, the method can help assign priorities and ground your ideas in reality.
Lean Canvas Template
Works best for:
Agile Methodology, Strategic Planning, Agile Workflows
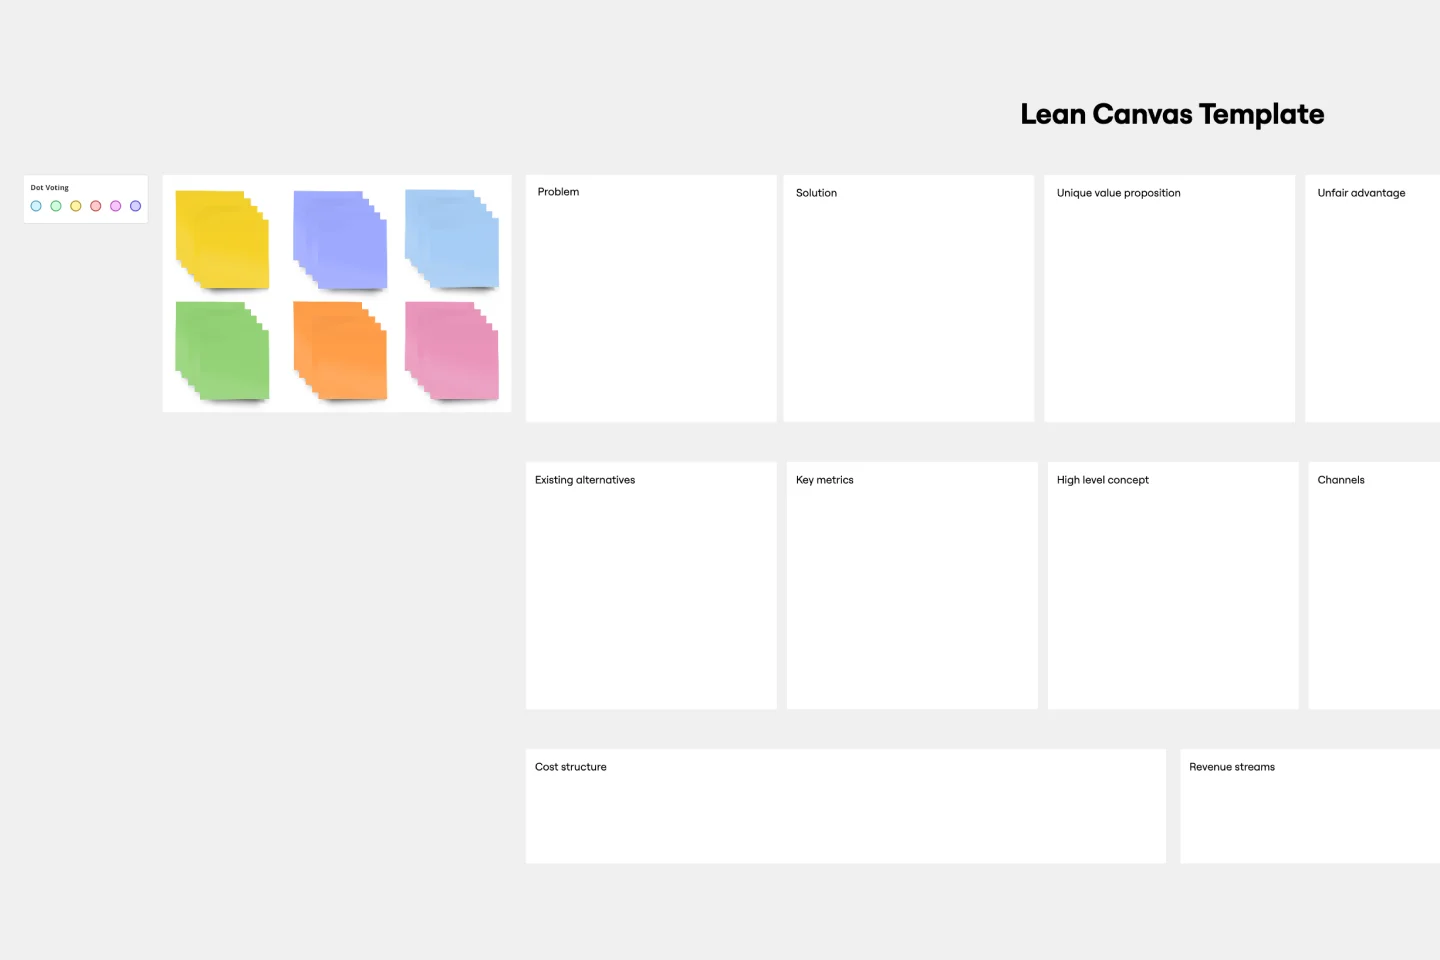
Business opportunities can get dense, cumbersome, and complex, and evaluating them can be a real challenge. Let a lean canvas streamline things and break down your business idea for you and your team. A great tool or entrepreneurs and emerging businesses, this one-page business model gives you an easy, high-level view of your idea — so you can stay focused on overall strategy, identify potential threats and opportunities, and brainstorm the various factors at play in determining your potential profitability in an industry.