About the Fault Tree Analysis Template
Navigating the complexities of system failures can be a daunting task. However, with the right tools, it becomes significantly easier. The Fault Tree Analysis (FTA) Template is an instrument designed to provide a structured approach to break down and analyze potential causes of system malfunctions visually.
What's a fault tree analysis template?
A fault tree analysis template is a diagrammatic representation of a system's possible malfunctions or failures. The template consists of a combination of logical symbols, visually breaking down the causes and effects and showcasing how one particular failure can result from various combinations of different losses. It's a powerful tool to identify vulnerabilities in any system or process.
Why use a fault tree analysis template?
Delving into the complexities of any system can reveal potential vulnerabilities. To efficiently navigate and address these vulnerabilities, it's crucial to have the right tool at hand. Here's why the fault tree analysis template is an essential tool for many professionals:
Clarity in complex situations: Fault tree diagrams present a visual map of potential problems and their root causes, making it easier to grasp intricate scenarios.
Predictive power: One can anticipate and mitigate risks by understanding the potential faults and their causal relations.
Efficient problem-solving: A clear view of all possible malfunctions helps prioritize interventions and target the most critical issues.
Enhanced communication: The visual nature of the template enables teams to have more structured and effective discussions about system vulnerabilities.
How to use the fault tree analysis template:
Leveraging the FTA template in Miro couldn't be easier.
Editing the template: Customize the template with a few clicks to tailor it to the specific complexities of your system or process. Change the content by double-clicking the shapes or editing the look and feel by clicking on the context menu bar.
Expansion: Develop the tree further by adding branches and nodes as you uncover more potential faults and their causes. Expand your fault tree by clicking on the shape and selecting the plus icon.
If you'd prefer to start from scratch, diagramming with Miro is easy. Choose from a wide range of diagramming shapes in Miro's extensive library, and start diagramming directly on your board.
Fault Tree Analysis Template FAQs
Is the Fault Tree Analysis Template suitable for all industries?
From IT to manufacturing, healthcare to finance – the template can be customized to analyze failures across any system or process in any industry.
Can multiple team members collaborate on the FTA in real time?
Yes, Miro allows multiple users to collaborate on the board in real time, making it perfect for team discussions and brainstorming sessions.
How detailed should my FTA be?
The depth of your FTA depends on your specific needs. While a high-level overview can provide quick insights, a detailed analysis can help thoroughly understand and mitigate all potential risks.

Miro
Your virtual workspace for innovation
Miro is an innovation workspace designed for teams of every size, everywhere, to dream, design, and build the future together. Our mission? To empower these teams to create the next big thing, powered by AI at every step of the way. Over 90 million users around the world rely on Miro to untangle complex ideas, put customer needs first, and deliver products and services faster. All supported by best-in-class security, compliance, and scalability.
Categories
Similar templates
Prune the Product Tree Template
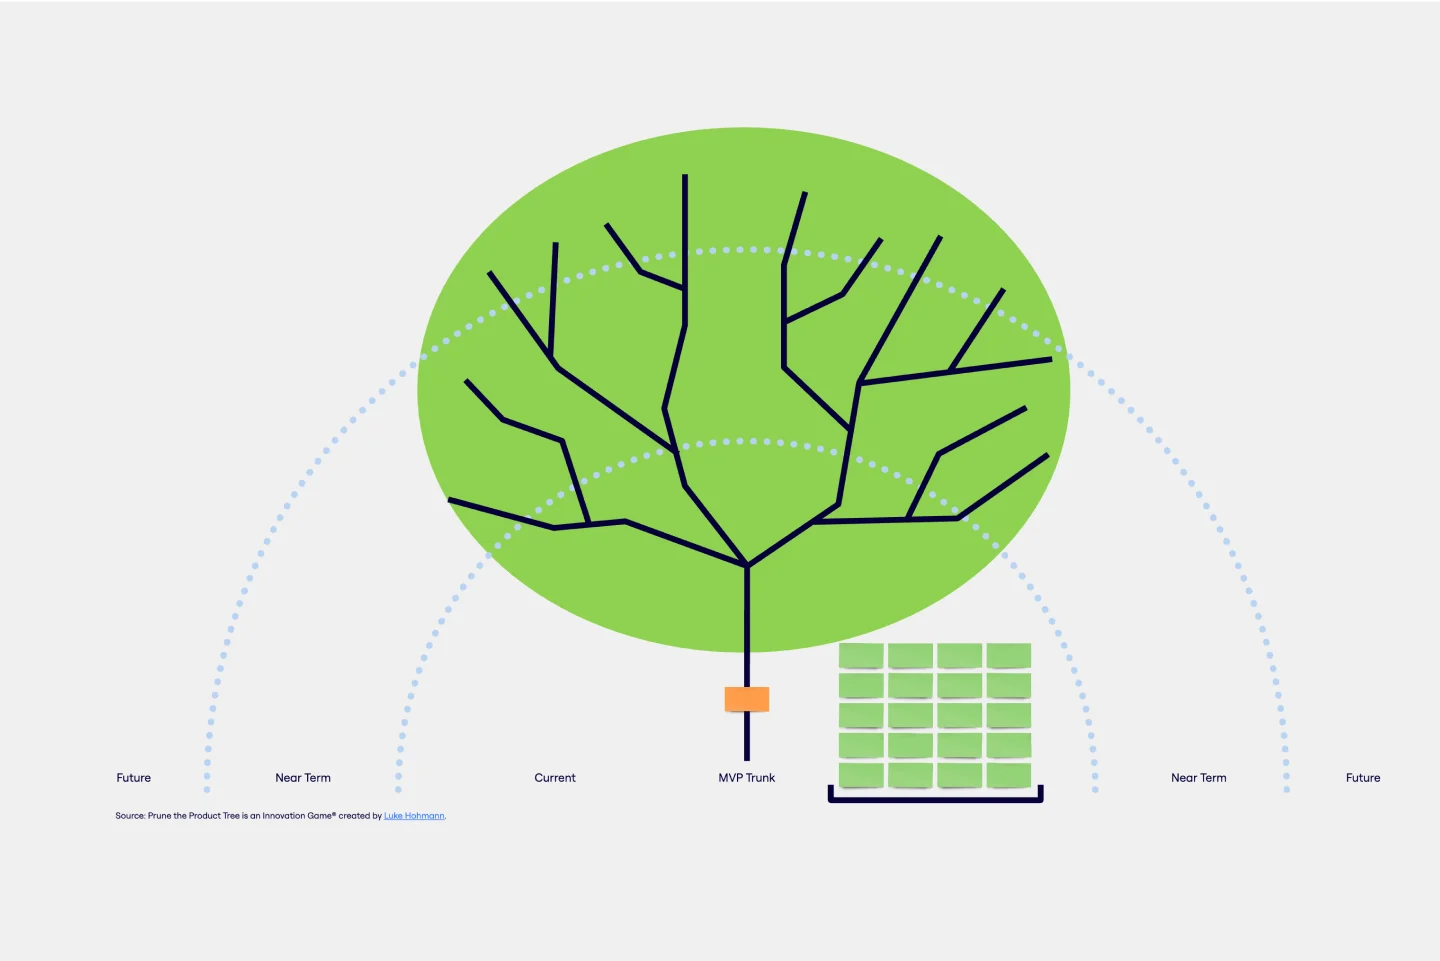
Prune the Product Tree Template
Prune the Product Tree (also known as the product tree game or the product tree prioritization framework) is a visual tool that helps product managers organize and prioritize product feature requests. The tree represents a product roadmap and helps your team think about how to grow and shape your product or service by gamifying feedback-gathering from customers and stakeholders. A typical product tree has four symbolic features: the trunk, which represents the existing product features your team is building; the branches, each of which represents a product or system function; roots, which are technical requirements or infrastructure; and leaves, which are new ideas for product features.
Opportunity Solution Tree Template
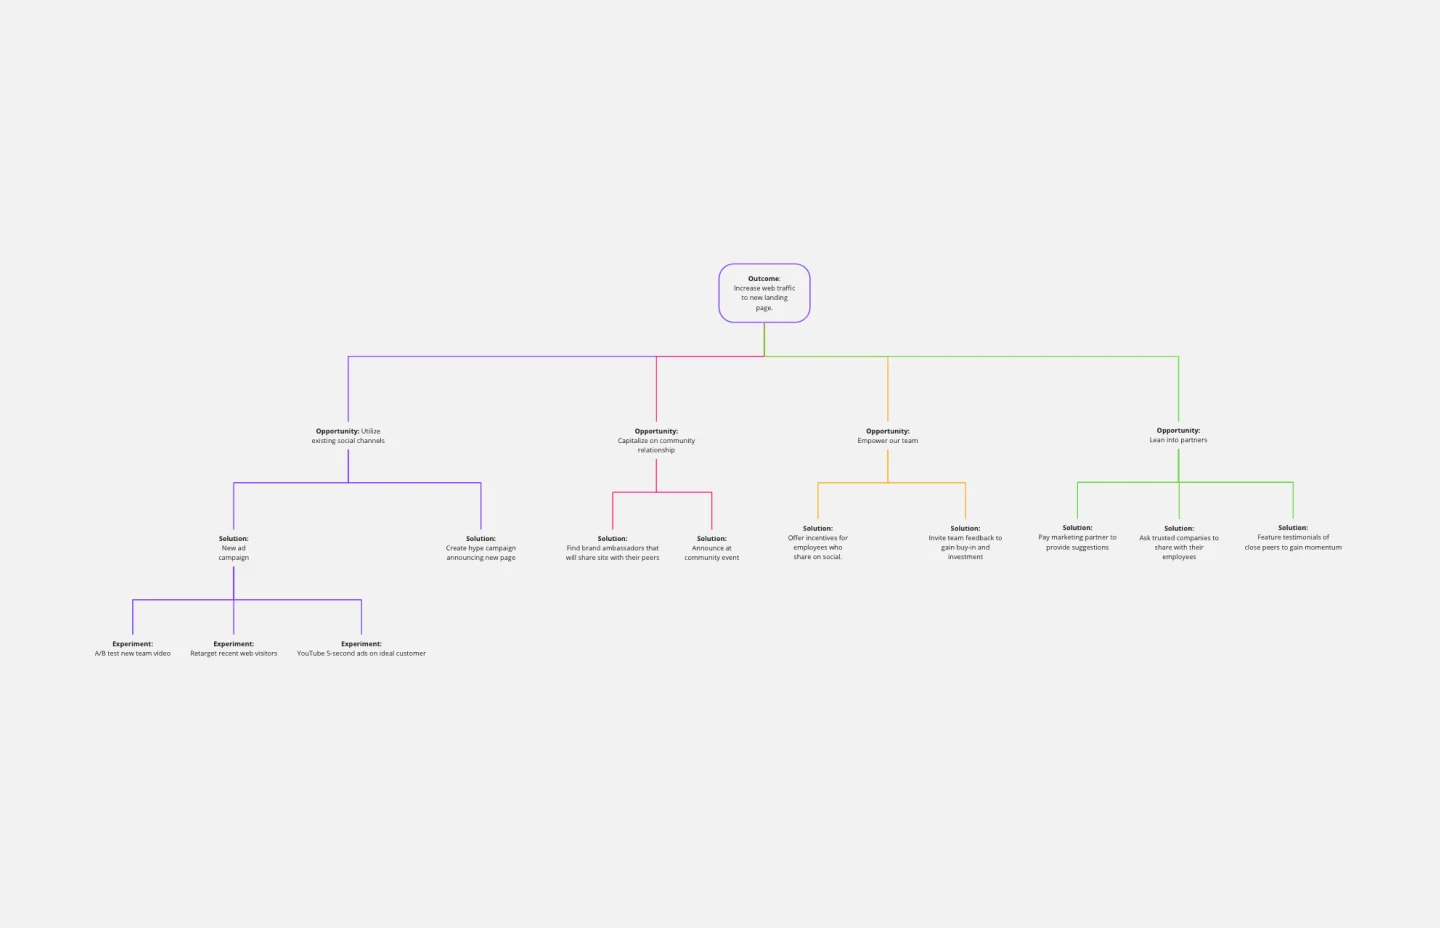
Opportunity Solution Tree Template
Solving problems — successful companies and productive teams just know how to do it. They’re able to identify many possible solutions, then settle on the one that leads to the desired outcome. That’s the power an Opportunity Solution Tree gives you. Designed by Teresa Torres, a product discovery coach, this mind map breaks down your desired outcome into opportunities for the product to meet user needs, then gives your team an effective way to brainstorm potential solutions.
Decision Tree Template
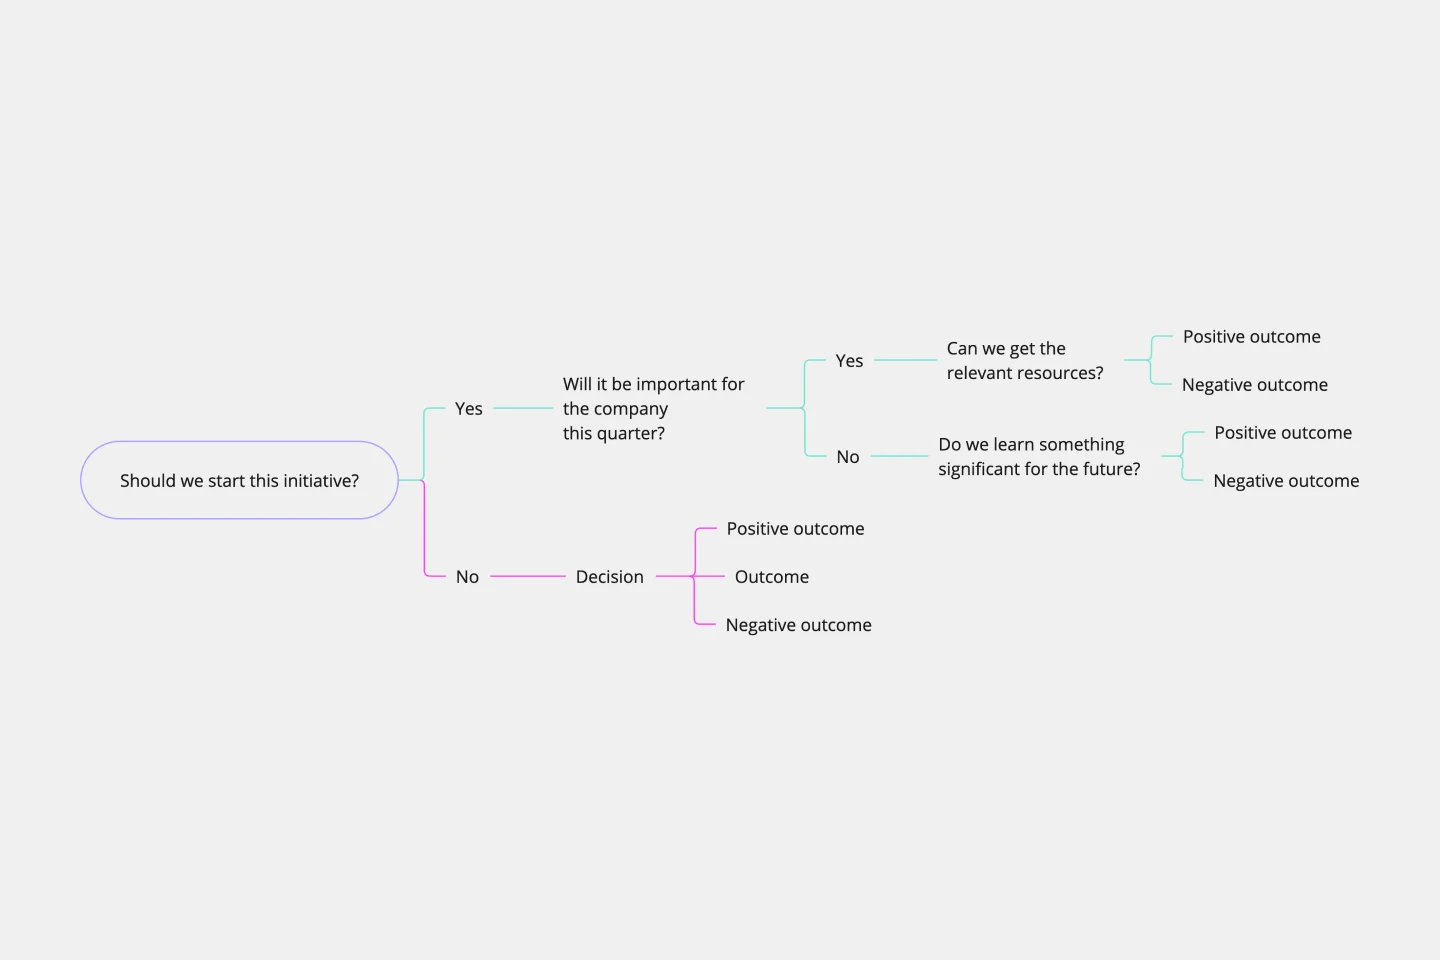
Decision Tree Template
Making difficult decisions gets easier when you can look clearly at your choices and visualize the outcomes. That’s just what a decision tree will help you do, empowering you to invest your time and money with confidence. A decision tree is a flowchart that looks just how you’d imagine—with “branches” that represent your available choices. It provides a stylized way to play out a series of decisions and see where they lead before you commit your real-world resources, which is especially valuable for startups and smaller companies.
Prune the Product Tree Template
Prune the Product Tree Template
Prune the Product Tree (also known as the product tree game or the product tree prioritization framework) is a visual tool that helps product managers organize and prioritize product feature requests. The tree represents a product roadmap and helps your team think about how to grow and shape your product or service by gamifying feedback-gathering from customers and stakeholders. A typical product tree has four symbolic features: the trunk, which represents the existing product features your team is building; the branches, each of which represents a product or system function; roots, which are technical requirements or infrastructure; and leaves, which are new ideas for product features.
Opportunity Solution Tree Template
Opportunity Solution Tree Template
Solving problems — successful companies and productive teams just know how to do it. They’re able to identify many possible solutions, then settle on the one that leads to the desired outcome. That’s the power an Opportunity Solution Tree gives you. Designed by Teresa Torres, a product discovery coach, this mind map breaks down your desired outcome into opportunities for the product to meet user needs, then gives your team an effective way to brainstorm potential solutions.
Decision Tree Template
Decision Tree Template
Making difficult decisions gets easier when you can look clearly at your choices and visualize the outcomes. That’s just what a decision tree will help you do, empowering you to invest your time and money with confidence. A decision tree is a flowchart that looks just how you’d imagine—with “branches” that represent your available choices. It provides a stylized way to play out a series of decisions and see where they lead before you commit your real-world resources, which is especially valuable for startups and smaller companies.