About the Family Tree Template
Understanding your family genealogy can be difficult. A family tree simplifies this by giving you a birds-eye view in a simple and easy-to-understand format. It also allows you to add people and other information as you learn more about your family.
Keep reading to learn more about our Family Tree Template.
What is a family tree?
A family tree is a visual representation of someone’s lineage and genealogy. Through nodes and lines that represent marriage and blood relationships, a family tree presents a thorough record of family history. It shows your direct ancestors, but it can also branch out much further than that and include anyone you’re related to.
Typically, the creator of the family tree serves as the starting point. All relatives are included in the family tree relative to this person.
Other times, genealogists or historians might create family trees to help them understand the family relationships of a historically significant person.
Benefits of creating a family tree
First and foremost, family trees serve as a record of your family history. You’ll be able to track birth, marriage, and death dates, as well as other life events like moves or emigrations.
As you build your family tree, you’ll likely uncover new stories about your family that you’ve never heard before. This helps you get a fuller picture of what your family looked like in past generations.
Create your own family tree
You don’t need much information to create a family tree. As long as you have a few family names, you can build out the foundation of your family tree.
Open up the Family Tree Template to get started or use Miro's tree diagram maker, then follow these steps.
Step 1: Write your name as the starting point for your family tree. If you’re creating the family tree for your child or a historical figure, start with the main subject of your diagram.
Step 2:Start with your immediate family. Use dotted lines to connect yourself to your siblings and a solid line to connect yourself to your parents. In our simple Family Tree Template, parent/child relationships are also labeled with a small chick icon.
Since you likely know a lot about your immediate family members, feel free to fill in extra information as you go. You can add birth and death dates, married or middle names, and anything else you want to follow up on in your family history research.
Step 3:Add your extended relatives. You might start with your grandparents, aunts and uncles, and cousins, or you might add your sibling’s spouses and children.
As you build out your family tree, it’s smart to begin with the sides of the family you’re most familiar with. You’ll get comfortable building out your family tree and can put those skills to good use as you dive deeper into your family history.
Step 4: Add any extra information. Family tree charts can be as simple or as complex as you’d like. To make them as useful and interesting as possible, add images, create graphs, or include any extra information about your relatives.
You can find birth, death, and marriage records online pretty easily. Plenty of records are publicly available online or through local libraries and historical societies. Census data can also be incredibly helpful, as it confirms where your family was living at certain times.
You can also collaborate on building your family tree by sharing your diagram with other family members and getting them to fill in any blanks.
Step 5:Build onto your tree as much or as little as you’d like, or create more trees. Don’t be surprised if genealogy research becomes a full-fledged hobby for you.
Your family tree chart can expand as you discover additional information about your family history. You can even expand it into a genogram, which helps you represent family patterns, conflicts, and timelines in addition to basic data.
We've created a definitive guide to family tree diagrams that covers the basics and more in-depth topics. It also delves into other diagrams that borrow from the family tree structure but are used for different work processes.
When to use a Family Tree Template
Family trees can come in handy any time you’re researching your family history.
Your child might make a family tree for a school project to help them understand their closest relatives. Or, you could create one to identify gaps in your ancestry research that need more attention and resources.
What’s most important is to use a Family Tree Template like Miro’s that allows you to expand and refine your family tree as often as you need. You never know when you might discover a new relative or a surprising family story.
Family tree FAQ
Who is the first generation in a family tree?
Family tree charts work backward from the most recent generation you want to trace. If you’re creating your own family tree, you’ll be the first generation listed on the family tree. Everyone else is listed in relation to you.
How far back can a family tree be traced?
Many people will be able to trace their family trees back to the mid-1800s, when communities began to purposefully keep public records of births, marriages, and deaths, among other things. Prior to that, you’ll have to depend on family records, such as letters. Some people can trace their family pedigree back to the 1600s or earlier. You’re more likely to be able to trace your family tree back this far if your ancestors attended church, owned land, or were otherwise wealthy.Decision Tree TemplatesDiagramming & MappingDiagramming & mappingOrganizational ChartEducationFamily Tree TemplateGet started with this template right now.Use template

Miro
Your virtual workspace for innovation
Miro is an innovation workspace designed for teams of every size, everywhere, to dream, design, and build the future together. Our mission? To empower these teams to create the next big thing, powered by AI at every step of the way. Over 90 million users around the world rely on Miro to untangle complex ideas, put customer needs first, and deliver products and services faster. All supported by best-in-class security, compliance, and scalability.
Categories
Similar templates
Concept Map Template
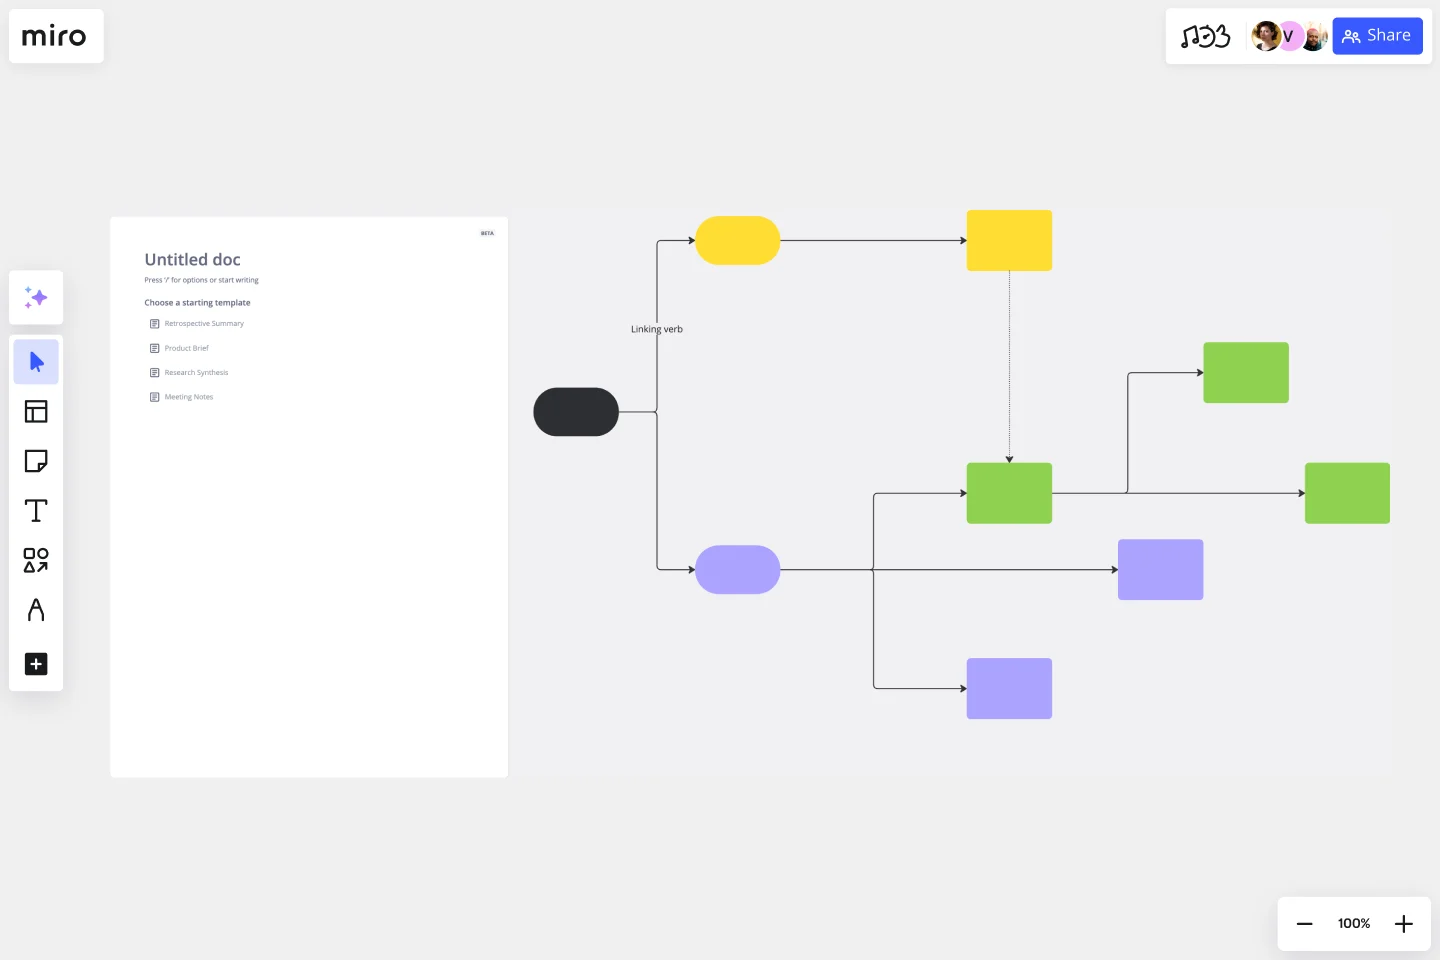
Concept Map Template
Use the concept map template to create new ideas, structure your thoughts, and bring your innovations to life. It allows you to explore connections between concepts and let your creativity flow in an organized format. As a result, you’re able to visualize how to bring your new ideas to reality and how various concepts relate to each other.
Context Diagram Template
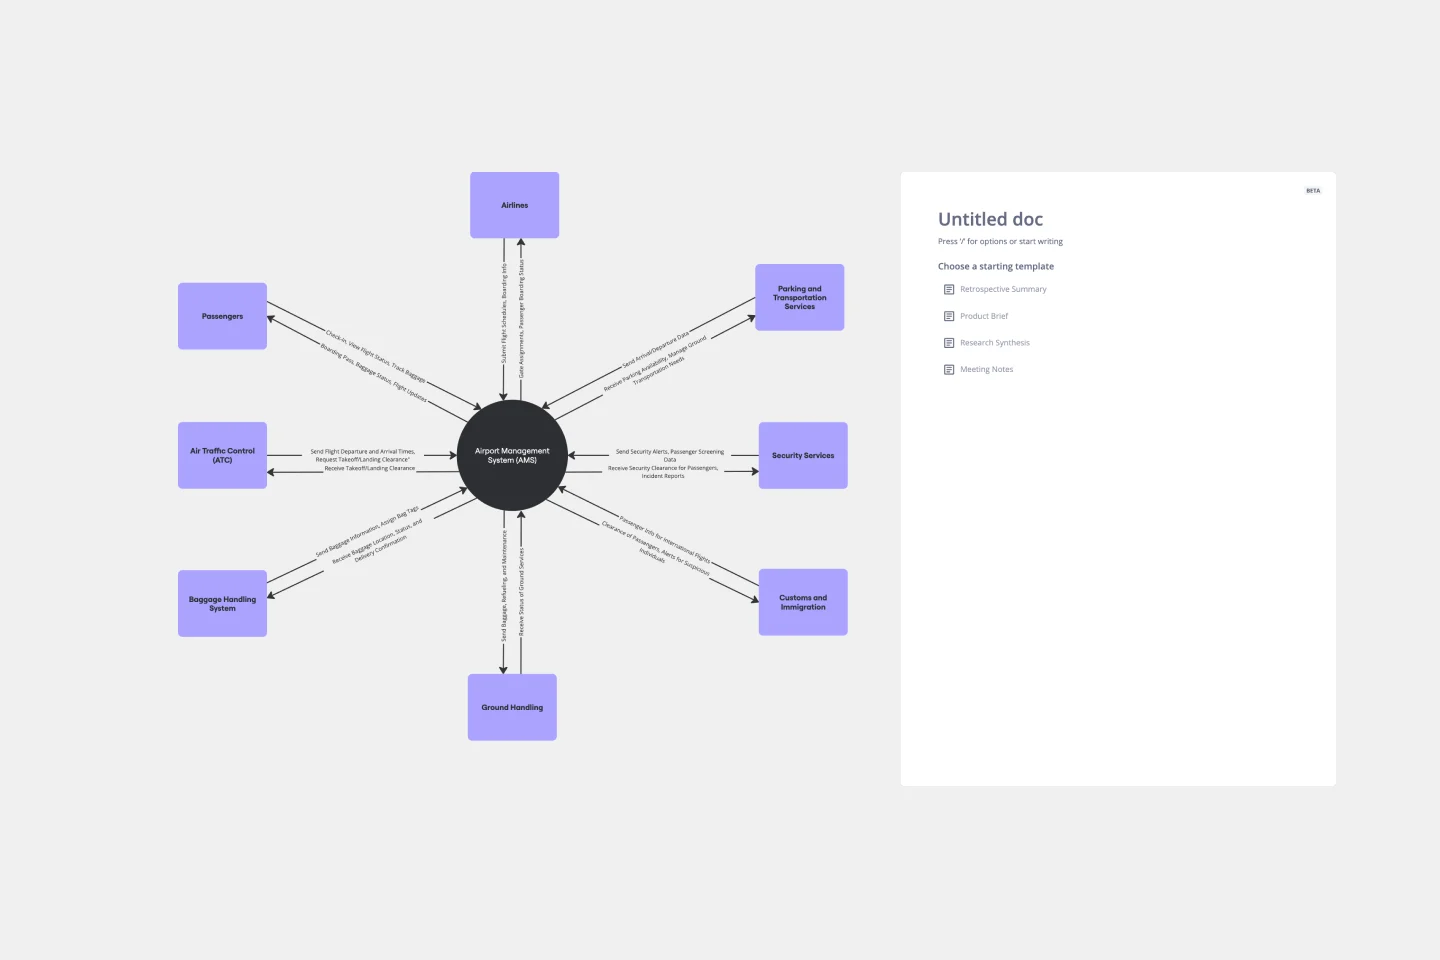
Context Diagram Template
A context diagram is a perfect tool to view an entire system as a single process and understand how external factors interact with it. These external factors can include customers, developers, management, and more. The Context Diagram Template is your tool for creating this diagram.
Influence Diagram Template
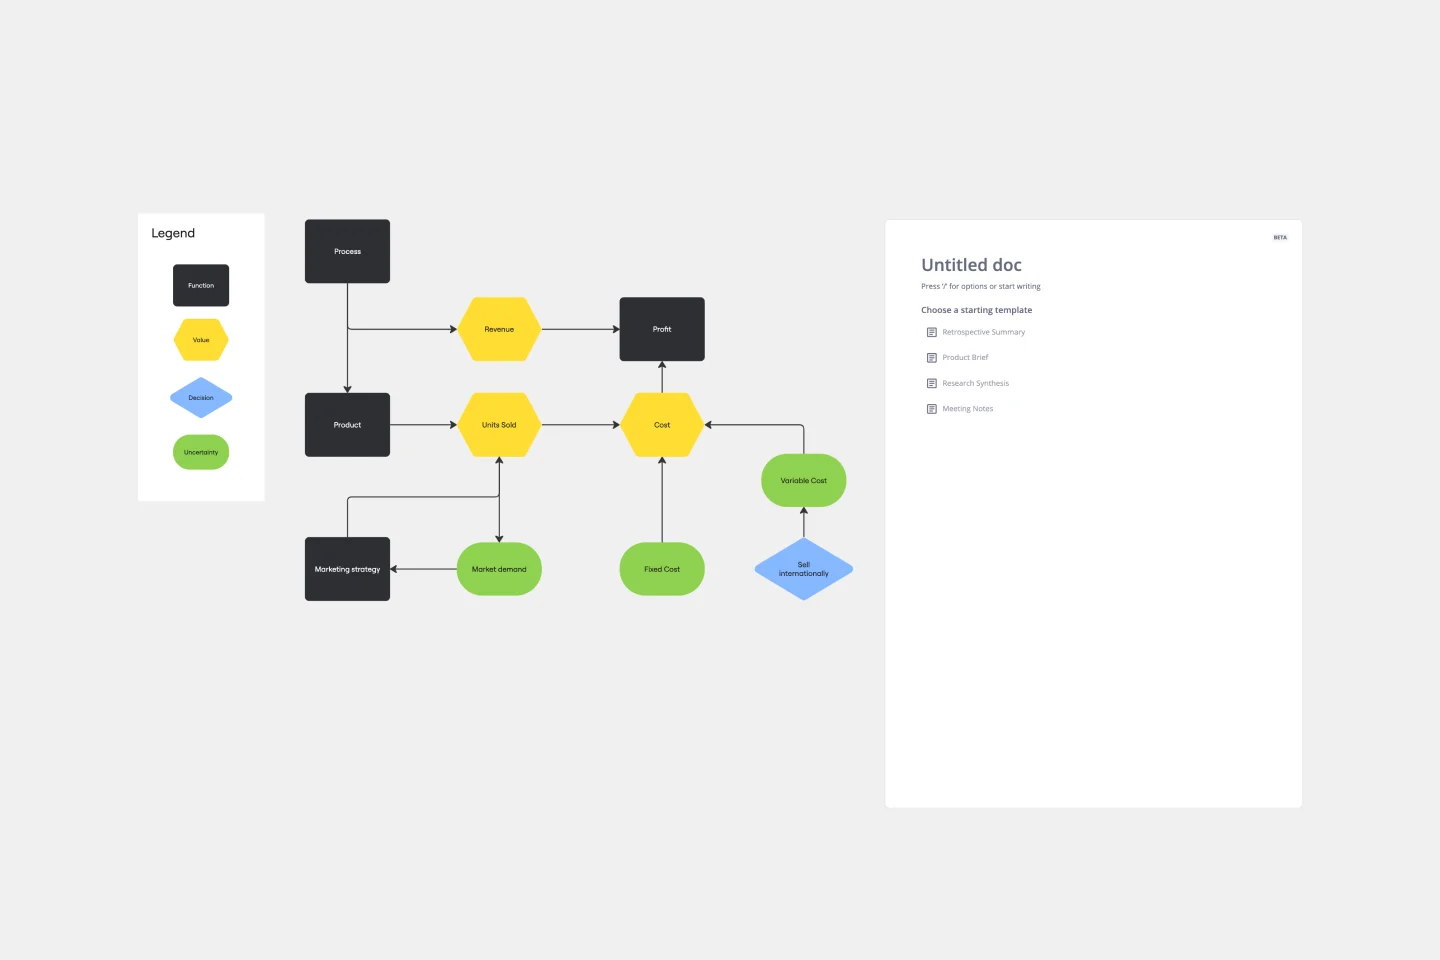
Influence Diagram Template
See the big picture of any business decision with this Influence Diagram Template. You’ll define the decision you have to make and brainstorm everything that could impact it. When you build connections between these factors, you’ll be able to put the right amount of weight into each one as you make your decision.
Concept Map Template
Concept Map Template
Use the concept map template to create new ideas, structure your thoughts, and bring your innovations to life. It allows you to explore connections between concepts and let your creativity flow in an organized format. As a result, you’re able to visualize how to bring your new ideas to reality and how various concepts relate to each other.
Context Diagram Template
Context Diagram Template
A context diagram is a perfect tool to view an entire system as a single process and understand how external factors interact with it. These external factors can include customers, developers, management, and more. The Context Diagram Template is your tool for creating this diagram.
Influence Diagram Template
Influence Diagram Template
See the big picture of any business decision with this Influence Diagram Template. You’ll define the decision you have to make and brainstorm everything that could impact it. When you build connections between these factors, you’ll be able to put the right amount of weight into each one as you make your decision.