
Simone Anne Slaviero
Creative Strategist & Learning Catalyst
🌟 10+ years exp untangling chaos through workshopping, service & ux design, product management, and learning & development (l&d) 🚀 Passionate about all things Miro related :D 🌟 Motivated by getting to know & understand people & culture, sustainable ways of living & working, and creating memorable moments
Categories
Similar templates
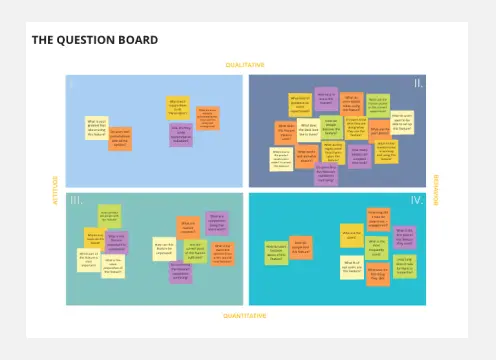
The Customer Question Board
450 likes
3.8K uses
Create a roadmap
0 likes
0 uses

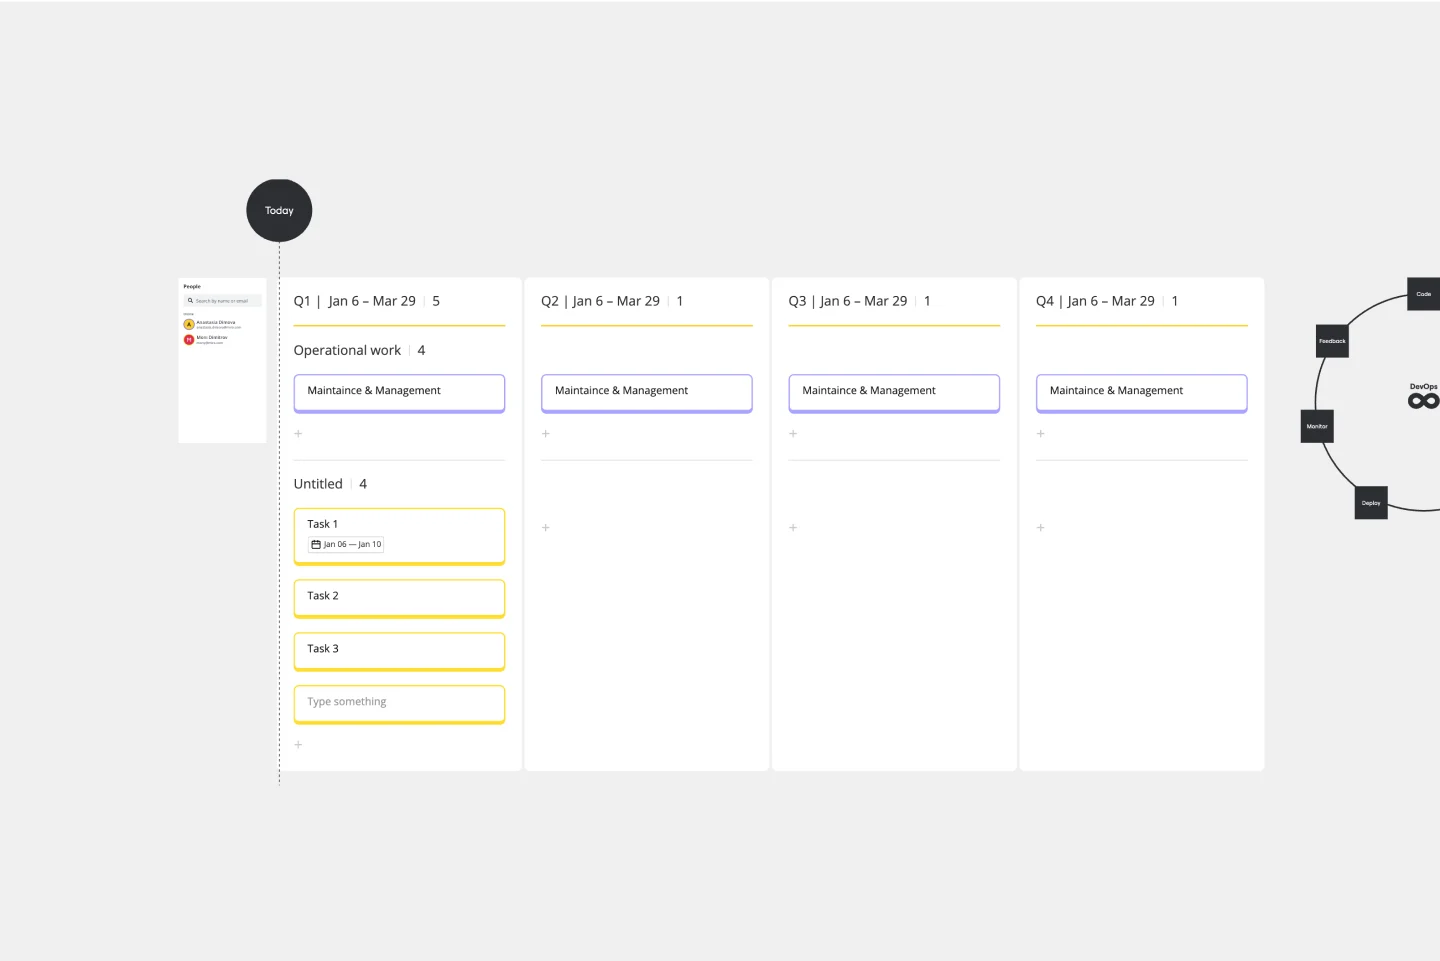
DevOps Roadmap Template
1 likes
28 uses
The Customer Question Board
450 likes
3.8K uses
Create a roadmap
0 likes
0 uses
DevOps Roadmap Template
1 likes
28 uses