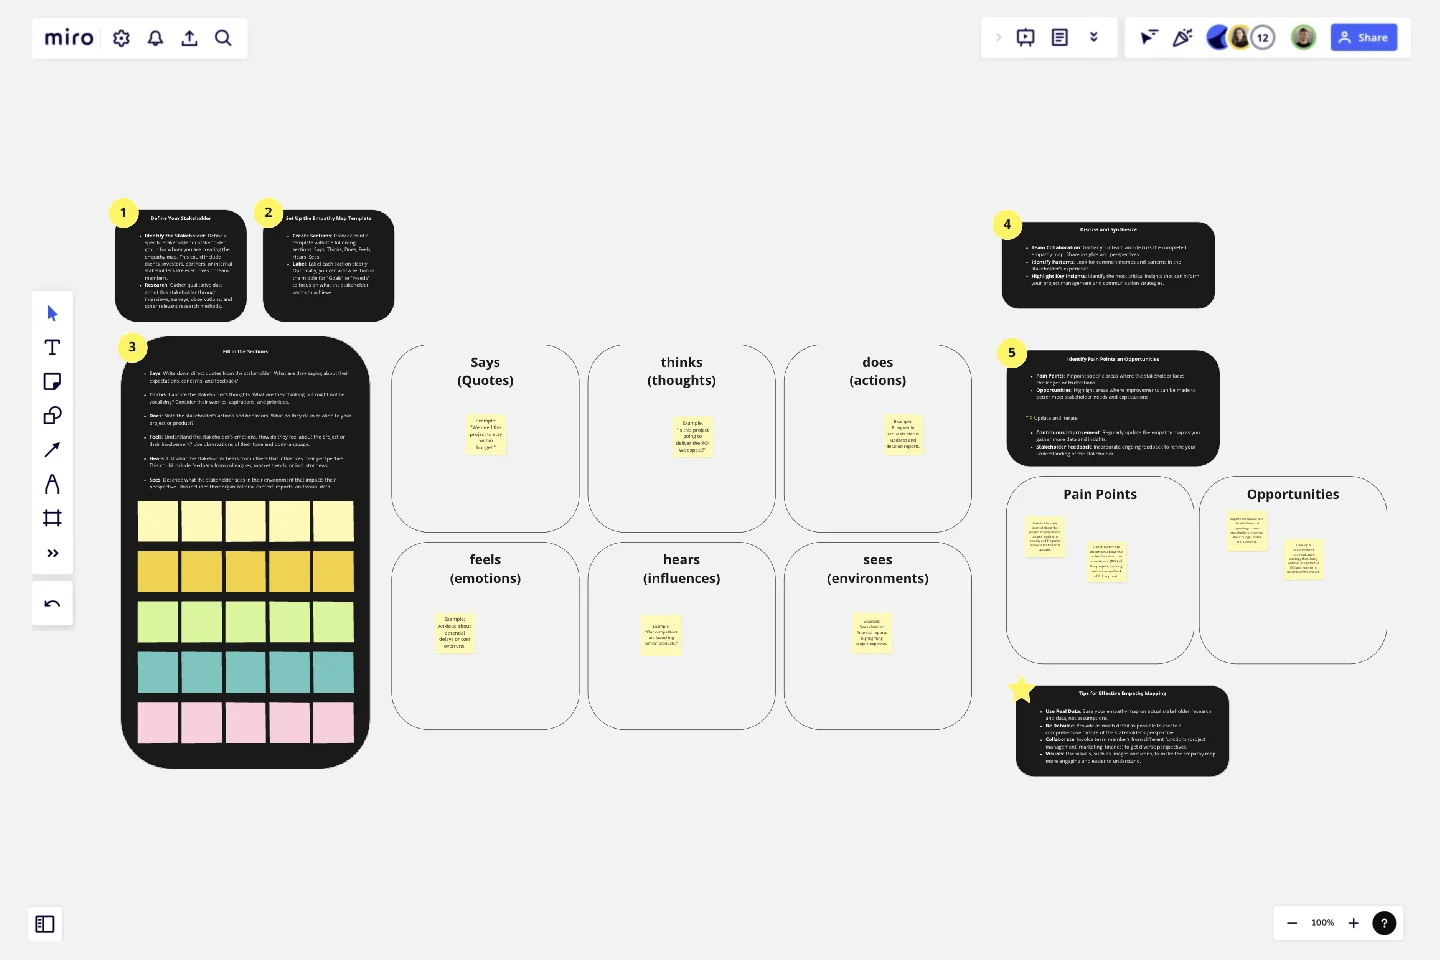
Empathy Map for Stakeholders
The Empathy Map for Stakeholders template is a strategic tool designed to help teams gain a deep understanding of their stakeholders' perspectives, needs, and concerns.
This template is particularly useful for aligning project goals with stakeholder expectations, enhancing communication, and fostering stronger relationships. It facilitates a stakeholder-centric approach, ensuring that project decisions and strategies are informed by stakeholder insights.
Sections of the Template
Says: Captures direct quotes and statements from the stakeholder about their expectations, concerns, and feedback.
Thinks: Encompasses the stakeholder's internal thoughts and reflections, including their worries, aspirations, and priorities.
Does: Observes and notes the stakeholder's actions and behaviors in relation to your project or product.
Feels: Identifies the emotional responses and feelings of the stakeholder, inferred from their tone and body language.
Hears: Records what the stakeholder hears from others that influences their perspective, such as feedback from colleagues, market trends, or industry news.
Sees: Describes the stakeholder's environment and visual context, including organizational context, reports, and visual data.
Why Use This Template?
Stakeholder-Centric Insights:
Benefit: Helps teams focus on the stakeholder’s perspective, leading to more relevant and aligned project strategies.
Outcome: Projects and initiatives that better meet stakeholder needs and expectations, enhancing overall support and engagement.
Improved Communication:
Benefit: Encourages clear and effective communication by providing a shared understanding of stakeholder insights.
Outcome: More cohesive and integrated project management efforts, reducing misunderstandings and fostering collaboration.
Identifying Pain Points and Opportunities:
Benefit: Enables teams to pinpoint specific stakeholder challenges and areas for improvement.
Outcome: Targeted actions that address stakeholder pain points, improving project outcomes and stakeholder satisfaction.
Actionable Insights:
Benefit: Translates qualitative data into clear, actionable insights that can drive project decisions.
Outcome: More informed and effective project strategies that are aligned with stakeholder needs.
Visual and Intuitive:
Benefit: The visual format makes it easy to understand and communicate stakeholder insights.
Outcome: Simplified and effective communication among team members and stakeholders, facilitating better decision-making.
The Empathy Map for Stakeholders template is an essential tool for any team looking to create stakeholder-centered projects and initiatives. By leveraging this template, teams can gain a deeper understanding of their stakeholders, enhance communication, and drive more effective and impactful project decisions.
This template was created by Anthony.
Get started with this template right now.
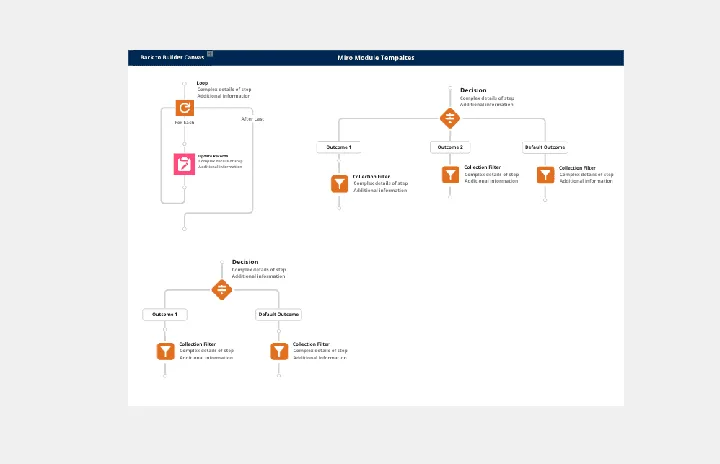
Salesforce Flow Builder
Works best for:
Flowcharts, Mapping, Diagrams
The Salesforce Flow Builder template offers a visual tool for designing and automating business processes within the Salesforce platform. It provides elements for creating flowcharts that represent process flows, decision logic, and data transformations. This template enables Salesforce administrators and developers to streamline workflows, improve productivity, and enhance user experiences. By promoting automation and efficiency in Salesforce process design, the Salesforce Flow Builder empowers organizations to leverage the full potential of the Salesforce platform and drive business success effectively.
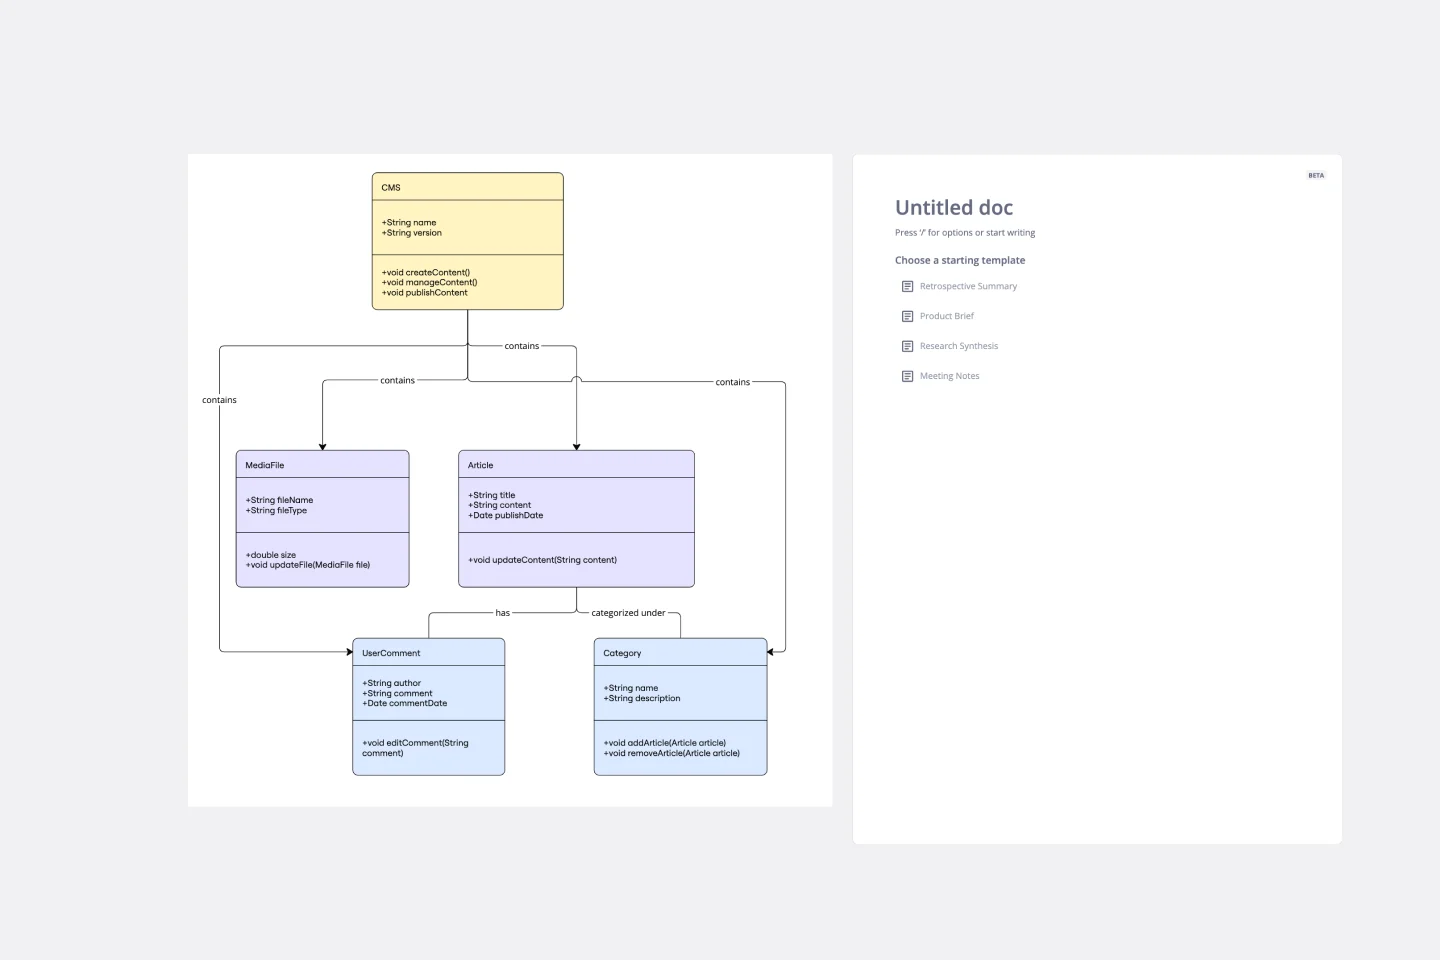
UML Class Content Management System (CMS) Template
Works best for:
UML
The UML Class Content Management System CMS Template simplifies documenting and designing the architecture of a Content Management System. It allows for the creation of UML class diagrams to visualize the structure of a CMS. Teams can efficiently map out key classes and their interactions, such as how users create, manage, and publish digital content. The template's integration into Miro's collaborative platform allows for real-time teamwork, customization, and easy sharing of feedback. This streamlines the documentation process and is valuable for software development projects aiming to develop or refine a CMS.
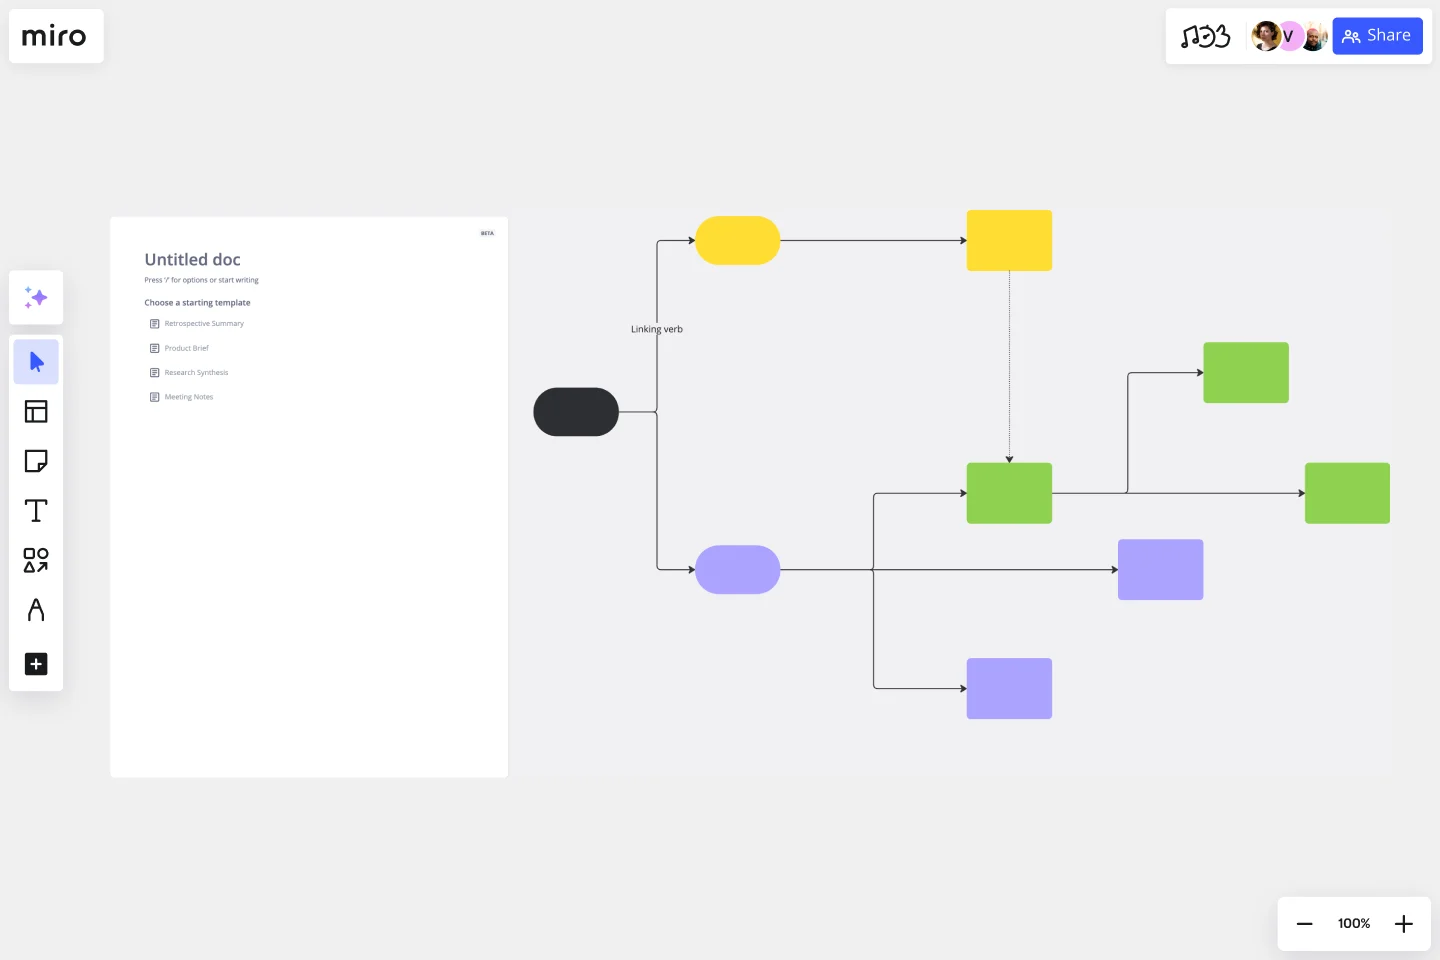
Concept Map Template
Works best for:
Education, Mapping, Brainstorming
Use the concept map template to create new ideas, structure your thoughts, and bring your innovations to life. It allows you to explore connections between concepts and let your creativity flow in an organized format. As a result, you’re able to visualize how to bring your new ideas to reality and how various concepts relate to each other.
Product Roadmap Canvas Template
Works best for:
Roadmap, Mapping, Planning
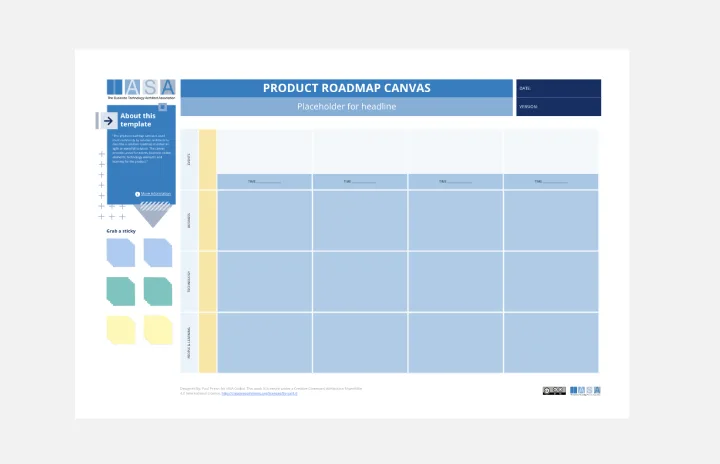
The IASA - Product Roadmap Canvas template offers a holistic view of product development by integrating key elements such as customer needs, business goals, and technology requirements. By utilizing this canvas, teams can align their product strategy with market demands and ensure that development efforts are focused on delivering maximum value to customers.
Value Stream Mapping Template
Works best for:
Project Management, Strategic Planning, Mapping
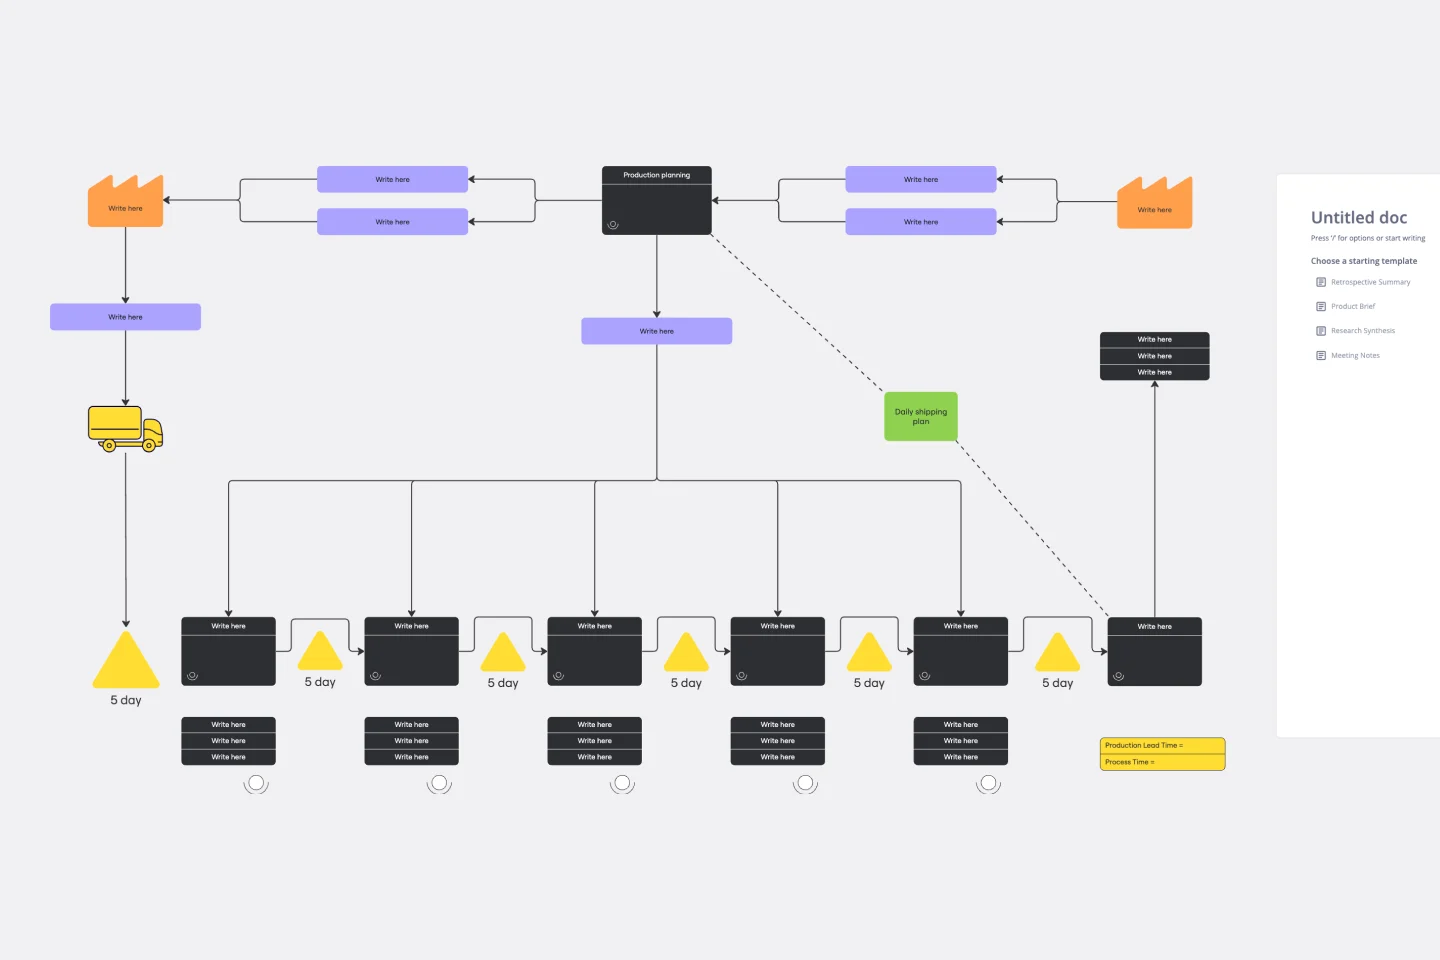
A value stream map can help you refocus your business on steps that actually provide value to your customers, cutting out wasteful and inefficient processes. With this template, you and your process team can collaborate on a value stream map today.
Detailed Empathy Map With Personas
Works best for:
Empathy Map
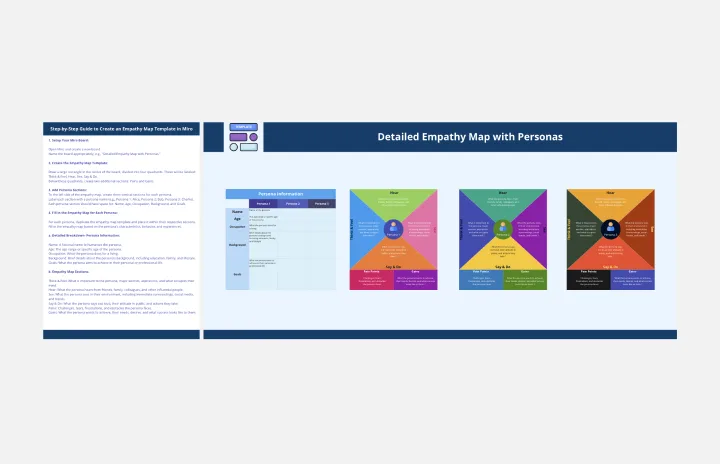
Understand your audience better with the Empathy Map Personas template. This tool helps you capture insights into your customers' needs, thoughts, feelings, and behaviors. By visualizing these personas, you can tailor your product development, marketing strategies, and customer interactions to better meet their needs and enhance user satisfaction. Ideal for teams focused on customer-centric solutions.