Double Bubble Map Template
Unlock the potential of visual thinking and enhance your team's collaboration with Miro's double bubble map template. Explore the endless possibilities for brainstorming, problem-solving, and ideation.
About the Double Bubble Map Template
Brainstorm, analyze, and compare ideas or concepts in a structured and engaging way with Miro's double bubble map template. Whether planning a project, facilitating a discussion, or organizing your thoughts, this template enables creativity and clarity within your team.
What's a double bubble map template?
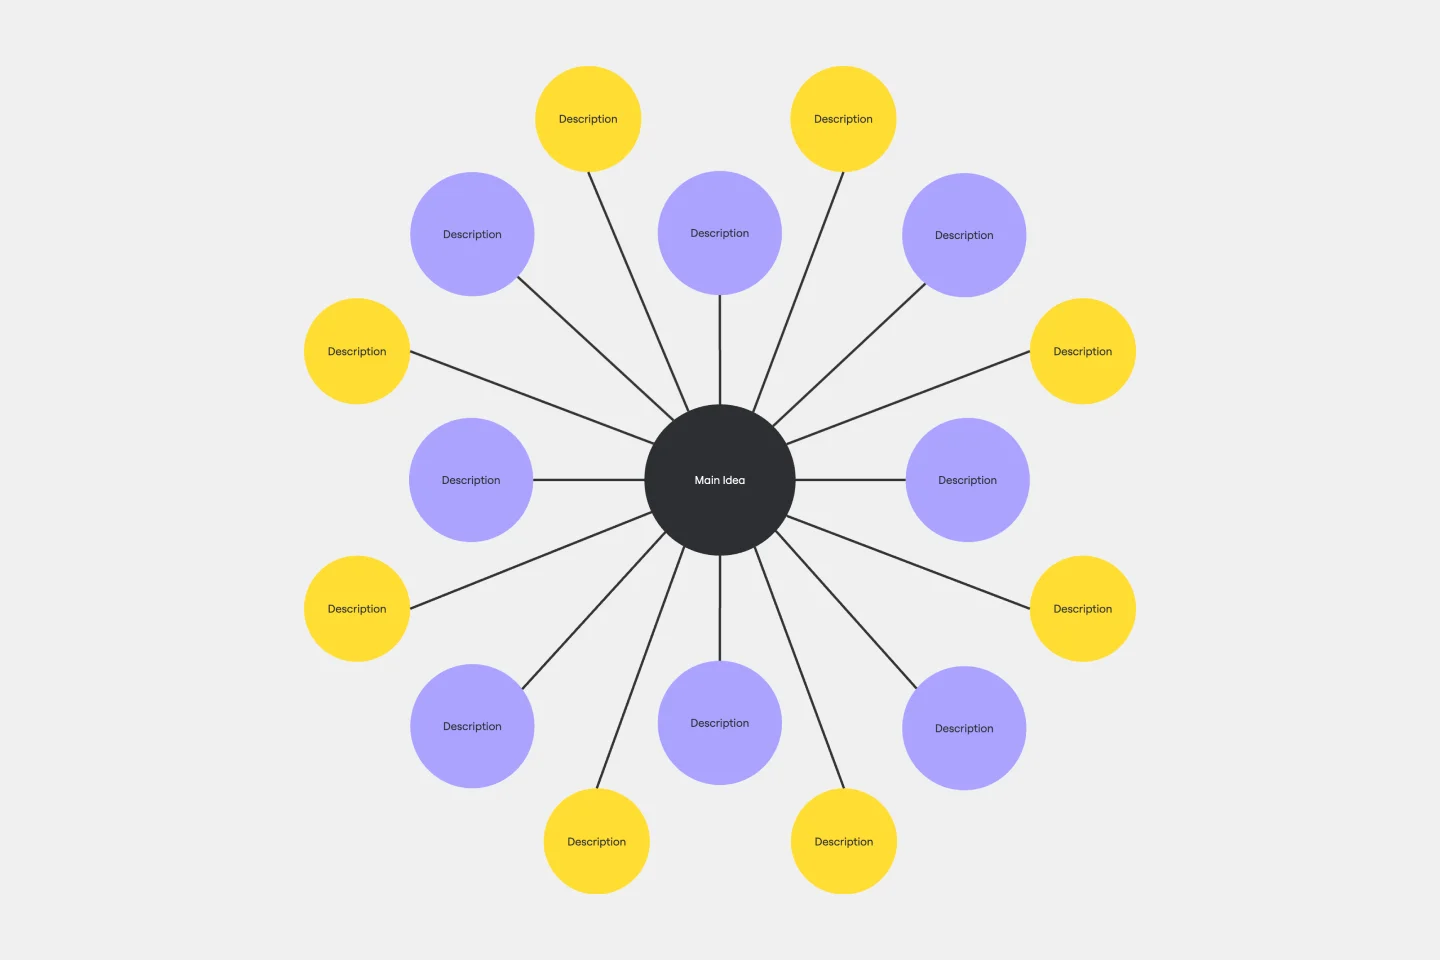
A double bubble map template is a visual diagramming tool that allows teams to explore relationships and connections between central ideas or concepts. It consists of two interconnected bubbles, each representing one of the main ideas. Lines and connecting elements extend from these bubbles to show the ideas' relationships, similarities, and differences. This template is a dynamic framework for brainstorming, organizing information, and gaining insights into complex topics by visualizing how ideas interrelate.
Benefits of using the double bubble map template
Enhanced clarity: The double bubble map helps teams clarify their thoughts and ideas by visually representing the connections between two central concepts. This clarity minimizes misunderstandings and ensures everyone is on the same page.
Efficient brainstorming: It fosters efficient brainstorming sessions, encouraging teams to explore the intersections of ideas and identify potential areas of synergy or conflict.
Improved decision-making: Teams can make more informed decisions by using the template to weigh the pros and cons of different options, making it a valuable tool for problem-solving.
Effective communication: Visualizing complex relationships makes communicating ideas within the team and with stakeholders easier, promoting effective collaboration.
Customization: Miro's double bubble map template is highly customizable, allowing teams to adapt it to their specific needs and preferences.
How to use the double bubble map template in Miro
Creating a double bubble map diagram in Miro is a breeze:
Add the template: Search the Miro Template Library for the "Double Bubble Map Template." Click to add it to your board.
Customize your map: Double-click on the bubbles to add your central ideas. Use Miro's drawing tools and connectors to visualize the relationships and details.
Collaborate with others: Share the board link with your team members and collaborate in real time, whether in the same room or working remotely. Discuss, share, and refine your ideas quickly with Miro's bubble map maker.
Can I add more than two central ideas to the double bubble map template?
The double bubble map template in Miro is primarily designed for comparing two main ideas. However, you can create multiple templates within a board to effectively compare more than two concepts.
Can I export or print my double bubble map for offline use?
Yes, you can export your double bubble map as an image or PDF from Miro, making it easy to share or print for offline reference.
Are there collaboration restrictions on the double bubble map template in Miro?
No, Miro allows real-time collaboration for all users on a board, so your team can work together seamlessly on your double bubble map.
Get started with this template right now.
Cloudflare Automatic Captioning for Video Template
The Cloudflare Automatic Captioning for Video Template in Miro is a powerful tool designed to enhance the accessibility and engagement of video content. By leveraging Cloudflare's technology, this template helps outline the captioning process for videos. It not only makes content accessible to a broader audience, including those who are deaf or hard of hearing but also boost viewer engagement by making videos consumable in sound-sensitive environments or by individuals who prefer reading along.
Intent to Outcome Diagram
Works best for:
Diagramming
The Intent to Outcome Diagram template is a visual tool for mapping out the relationship between desired outcomes and the actions required to achieve them. It provides a structured framework for defining intentions, outcomes, and key activities. This template enables teams to align on goals, track progress, and identify areas for improvement. By promoting clarity and alignment, the Intent to Outcome Diagram empowers organizations to set strategic direction and drive results effectively.
ERD Supply Chain Management System Template
Works best for:
ERD
The ERD Supply Chain Management System Template streamlines and optimizes supply chain operations. It serves as a visual support that helps businesses understand and manage the complex relationships between different entities within their supply chain, such as suppliers, products, inventory, orders, and shipments. By providing a clear visualization of these relationships, the template enables users to identify inefficiencies and areas for improvement, facilitating strategic decision-making.
Bracket Template
Works best for:
Diagramming
The Bracket Template is a dynamic visualization tool that helps to organize and rank ideas, entities, or teams in a sequential and competitive manner. It is structured like a tree, starting with multiple entries on either side, which then face off in successive rounds, leading to a single winner or conclusion. One of its standout benefits is its ability to simplify complex decision-making processes. Breaking down choices into smaller, head-to-head comparisons, makes the path to a final decision clearer, ensuring clarity and fostering engagement among participants. Moreover, the Bracket Template is particularly useful when there are multiple options to consider and when there is a need to compare and contrast those options. It is an effective way to streamline decision-making, making it easier and more efficient.
Cross-Account EC2 Status Monitoring for HPC Clusters Template
Works best for:
AWS
The Cross-Account EC2 Status Monitoring for HPC Clusters Template provides a centralized view of the health and performance of EC2 instances across multiple AWS accounts. It helps in early issue detection, reducing downtime and ensuring optimal efficiency of HPC clusters. The template offers customization options to meet specific HPC cluster configurations, simplifying monitoring and improving operational efficiency for administrators.
Interrelationship Diagram
Works best for:
Diagramming
The Interrelationship Diagram template is a visual tool for analyzing and illustrating complex relationships between variables or elements within a system. It provides a structured framework for mapping out connections, dependencies, and interactions. This template enables teams to visualize patterns, identify causal relationships, and uncover insights into system behavior. By promoting systems thinking and understanding of interdependencies, the Interrelationship Diagram empowers organizations to make informed decisions and drive effective solutions to complex problems.