About the DMAIC template
From software development to manufacturing, the DMAIC Template helps project teams improve their processes. While it’s part of the Six Sigma initiative (a method for improving the manufacturing process), it’s now widely adopted as a quality improvement procedure.
Using this five-step framework, you can identify and address inefficiencies in processes across your entire business. As a result, you’ll improve the quality of your deliverables and help your business get better results.
What is a DMAIC analysis?
DMAIC is an acronym for Define, Measure, Analyze, Improve, and Control. Performing a DMAIC analysis allows businesses to do the following:
Improve existing processes
Identify new processes
Perform structured change management
A DMAIC analysis is a data-driven quality strategy. It strongly emphasizes measurement and analysis, helping companies identify process improvement initiatives based on real data. This makes sure that any changes have the most positive impact on the business.
The 5 factors of DMAIC
To better understand the DMAIC process, let’s outline the five main steps in more detail. To perform a successful DMAIC analysis, you must follow the process steps in this order.
1. Define: Start by defining your team’s project, problems, and goals. Be as specific as possible. The more specific you are, the easier it’ll be to solve each concrete problem and complete the project. You can use the SMART goals template to make sure your project goals are specific, and take a look at this Problem Framing Template to identify your challenges. You should also outline your project scope in a project charter to clearly display all the key project information.
2. Measure: During the Measure phase, you need to figure out how to measure the solution. What key metrics can you track? How will you know whether you have succeeded? You need these in place to track progress and measure success.
3. Analyze: With your measurements in place, it’s time to analyze the data. This will help you identify the root cause of your problem. Start by listing and prioritizing potential causes of the problem. Then, prioritize root causes (or key process inputs) and identify how they affect outputs. You can use process maps to analyze your existing processes better.
4. Improve: By the time you reach this step, you’ll probably already have a possible solution to your process. Now, it’s time to visualize how it’ll pan out. Review the solutions and anticipate how each of them will perform. If you find potential consequences, you might have to go back to the Measure or Analyze steps. If things look good, take the necessary steps to improve your process.
5. Control: After the Improve stage, you need to Control the process. Monitor the improvements and adjust as needed to ensure continued and sustainable success.
Although DMAIC may be sequential, it’s not always linear. For example, if you get to the Improve stage and realize that your solutions aren’t viable, you’ll have to backtrack to a previous stage.
This is where using a template can be helpful. You can easily track the process and visualize everything in one location. If you need to go back or make changes to the process, it’s easy to do.
Why use a DMAIC Template?
A DMAIC analysis is complex. There are a lot of moving parts to analyze and different solutions to contend with.
A DMAIC Template makes the process easier to manage. Here’s how:
Easily identify opportunities. The clear structure and format of a DMAIC Template make it easier to spot areas of improvement and opportunities for the future.
Standardize the process. Create consistency across the business by using the same template. This makes it easier for everyone in the business to perform a DMAIC analysis and fully understand the process.
Display information professionally. If you need to share your findings with key stakeholders or clients, using a professional and visually-appealing template gives them a good impression. It also helps them understand the analysis and visualize your plan of action.
Increase efficiency. Instead of creating a document from scratch, a ready-made template allows you to get straight into identifying areas for improvement. You’ll spend less time figuring out how to design the analysis and more time doing it.
Create a DMAIC analysis with Miro
Miro’s digital workspace is the perfect location for collaborative teams to plan and share new ideas. Using our DMAIC template, you can easily share your analysis and identify the best process improvements with your team.
Here’s how it works:
Step 1: Select this template. Get started by selecting this DMAIC template. It’s free to use, and you can easily customize it to your team’s specific needs. Drag and drop items, add new text, or upload your own files and visuals.
Step 2: Add the relevant information. Populate the template with all the information you have from your DMAIC analysis. You can add charts, images, and any other relevant information.
Step 3: Share the template with your team. Get your team involved in the process and share the template. They can access the template from anywhere and add visual notes with questions or feedback.
Step 4: Collaborate and make changes. If your team has any feedback, dedicate some time to discussing their thoughts. When you’re all on the same page, make any necessary changes to the analysis.
Step 5: Create a plan of action. With your DMAIC analysis in place, it’s time to use action plan templates and create an action plan for the future. This will outline how you plan to make improvements to your processes.
Connect teams, optimize business processes, and scale your organization with Miro's process mapping tool.
DMAIC Template FAQs
Who should use DMAIC?
A Project Manager usually uses DMAIC to improve project processes. Ultimately, anyone that wants to improve their business processes can use it.

Miro
Your virtual workspace for innovation
Miro is an innovation workspace designed for teams of every size, everywhere, to dream, design, and build the future together. Our mission? To empower these teams to create the next big thing, powered by AI at every step of the way. Over 90 million users around the world rely on Miro to untangle complex ideas, put customer needs first, and deliver products and services faster. All supported by best-in-class security, compliance, and scalability.
Categories
Similar templates
Balanced Scorecard Template
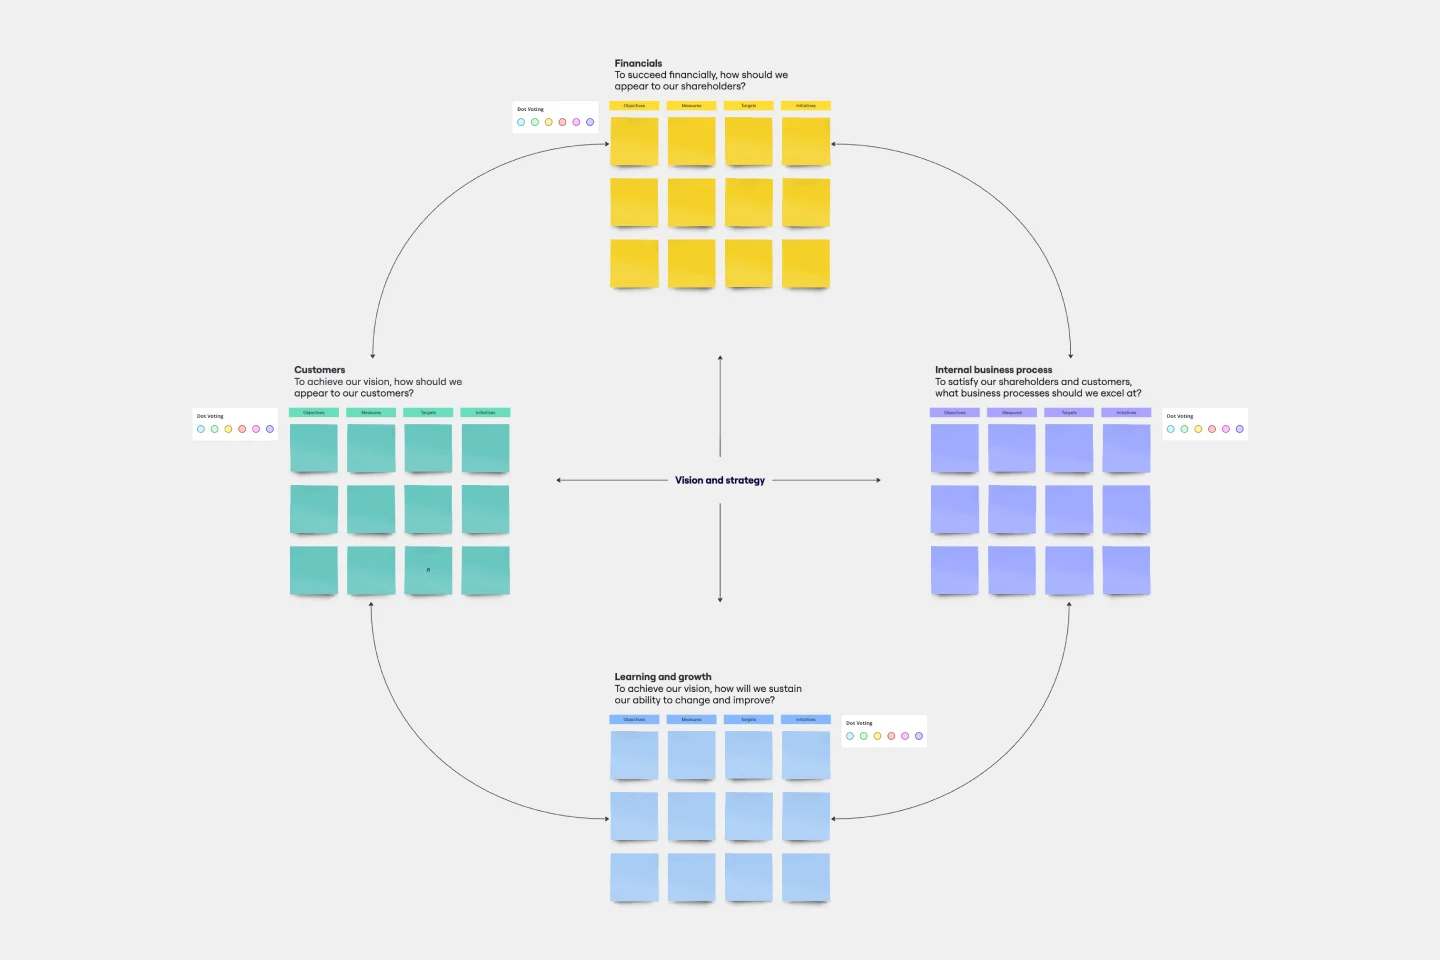
Balanced Scorecard Template
Balanced scorecards are useful tools for understanding business performance at a glance with regard to customers, employees, business processes, and financial progress. Learn more about BSCs and create your own using Miro’s Balanced Scorecard template.
Go-to-Market GTM Template | Miro
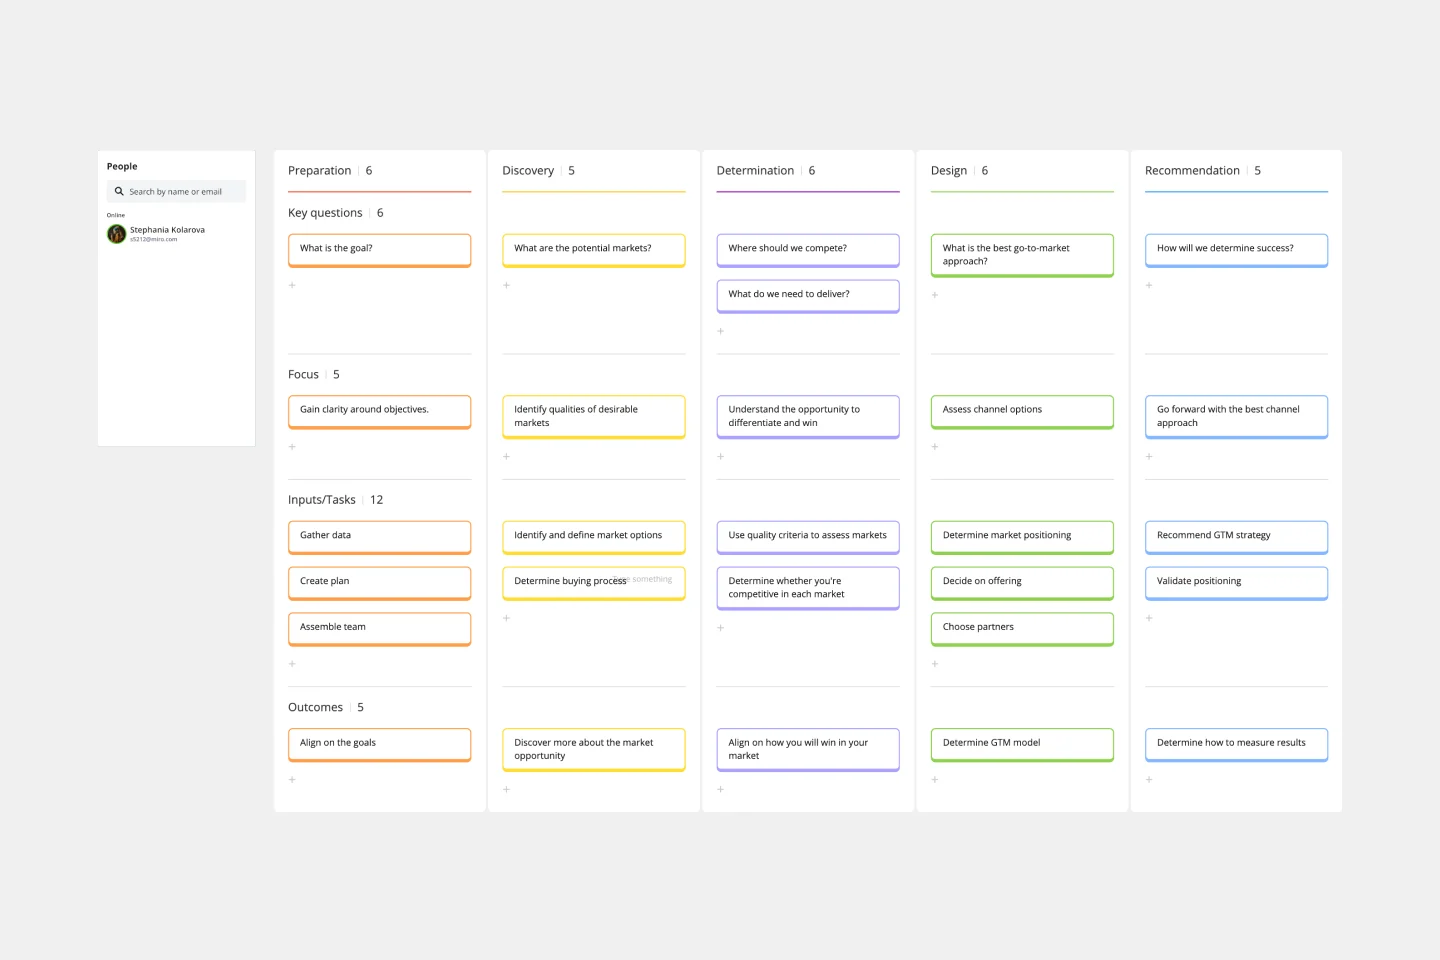
Go-to-Market GTM Template | Miro
It doesn’t matter how innovative or effective a new product is — if it doesn’t get noticed and adopted by the right audience, the product won’t get off the ground. That’s where your Go-to-Market Strategy comes in. It’s a single resource that houses all of your research, insights, and data, and includes your business plan, target audience, marketing approach, and sales strategy. A GTM is especially important for any startups who grow fast, have to make split-second decisions, and have to be fully in sync.
Strategy Diamond Template
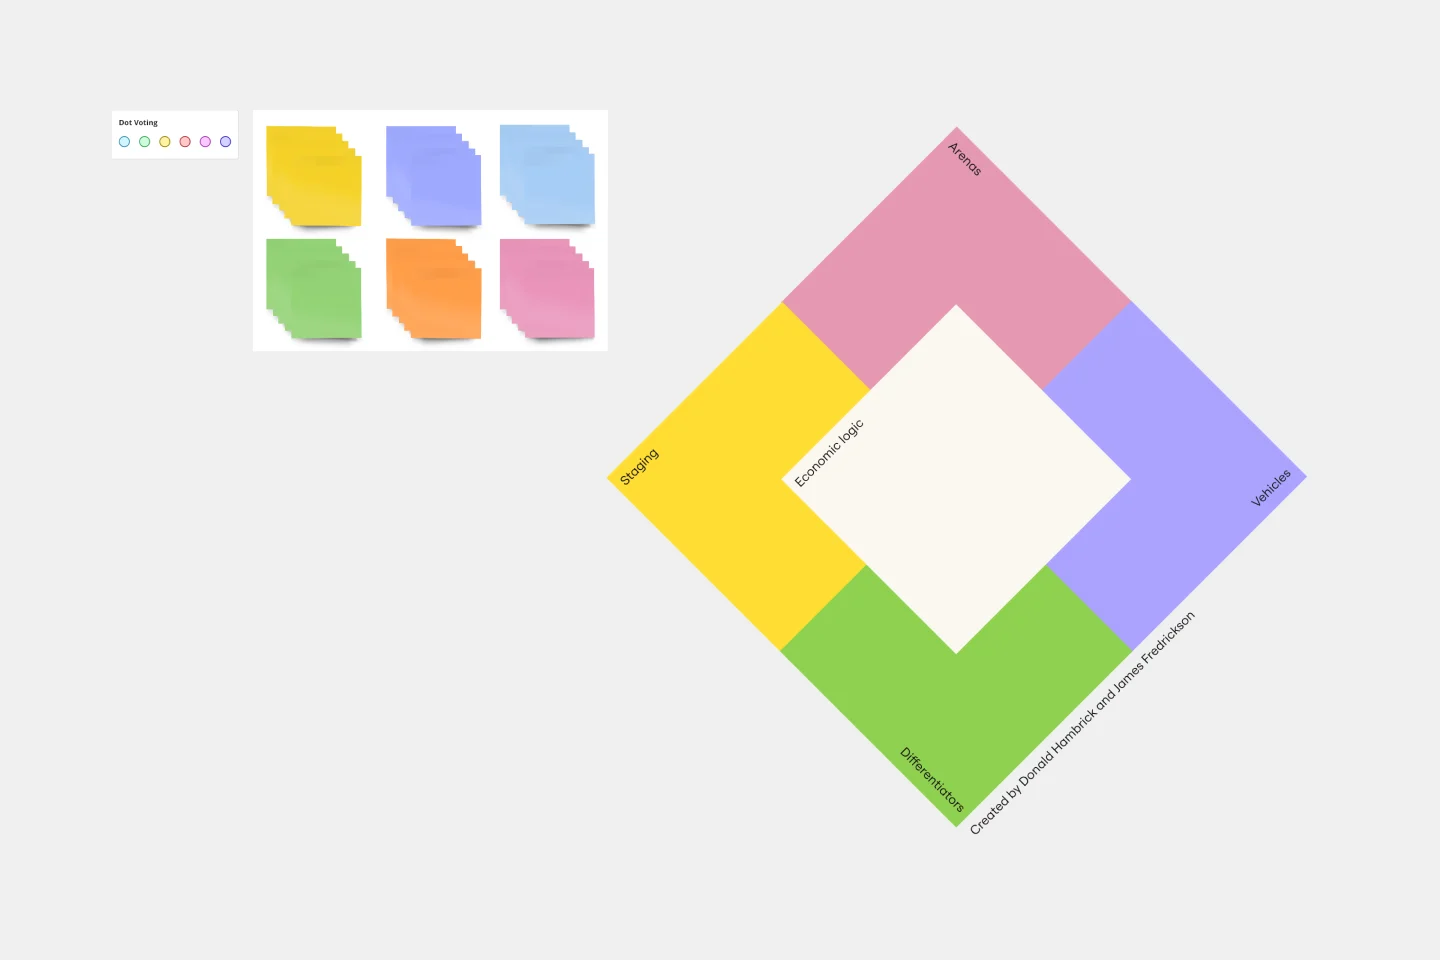
Strategy Diamond Template
To achieve key objectives, every business assembles a series of strategies. But what elements should you consider when building a strategy? A strategy diamond is a collection of elements forming a coherent business strategy. These elements include: Arenas, Differentiators, Vehicles, Staging, and Economic Logic. Most strategic plans focus on just one or two of these elements, creating gaps that might cause problems for your business later on. A strategy diamond can help you stay focused and ensure you’re fulfilling all of your business’s needs rather than one or two.
Disney Creative Strategy Template
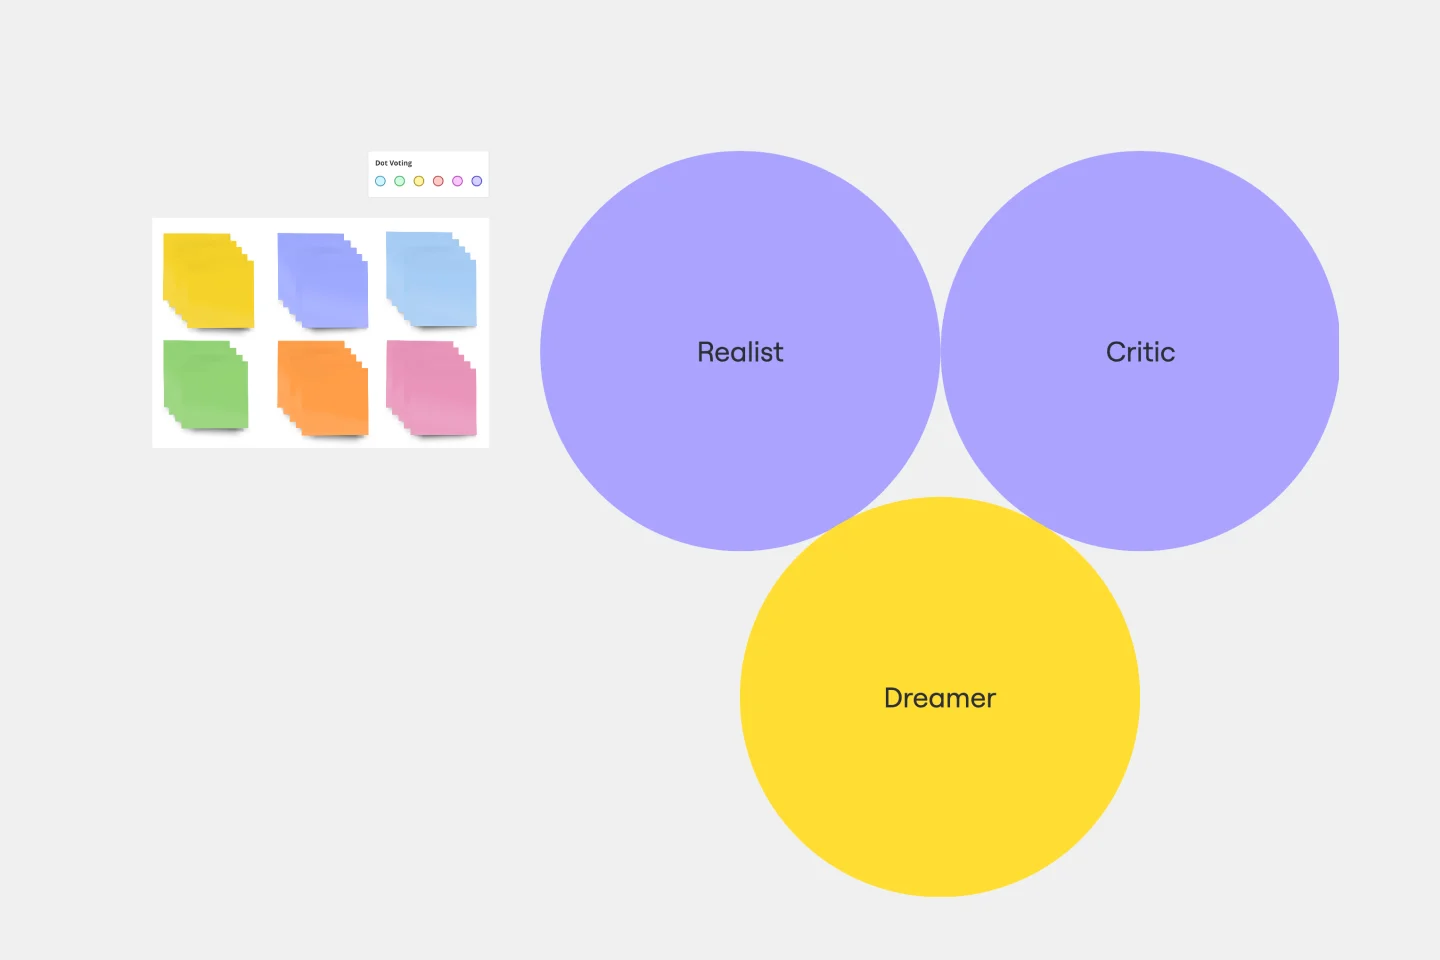
Disney Creative Strategy Template
Know who knew a little something about coming up with ideas that set imaginations alight? Walt Disney. And he inspired the Disney Creative Strategy, an approach that establishes three types of thinkers—dreamers, realists, and critics—and gives each the space to do clear thinking. Your team will go through an engaging exercise of adopting the three mindsets, where they’ll focus on a specific aspect of the idea. The Disney Creative Strategy has a way of yielding brilliant ideas and great products. That’s why it’s used successfully by organizations of all kinds and sizes.
Balanced Scorecard Template
Balanced Scorecard Template
Balanced scorecards are useful tools for understanding business performance at a glance with regard to customers, employees, business processes, and financial progress. Learn more about BSCs and create your own using Miro’s Balanced Scorecard template.
Go-to-Market GTM Template | Miro
Go-to-Market GTM Template | Miro
It doesn’t matter how innovative or effective a new product is — if it doesn’t get noticed and adopted by the right audience, the product won’t get off the ground. That’s where your Go-to-Market Strategy comes in. It’s a single resource that houses all of your research, insights, and data, and includes your business plan, target audience, marketing approach, and sales strategy. A GTM is especially important for any startups who grow fast, have to make split-second decisions, and have to be fully in sync.
Strategy Diamond Template
Strategy Diamond Template
To achieve key objectives, every business assembles a series of strategies. But what elements should you consider when building a strategy? A strategy diamond is a collection of elements forming a coherent business strategy. These elements include: Arenas, Differentiators, Vehicles, Staging, and Economic Logic. Most strategic plans focus on just one or two of these elements, creating gaps that might cause problems for your business later on. A strategy diamond can help you stay focused and ensure you’re fulfilling all of your business’s needs rather than one or two.
Disney Creative Strategy Template
Disney Creative Strategy Template
Know who knew a little something about coming up with ideas that set imaginations alight? Walt Disney. And he inspired the Disney Creative Strategy, an approach that establishes three types of thinkers—dreamers, realists, and critics—and gives each the space to do clear thinking. Your team will go through an engaging exercise of adopting the three mindsets, where they’ll focus on a specific aspect of the idea. The Disney Creative Strategy has a way of yielding brilliant ideas and great products. That’s why it’s used successfully by organizations of all kinds and sizes.