About the Dichotomous Key Template
When dealing with complex subjects, a methodical and analytical approach is often necessary to unlock their mysteries. The dichotomous key template is a tool that simplifies these complexities by providing a step-by-step methodology to distinguish and categorize items based on a series of choices. This template is an invaluable educational and analytical tool that serves as an interactive guide through the maze of similar-looking entities. It can be used in biology for species identification or in any discipline that benefits from binary decisions.
How to use the dichotomous key template in Miro
Start with the basics: Open the template and begin by labeling the first decision point with a clear, concise question.
Make it your own: Click to edit any text box to enter questions and outcomes that are relevant to your subject matter.
Expand your key: If your content requires additional branches, simply drag and drop shapes or lines from the toolbar to extend the decision path.
Automate diagramming: Utilize automated diagramming features to maintain a clean, organized layout as your key grows in complexity.
Add context: Integrate images, links, or other artifacts by placing them onto your board to give deeper context to each decision point.
Editing and customizing the template is a breeze. Within a few clicks, the framework can be tailored to suit a wide array of scenarios while maintaining a clear and navigable structure.
Why should you use a dichotomous key template?
Enhance learning: It offers an interactive way to engage with material, making learning fun and more effective.
Improve accuracy: Breaking down complex identifications into simple yes/no questions minimizes errors.
Save time: It streamlines the process of categorization, allowing for quick decision-making.
Flexibility: Whether for educational purposes or to streamline workflow, the template is versatile and can be adapted to any set of criteria.
Collaborative: It supports collaborative efforts, allowing teams to contribute to and view the decision-making process in real time.
If you prefer to start from scratch, Miro's diagramming capabilities and tree diagram builder can help you create a dichotomous key in no time. Collaborate with others in real-time or async as you build out your dichotomous key.
Dichotomous Key Template FAQs
Can the dichotomous key template handle more than biological classifications?
Absolutely. While traditionally used in biology, the template is designed to be a versatile tool for any categorization or decision-making process.
Is the template suitable for team collaboration?
Yes, the template supports real-time collaboration, making it perfect for teams to work together in mapping out decision trees and categorization keys.
How do I know if my dichotomous key is complete?
A key is complete when each branch leads to a conclusive outcome and all items have been classified without ambiguity.
What if I need to revise my dichotomous key?
The template is fully editable. You can easily adjust the questions, add branches, or refine the outcomes as your understanding of the categorized items evolves.

Miro
Your virtual workspace for innovation
Miro is an innovation workspace designed for teams of every size, everywhere, to dream, design, and build the future together. Our mission? To empower these teams to create the next big thing, powered by AI at every step of the way. Over 90 million users around the world rely on Miro to untangle complex ideas, put customer needs first, and deliver products and services faster. All supported by best-in-class security, compliance, and scalability.
Categories
Similar templates
Cross Functional Flowchart
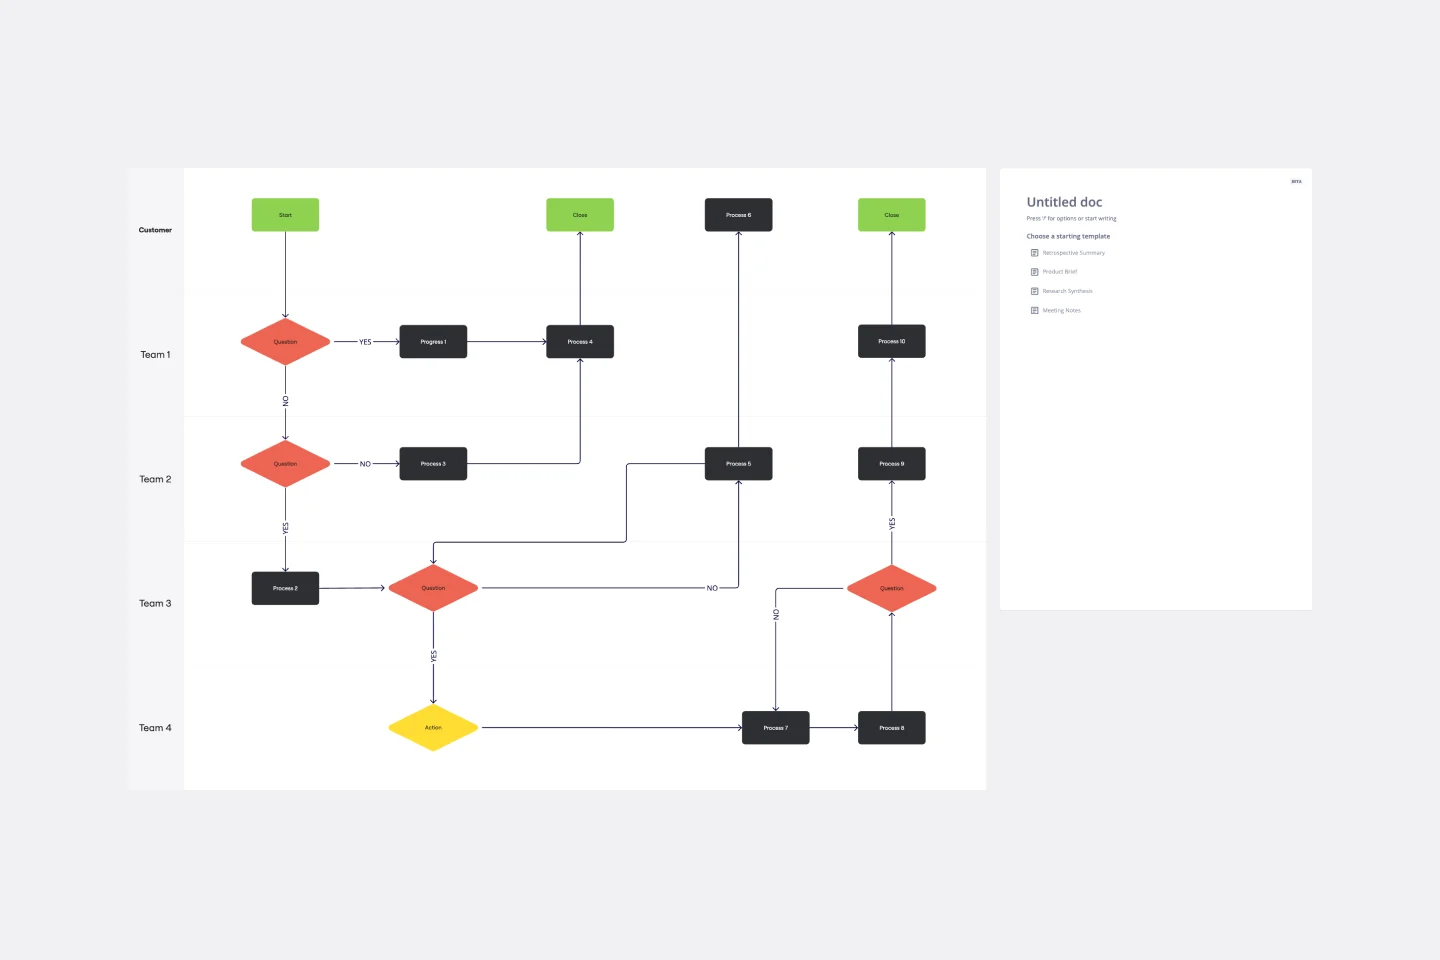
Cross Functional Flowchart
Have a quick look at everyone on a project and see exactly what they’ll contribute. That’s the clarity and transparency a cross-functional flowchart will give you. These are also called “swim lane” flowcharts because each person (each customer, client, or representative from a specific function) is assigned a lane—a clear line—that will help you visualize their roles at each stage of the project. This template will empower you to streamline processes, reduce inefficiencies, and make meaningful cross-functional relationships.
Website Flowchart Template
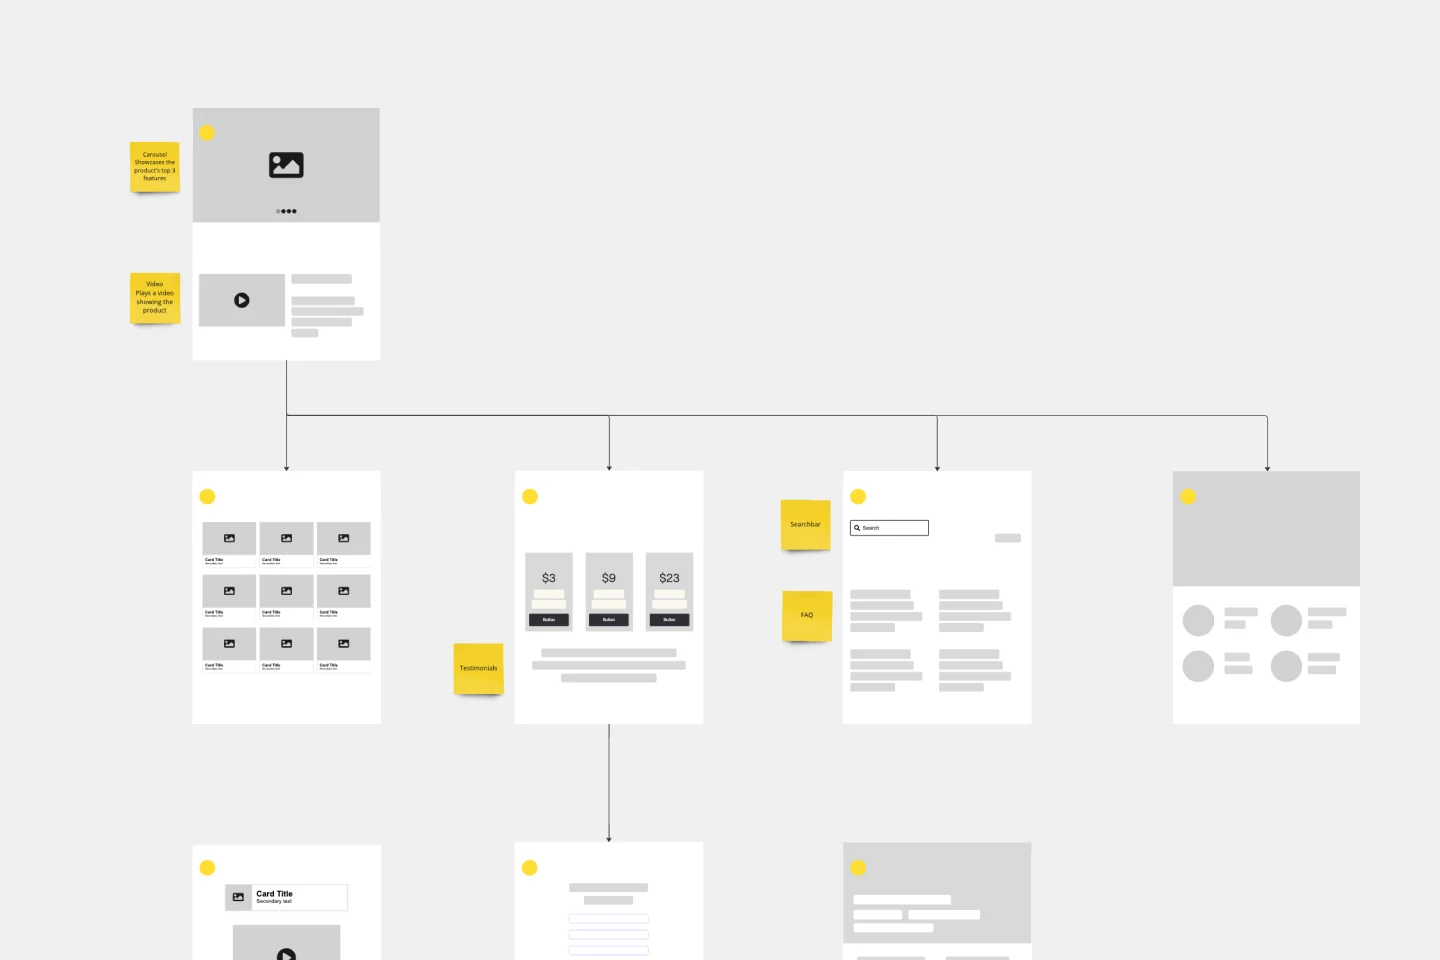
Website Flowchart Template
A website flowchart, also known as a sitemap, maps out the structure and complexity of any current or future website. The flowchart can also help your team identify knowledge gaps for future content. When you’re building a website, you want to ensure that each piece of content gives users accurate research results based on keywords associated with your web content. Product, UX, and content teams can use flowcharts or sitemaps to understand everything contained in a website, and plan to add or restructure content to improve a website’s user experience.
Algorithm Flowchart Template
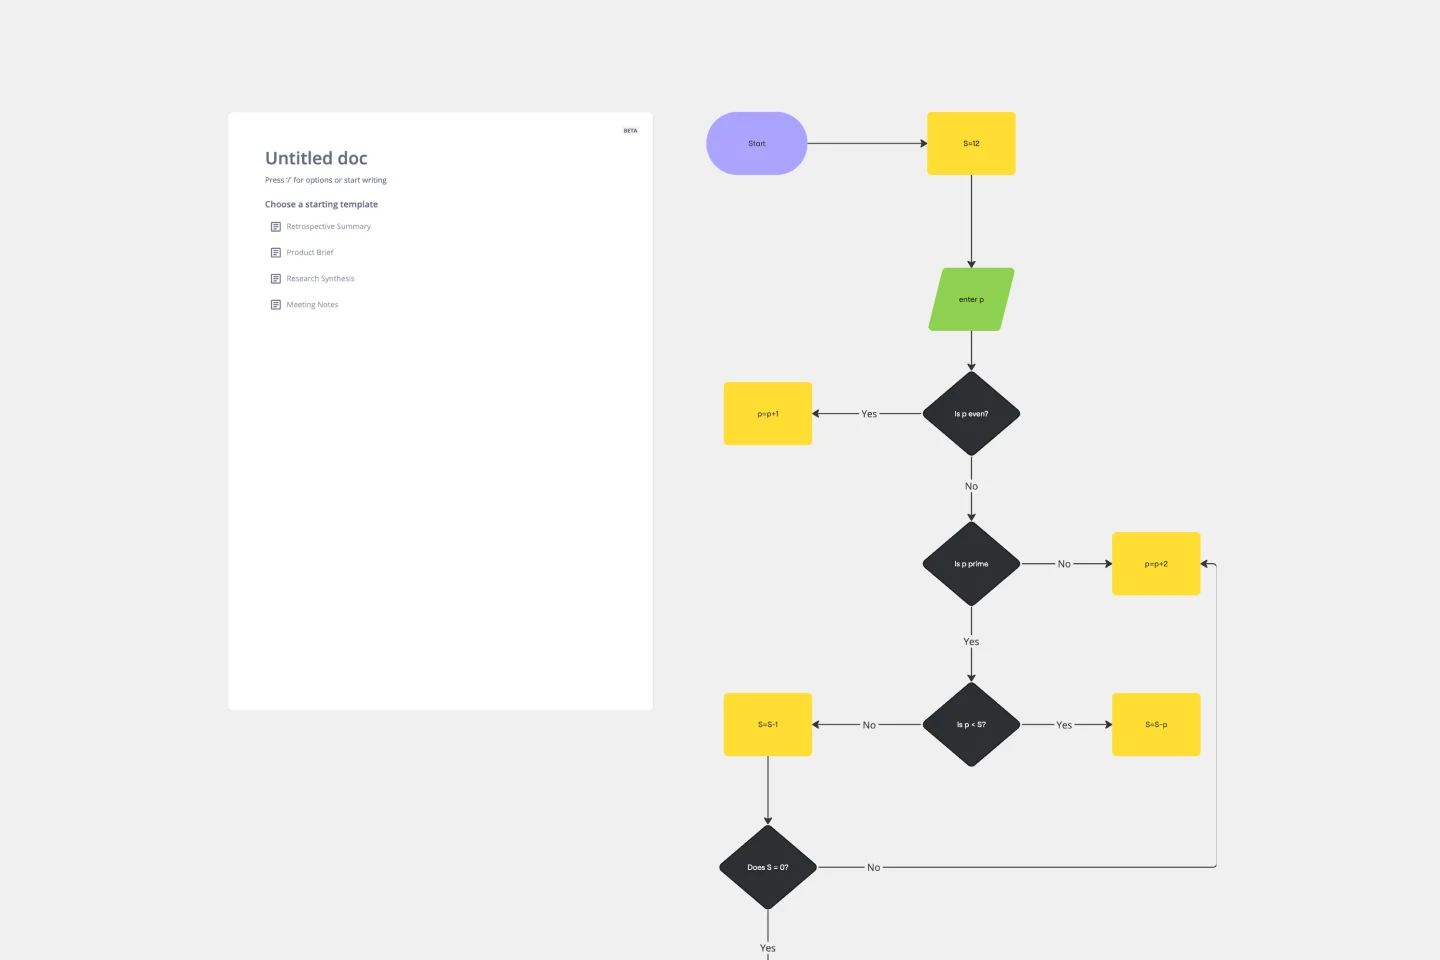
Algorithm Flowchart Template
The Algorithm Flowchart Template is a useful tool for simplifying the process of creating and understanding complex algorithms. Its pre-structured format makes it easy to lay out each operation and decision point in a clear and easily understandable visual format. This is particularly helpful for explaining intricate processes to team members who may not be as technically proficient in the subject matter. With each step clearly defined within its designated shape, the flowchart promotes clarity and makes it easy to identify the logical flow at a glance. This clarity is the template's most significant advantage, reducing cognitive load and enabling a more inclusive and straightforward approach to discussing and refining algorithmic solutions.
Yes No Flowchart Template
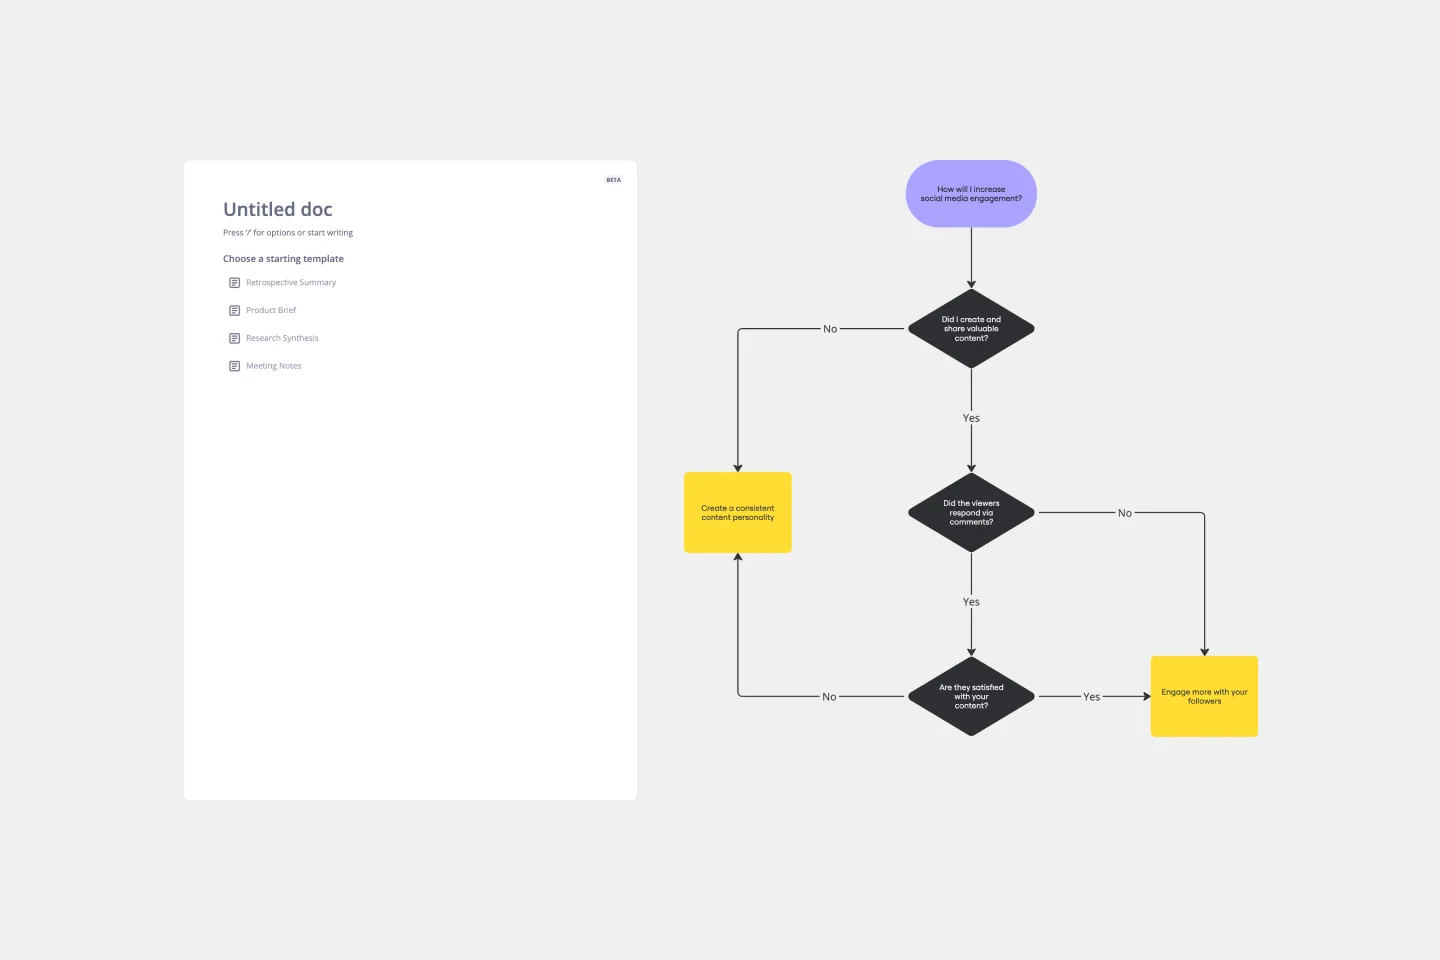
Yes No Flowchart Template
The Yes-No Flowchart Template is a simple and efficient tool that helps to simplify complex decision-making processes into clear and easy-to-follow steps. This template uses standard shapes to illustrate processes, decisions, and outcomes, with arrows that guide users from one action point to the next based on binary 'yes' or 'no' decisions. Its most prominent benefit is its ability to bring clarity to decision-making. By presenting processes visually, teams can effortlessly understand and navigate complex scenarios, ensuring that each step is transparent and reducing the potential for misunderstandings or missteps.
Production Flowchart Template
Production Flowchart Template
The Production Flowchart Template is a well-crafted tool that clearly represents a production process from start to finish. It breaks down complex procedures into easy-to-understand segments, making it easier for stakeholders to grasp the entire process. One of the key benefits of using this template is that it helps to clarify complex production pathways. By mapping out operations visually, teams can identify potential bottlenecks or inefficiencies, facilitating timely and well-informed decision-making.
Cross Functional Flowchart
Cross Functional Flowchart
Have a quick look at everyone on a project and see exactly what they’ll contribute. That’s the clarity and transparency a cross-functional flowchart will give you. These are also called “swim lane” flowcharts because each person (each customer, client, or representative from a specific function) is assigned a lane—a clear line—that will help you visualize their roles at each stage of the project. This template will empower you to streamline processes, reduce inefficiencies, and make meaningful cross-functional relationships.
Website Flowchart Template
Website Flowchart Template
A website flowchart, also known as a sitemap, maps out the structure and complexity of any current or future website. The flowchart can also help your team identify knowledge gaps for future content. When you’re building a website, you want to ensure that each piece of content gives users accurate research results based on keywords associated with your web content. Product, UX, and content teams can use flowcharts or sitemaps to understand everything contained in a website, and plan to add or restructure content to improve a website’s user experience.
Algorithm Flowchart Template
Algorithm Flowchart Template
The Algorithm Flowchart Template is a useful tool for simplifying the process of creating and understanding complex algorithms. Its pre-structured format makes it easy to lay out each operation and decision point in a clear and easily understandable visual format. This is particularly helpful for explaining intricate processes to team members who may not be as technically proficient in the subject matter. With each step clearly defined within its designated shape, the flowchart promotes clarity and makes it easy to identify the logical flow at a glance. This clarity is the template's most significant advantage, reducing cognitive load and enabling a more inclusive and straightforward approach to discussing and refining algorithmic solutions.
Yes No Flowchart Template
Yes No Flowchart Template
The Yes-No Flowchart Template is a simple and efficient tool that helps to simplify complex decision-making processes into clear and easy-to-follow steps. This template uses standard shapes to illustrate processes, decisions, and outcomes, with arrows that guide users from one action point to the next based on binary 'yes' or 'no' decisions. Its most prominent benefit is its ability to bring clarity to decision-making. By presenting processes visually, teams can effortlessly understand and navigate complex scenarios, ensuring that each step is transparent and reducing the potential for misunderstandings or missteps.
Production Flowchart Template
Production Flowchart Template
The Production Flowchart Template is a well-crafted tool that clearly represents a production process from start to finish. It breaks down complex procedures into easy-to-understand segments, making it easier for stakeholders to grasp the entire process. One of the key benefits of using this template is that it helps to clarify complex production pathways. By mapping out operations visually, teams can identify potential bottlenecks or inefficiencies, facilitating timely and well-informed decision-making.