About the Design Process Flowchart Template
The process of designing involves creativity and attention to detail, often requiring a structured approach to bring ideas to life effectively. A design process flowchart template is a critical tool to navigate this journey. It provides a visual roadmap, outlining each step of the design process from conception to completion. This template helps organize thoughts, ideas, and actions, ensuring a smooth workflow and cohesive final product.
The design process flowchart template is a structured guide for designers and teams, mapping out the stages such as research, ideation, prototyping, testing, and finalization. By laying out these steps visually, the template makes the design process more transparent and manageable, allowing for better planning, decision-making, and execution of design projects.
How to use the design process flowchart template
Easy editing: Change the template to suit specific project needs by double-clicking shapes and lines. Adjust elements like text, shapes, and colors to reflect the unique aspects of the design process.
Expand the flowchart: Leverage advanced diagramming features to add more elements or detailed steps, enhancing its comprehensiveness without sacrificing clarity.
Add more resources: Drag and drop relevant files, links, or images to the board for a more enriched and context-aware design process.
Why should you use a design process flowchart template?
Streamlined workflow: Organizes and visualizes the design process, making it easier to follow and manage.
Facilitates creativity and innovation: Provides a structured approach that guides the creative process without stifling innovation.
Improves team collaboration: Enhances communication among team members by providing a clear and shared understanding of the project stages.
Customizable for many projects: Adaptable to different design projects, whether in graphic design, product development, or digital creation.
Effective project management: Help track progress, meet deadlines, and ensure a cohesive design outcome.
Design Process Flowchart Template FAQs
Can non-designers use this template effectively?
Yes, the template is designed to be user-friendly, making it accessible for non-designers to understand and participate in the design process.
How does this template help in managing large design projects?
For large projects, the template provides a clear overview of each phase, helping in breaking down complex tasks into manageable steps and ensuring all aspects of the project are addressed.
Can the flowchart be customized to include brand-specific elements?
The template is fully customizable, allowing the inclusion of brand-specific colors, fonts, and other elements to align with company branding.

Miro
Your virtual workspace for innovation
Miro is an innovation workspace designed for teams of every size, everywhere, to dream, design, and build the future together. Our mission? To empower these teams to create the next big thing, powered by AI at every step of the way. Over 90 million users around the world rely on Miro to untangle complex ideas, put customer needs first, and deliver products and services faster. All supported by best-in-class security, compliance, and scalability.
Categories
Similar templates
UI Flowchart Template
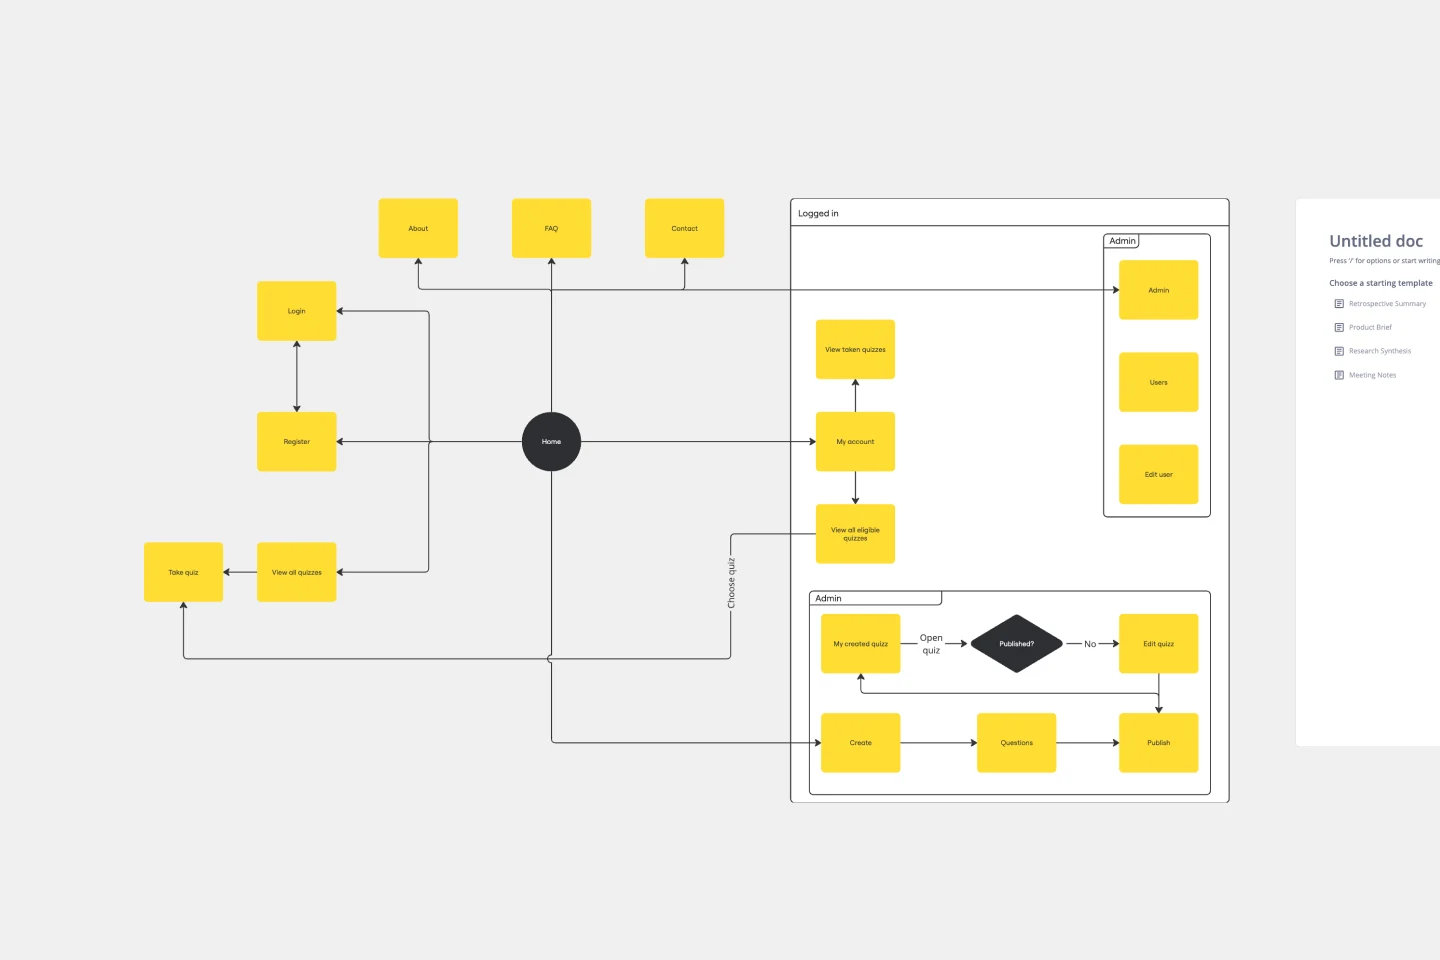
UI Flowchart Template
Our UI Flowchart Template unlocks the potential of seamless design collaboration. Map user flows and product interactions, providing a structured canvas to articulate the intricate journey of users through your digital interface. One key benefit of this template is its ability to facilitate real-time collaboration, ensuring everyone is on the same page and fostering a shared understanding of design decisions. Elevate your design game, enhance collaboration, and bring clarity to your projects with our UI Flowchart Template.
Audience Persona Template
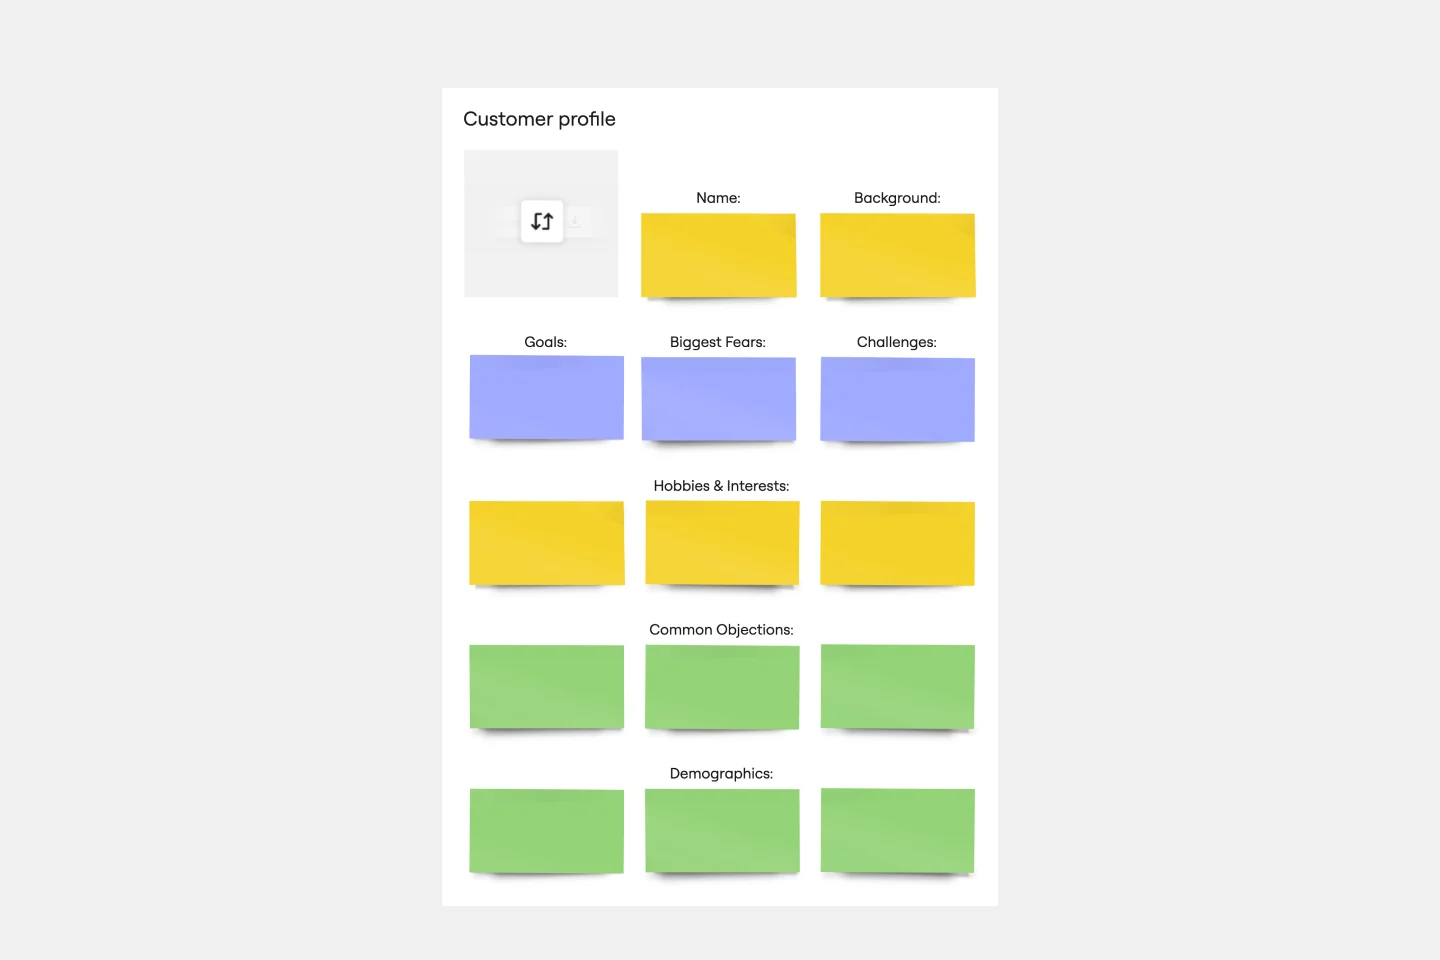
Audience Persona Template
The Audience Persona Template is an essential tool that helps gain valuable insights into the target demographic. It ensures that every strategic decision is tailored to meet the specific needs and preferences of the audience. The template is designed to cover areas like Background, Hobbies and Interests, Goals, Biggest Fears, Challenges, Common Objections, and Demographics. This detailed approach enables the creation of a nuanced and multi-dimensional audience profile. By understanding the basic demographic information and the target audience's deeper motivations, challenges, and apprehensions, teams can develop more empathetic, effective, and targeted strategies. This depth of understanding leads to more resonant and successful product developments, marketing campaigns, and customer engagement initiatives.
Weekly Project Status Report Template
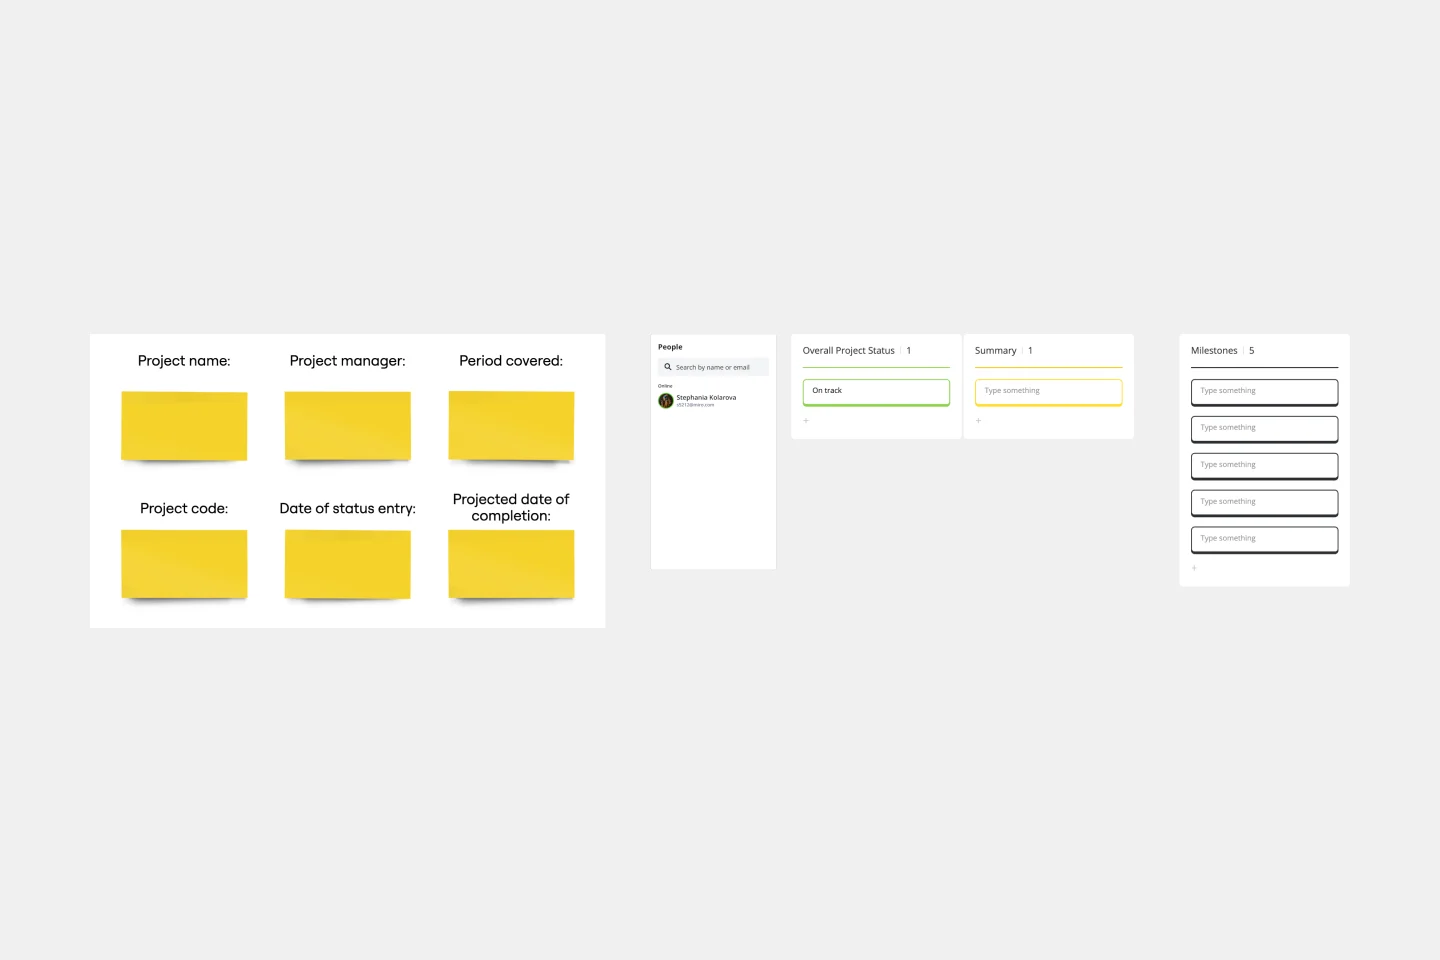
Weekly Project Status Report Template
The Weekly Project Status Report Template is essential for maintaining clear and consistent communication within a project team. It provides several benefits, including enhanced communication among all stakeholders. By standardizing the way project updates are shared, the template ensures that all team members, from the project manager to individual contributors, clearly and consistently understand the project's progress. This common platform for reporting eliminates misunderstandings and ensures everyone is aligned on project objectives, milestones, and current status. The template's intuitive design makes it easy to update and share, streamlining the communication process, which is crucial for the successful delivery of any project.
UI Flowchart Template
UI Flowchart Template
Our UI Flowchart Template unlocks the potential of seamless design collaboration. Map user flows and product interactions, providing a structured canvas to articulate the intricate journey of users through your digital interface. One key benefit of this template is its ability to facilitate real-time collaboration, ensuring everyone is on the same page and fostering a shared understanding of design decisions. Elevate your design game, enhance collaboration, and bring clarity to your projects with our UI Flowchart Template.
Audience Persona Template
Audience Persona Template
The Audience Persona Template is an essential tool that helps gain valuable insights into the target demographic. It ensures that every strategic decision is tailored to meet the specific needs and preferences of the audience. The template is designed to cover areas like Background, Hobbies and Interests, Goals, Biggest Fears, Challenges, Common Objections, and Demographics. This detailed approach enables the creation of a nuanced and multi-dimensional audience profile. By understanding the basic demographic information and the target audience's deeper motivations, challenges, and apprehensions, teams can develop more empathetic, effective, and targeted strategies. This depth of understanding leads to more resonant and successful product developments, marketing campaigns, and customer engagement initiatives.
Weekly Project Status Report Template
Weekly Project Status Report Template
The Weekly Project Status Report Template is essential for maintaining clear and consistent communication within a project team. It provides several benefits, including enhanced communication among all stakeholders. By standardizing the way project updates are shared, the template ensures that all team members, from the project manager to individual contributors, clearly and consistently understand the project's progress. This common platform for reporting eliminates misunderstandings and ensures everyone is aligned on project objectives, milestones, and current status. The template's intuitive design makes it easy to update and share, streamlining the communication process, which is crucial for the successful delivery of any project.