CEDAC stands for Cause and Effect Diagram with the Addition of Cards. To many, CEDAC is a fishbone diagram with ribs that contain issues on one side of the rib and solutions on the other. But really, it was intended to be more than that. It’s inventor, Fukuda won a Deming Prize for its development. To him, CEDAC was a management technique. So, unlike many other techniques used by practitioners of lean that assume the answer/solution can be created from what is already available, Fukuda’s CEDAC can spawn experiments and research to gain better understanding.
The CEDAC tool is highly diverse and can be used to visualize and problem solve across a wide variety of issues. You can use it to understand issues with new product development, to discern why certain software features are not working as intended, to define possible failure modes in product design, or to comprehend why your accounts receivable backlog is growing (just to name a few). Perhaps the most interesting applications come in defining obstacles where the problem is “created” and the solution is not readily apparent. Created problems don’t necessarily look back historically at what happened to get us here but define a future state not yet achieved. Utilizing CEDAC it’s possible to visualize obstacles that must be overcome before reaching our defined target. These targets could be driven by a desire to increase market share, launch a new business, increase our customers spend per transaction, the list really goes on and on.
Using this tool in Miro you have the ability to gain insights from far more resources than what is available to you with a physical board. Perhaps you can make the board public and get insights from other industry professionals via a post of your favorite social media outlet. Or, you can imbed the board into a collaboration space that you use frequently and challenge your team members to add a number of cards throughout their workday. Think of the possibilities for crowdsourcing solutions!

NEXT LEVEL Partners
Our Mission: Enable client PARTNERS to continuously outperform through deployment of NEXT LEVEL business, talent, and organizational processes.
Categories
Similar templates
Fishbone Diagram Template
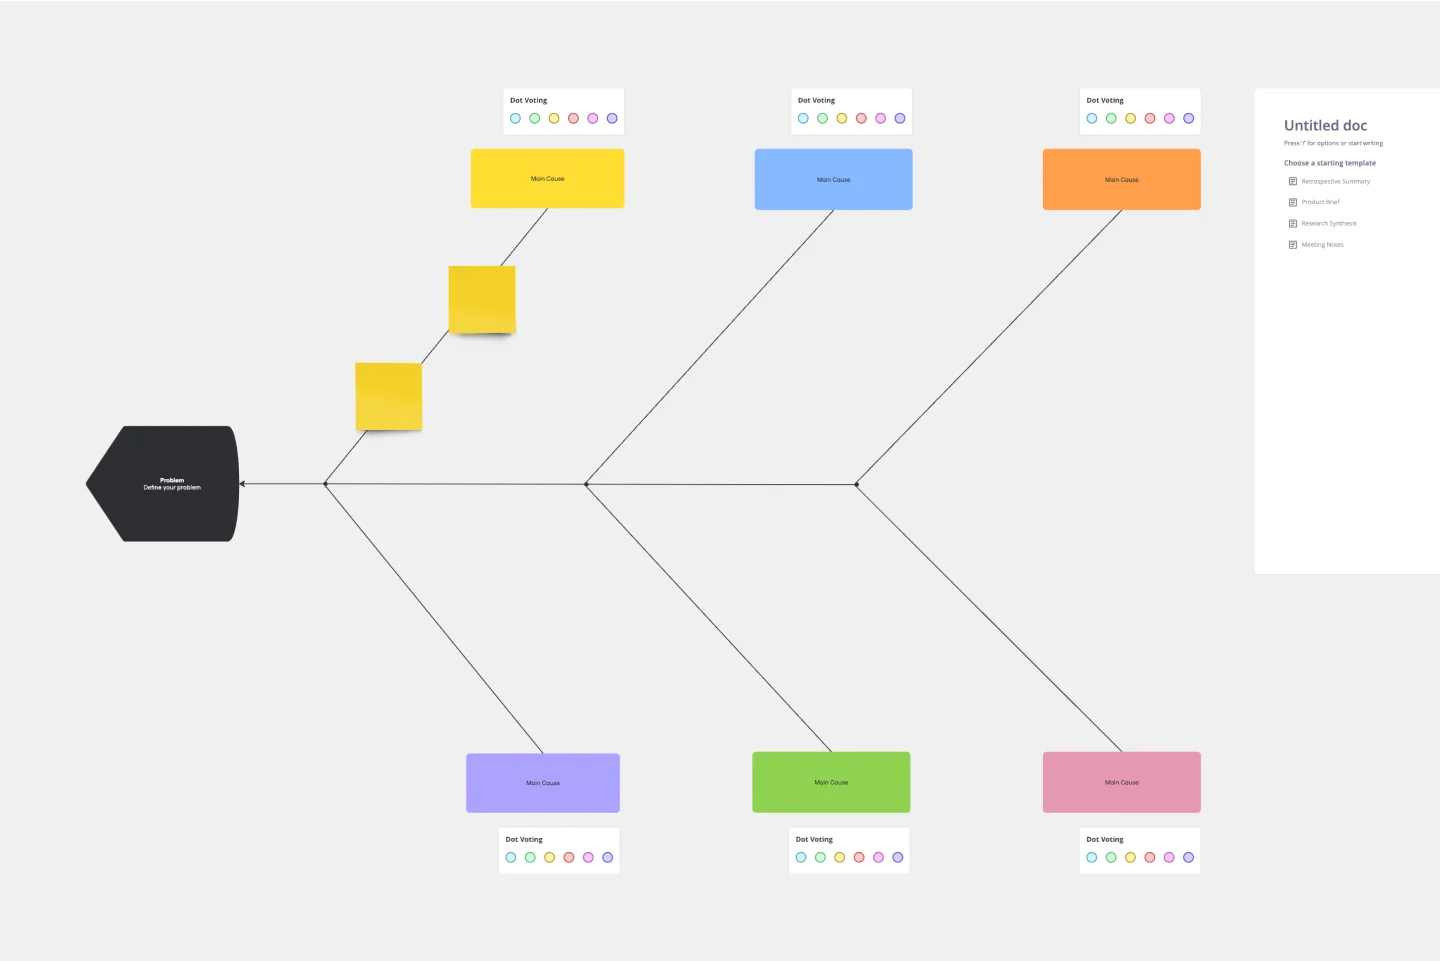
Fishbone Diagram Template
What is the best way to solve any problem your team faces? Go straight to the root. That means identifying the root causes of the problem, and fishbone diagrams are designed to help you do it best. Also known as the Ishikawa Diagram (named after Japanese quality control expert Kaoru Ishikawa), fishbone diagrams allow teams to visualize all possible causes of a problem, to explore and understand how they fit together holistically. Teams can also use fishbone diagrams as a starting point for thinking about what the root cause of a future problem might be.
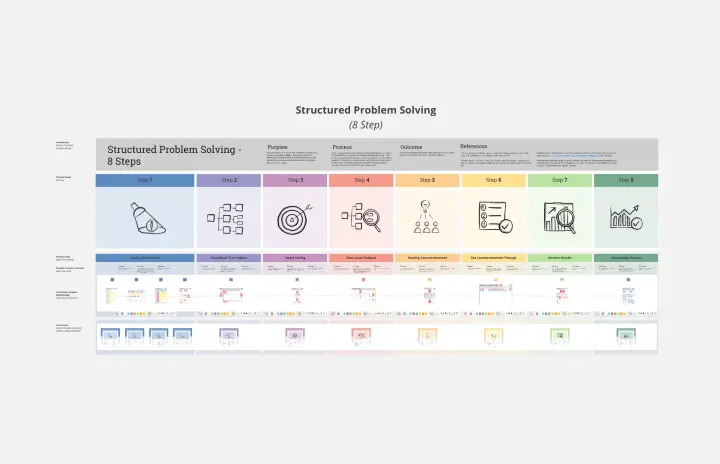
Structured Problem Solving
5 Whys Template
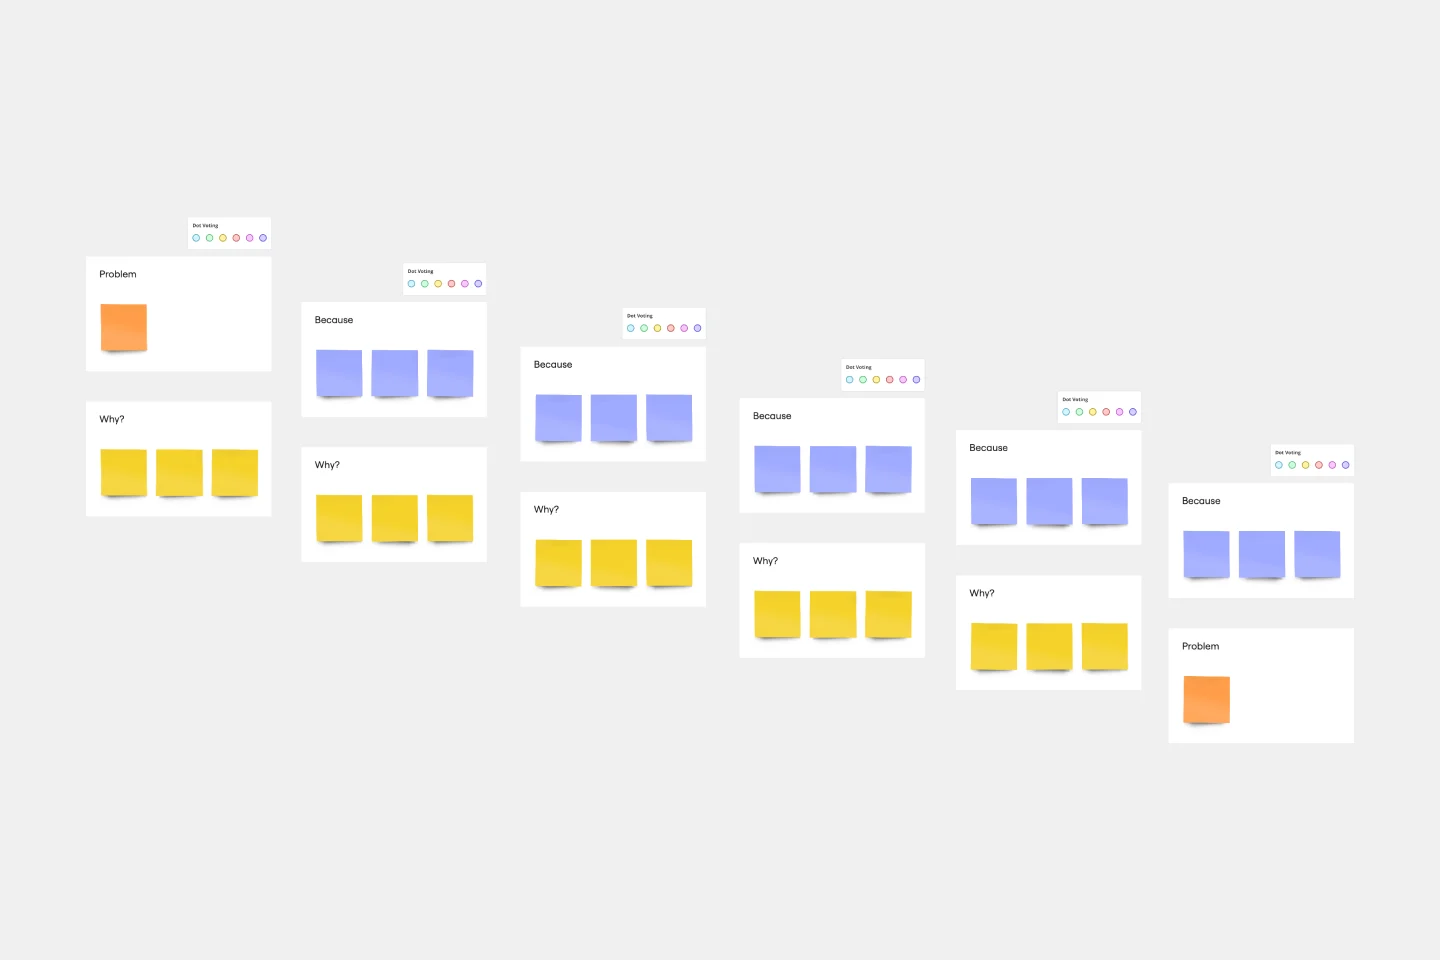
5 Whys Template
Ready to get to the root of the problem? There’s no simpler way to do it than the 5 Whys technique. You’ll start with a simple question: Why did the problem happen? Then you’ll keep asking, up to four more times, until the answer becomes clear and you can work toward a solution. And Miro’s features enhance the approach: You can ask team members questions in chat or @mention them in comments, and use color-coded sticky notes to call out issues that are central to the problem at hand.
Fishbone Diagram Template
Fishbone Diagram Template
What is the best way to solve any problem your team faces? Go straight to the root. That means identifying the root causes of the problem, and fishbone diagrams are designed to help you do it best. Also known as the Ishikawa Diagram (named after Japanese quality control expert Kaoru Ishikawa), fishbone diagrams allow teams to visualize all possible causes of a problem, to explore and understand how they fit together holistically. Teams can also use fishbone diagrams as a starting point for thinking about what the root cause of a future problem might be.
Structured Problem Solving
5 Whys Template
5 Whys Template
Ready to get to the root of the problem? There’s no simpler way to do it than the 5 Whys technique. You’ll start with a simple question: Why did the problem happen? Then you’ll keep asking, up to four more times, until the answer becomes clear and you can work toward a solution. And Miro’s features enhance the approach: You can ask team members questions in chat or @mention them in comments, and use color-coded sticky notes to call out issues that are central to the problem at hand.