About the Cross-Functional Flowchart
Cross-functional flowcharts (also known as a “swim lane diagram” or “cross-functional process map” ) can help you visualize business relationships and end-to-end project contributions. These elements that depend on each other can include the relationship between functions and stakeholders (such as departments and clients) or project phases and milestones.
The map format allows you to make your business processes or project phases more transparent with added layers of detail and structure.
Keep reading to learn more about cross-functional flowcharts.
What is a Cross-Functional flowchart?
A cross-functional flowchart shows how people from different teams contribute to, and complete, a business process or project.
The lanes in the chart can help separate and clarify which department, employee, or person outside of the business contributes to a business or project.
Each person (such as a customer, client, or representative from a specific function) who contributes to the big-picture process is assigned a lane. That assigned area outlines all the activities they are responsible for moving forward to the finish line.
When to use a Cross-Functional flowchart
Cross-functional flowcharts can be used to improve your team and organizational processes. These changes can include the need to work out what factors create inefficiencies and address delays that impact both internal and external stakeholders.
A cross-functional flowchart can also help different teams or departments better understand each other’s responsibilities and capabilities. These details are especially useful when people haven’t worked together before or struggle to understand what different teams do on a day-to-day basis. Consistently collaborating with an online flowchart creates greater transparency and alignment.
Create your own Cross-Functional flowchart
Making your own cross-functional flowchart is easy. Miro’s virtual collaboration platform is the perfect flowchart maker and canvas for sharing them. Get started by selecting the Cross-Functional Flowchart Template, then take the following steps to make one of your own.
1. Decide what your lanes are.
Decide what divisions (functions) or identities (internal or external stakeholders) need representation on the flow chart.
2. Define what the start of your process is.
What’s the first action that triggers a series of tasks or interactions? Maybe it’s a client confirmation or a customer request. Each division will have a different starting point, but you’ll see that there may be points in the journey or interaction where functions or individuals coincidentally meet (or need to coordinate and communicate, for a smoother process to roll out).
3. Keep adding steps to your process until you get to the last step or endpoint.
What does the flow of information look like from start to finish? What decisions need to be made? Ask yourself and your team these questions as you map out each situation. Try to convert your quick sketches to sticky notes, shapes, and connecting lines that work together to create a logical flow chart.
4. Update your flow chart as needed—and use it alongside other process-based templates.
Cross-functional process maps were designed to work alongside – or be connected to – other templates, such as a product roadmap or stakeholder mapping templates. Rally your teammates, stakeholders, and leadership team around a people-first vision by helping them see the bigger picture alongside the all-important details.

Miro
Your virtual workspace for innovation
Miro is an innovation workspace designed for teams of every size, everywhere, to dream, design, and build the future together. Our mission? To empower these teams to create the next big thing, powered by AI at every step of the way. Over 90 million users around the world rely on Miro to untangle complex ideas, put customer needs first, and deliver products and services faster. All supported by best-in-class security, compliance, and scalability.
Categories
Similar templates
If then Flowchart Template
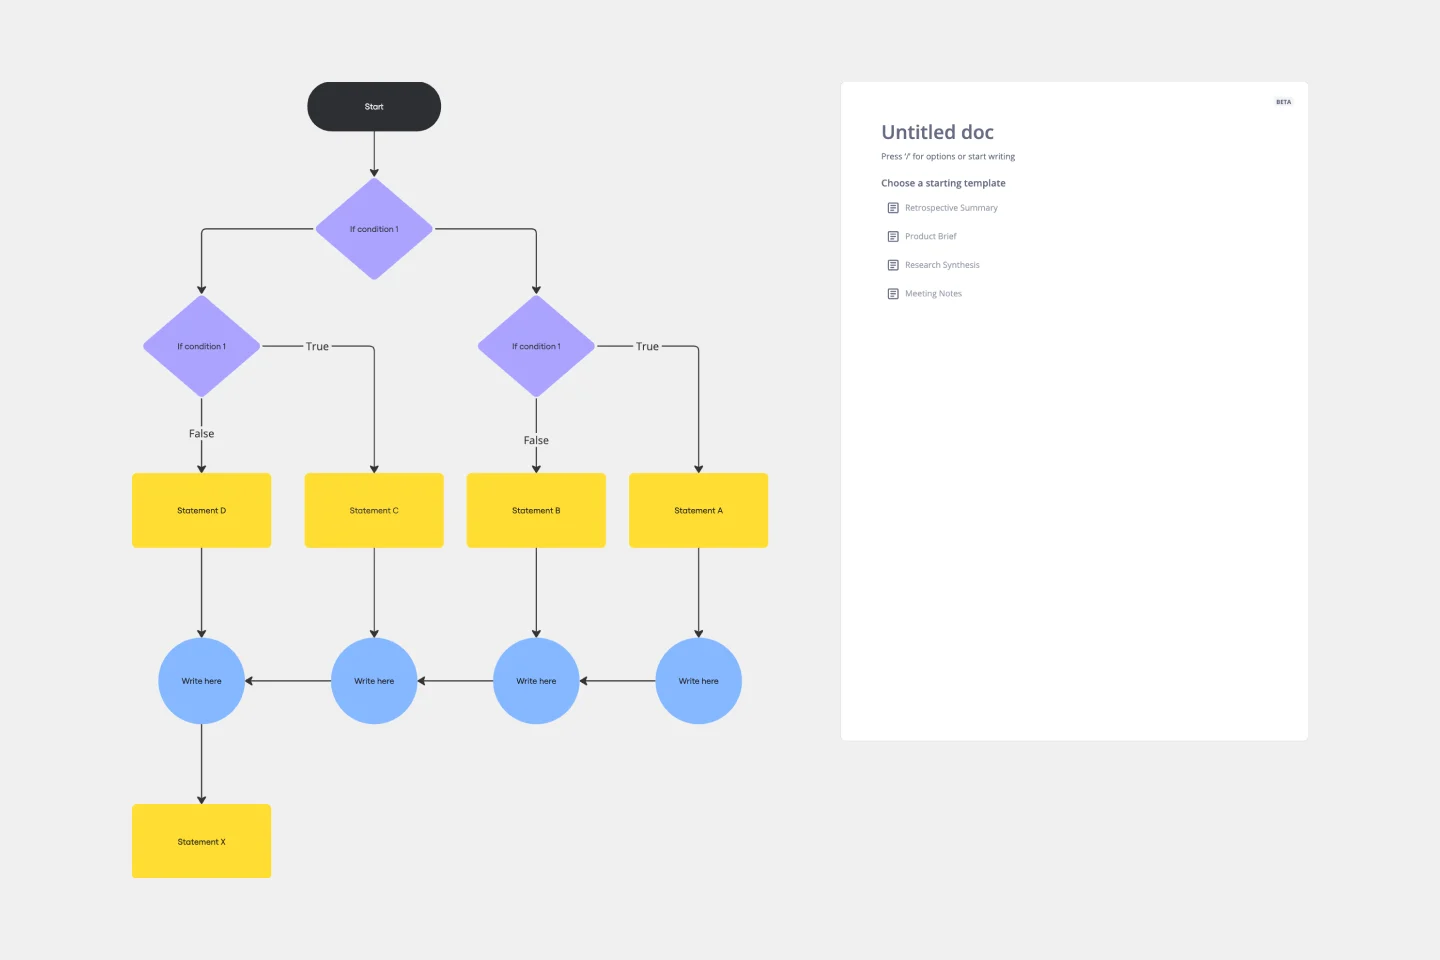
If then Flowchart Template
The If-then Flowchart Template is a useful tool for decision-making. It visually maps out conditional steps and outcomes, allowing users to anticipate potential challenges and opportunities. This foresight is valuable for making informed decisions, especially for those with significant implications. Whether for business strategy, project management, or personal decision-making, the template helps navigate complex decision trees with confidence.
Design Process Flowchart Template
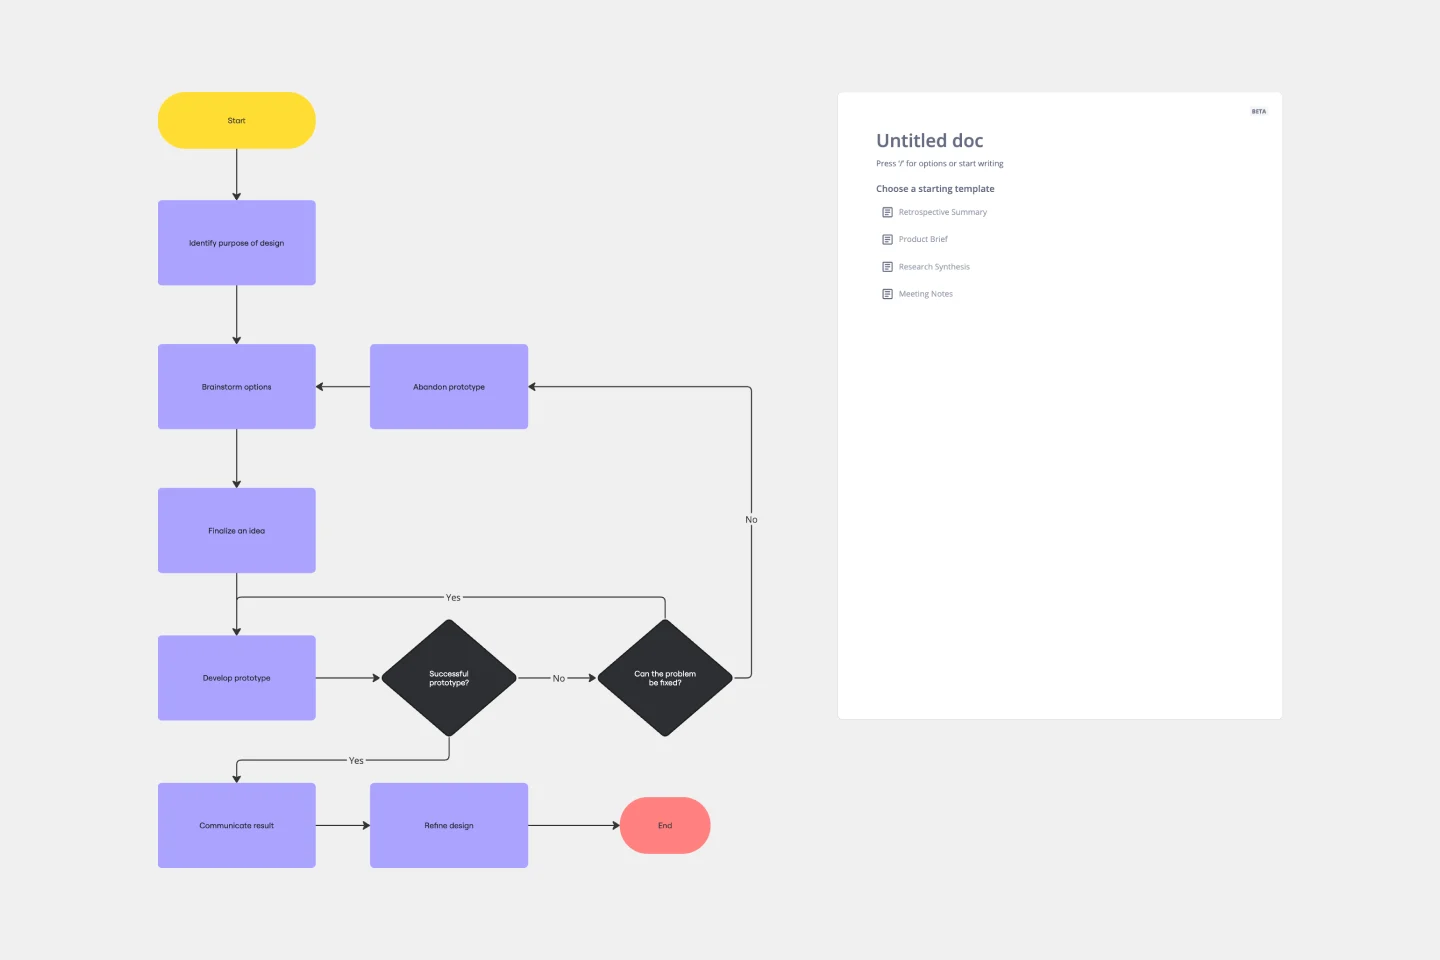
Design Process Flowchart Template
The Design Process Flowchart Template is an excellent tool to navigate the complexities of a design project. It offers a clear and organized visual representation of each step in the design journey, making it easier to understand and follow. One of its key benefits is that it enhances team collaboration. By providing a visual outline of the design process, the template fosters a shared understanding among team members, regardless of their individual roles or expertise. This common visual framework enables more efficient communication, aligning everyone's efforts toward a unified goal. As a result, it not only streamlines the workflow but also encourages collective creativity and innovation, which are essential elements in any successful design project.
Troubleshooting Flowchart Template
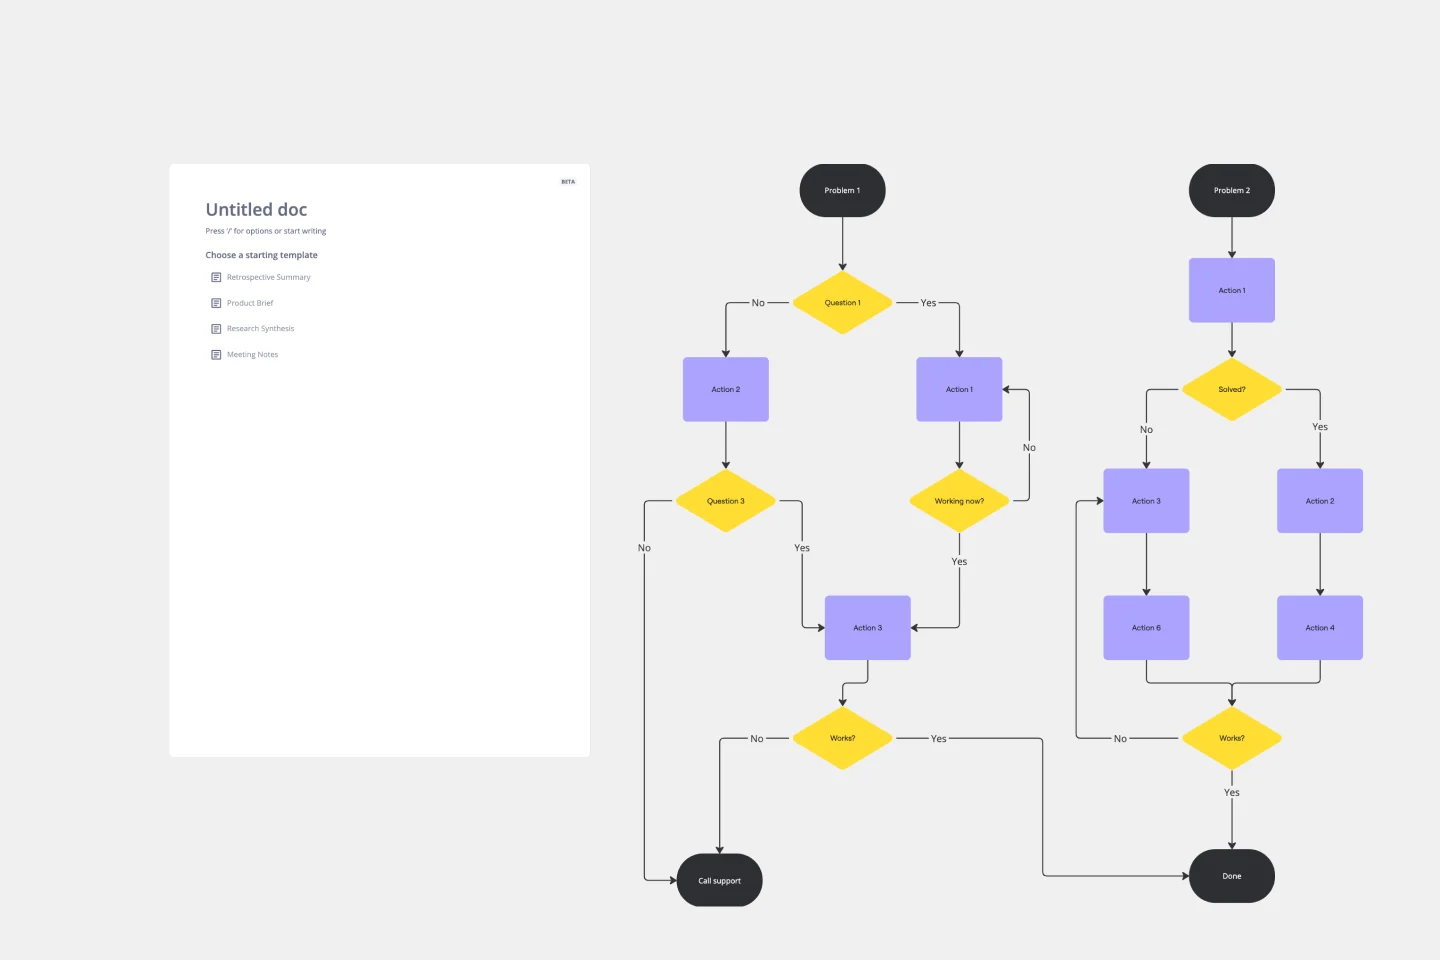
Troubleshooting Flowchart Template
The Troubleshooting Flowchart Template is an easy-to-use and versatile tool that simplifies problem-solving. It provides a step-by-step visual guide to identify, analyze, and fix issues, ensuring a clear and structured approach to troubleshooting. One of the key benefits of utilizing this template is that it helps improve communication among team members. By representing the troubleshooting steps visually, it simplifies complex processes and makes it easier for team members to understand, collaborate, and contribute efficiently.
Flowchart Template
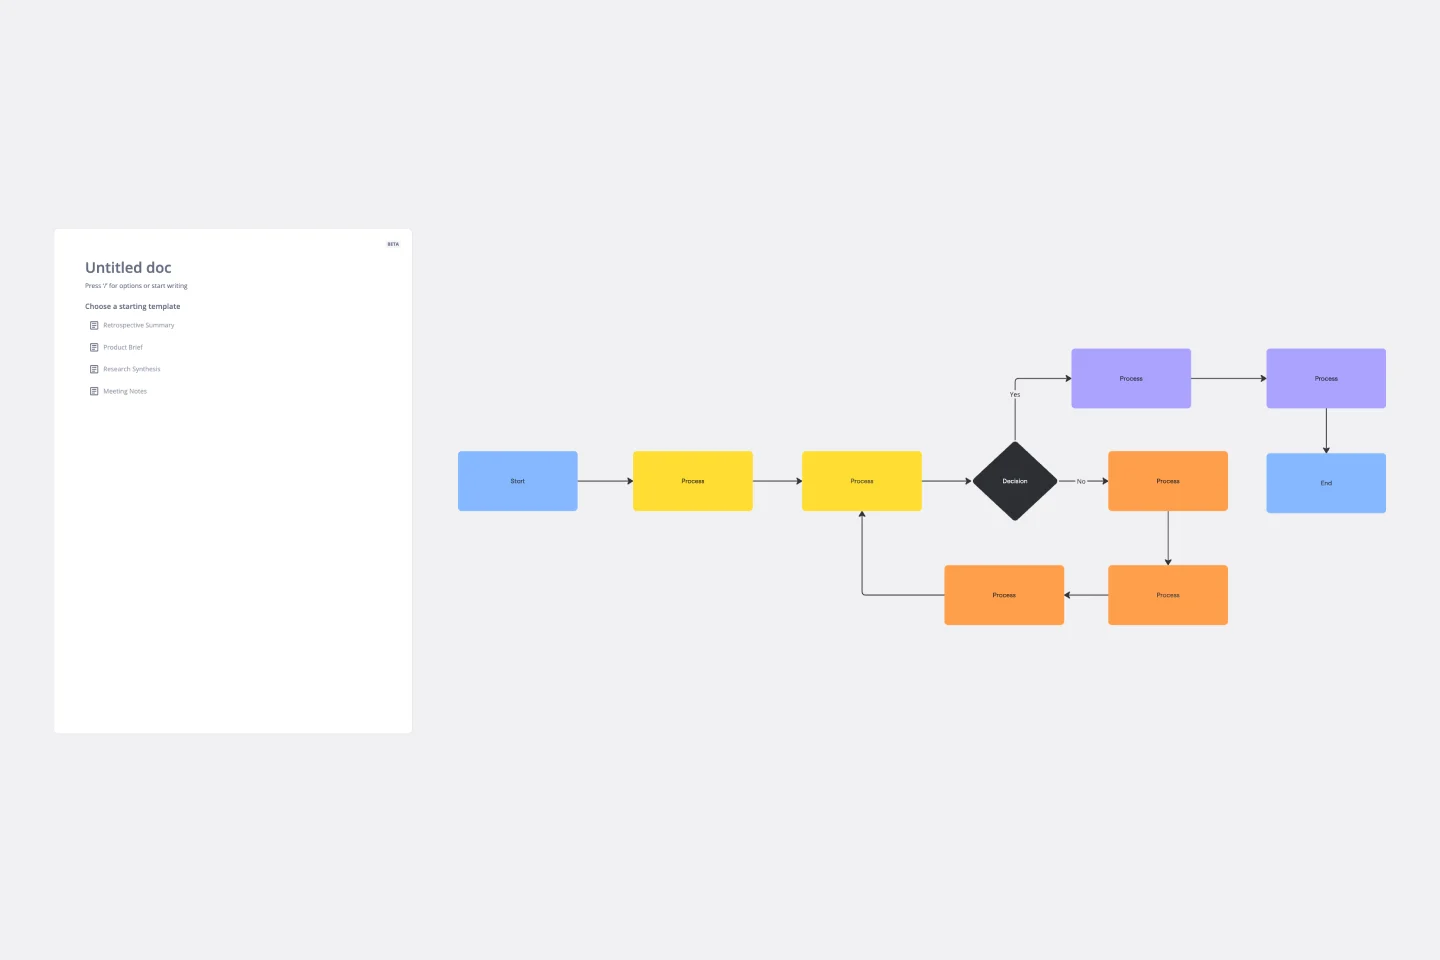
Flowchart Template
Trying to explain a process or workflow to your team — or just wrap your head around it yourself? Sometimes the best way is to see it, and that’s when you create a flowchart. Using common shapes (generally just ovals, rectangles, diamonds, and arrows), a flowchart shows you the direction a process or workflow goes and the order of steps. Beyond giving you a clear understanding, you’ll also be able to see potential flaws and bottlenecks, which helps you refine and improve your process and create a better product more efficiently.
If then Flowchart Template
If then Flowchart Template
The If-then Flowchart Template is a useful tool for decision-making. It visually maps out conditional steps and outcomes, allowing users to anticipate potential challenges and opportunities. This foresight is valuable for making informed decisions, especially for those with significant implications. Whether for business strategy, project management, or personal decision-making, the template helps navigate complex decision trees with confidence.
Design Process Flowchart Template
Design Process Flowchart Template
The Design Process Flowchart Template is an excellent tool to navigate the complexities of a design project. It offers a clear and organized visual representation of each step in the design journey, making it easier to understand and follow. One of its key benefits is that it enhances team collaboration. By providing a visual outline of the design process, the template fosters a shared understanding among team members, regardless of their individual roles or expertise. This common visual framework enables more efficient communication, aligning everyone's efforts toward a unified goal. As a result, it not only streamlines the workflow but also encourages collective creativity and innovation, which are essential elements in any successful design project.
Troubleshooting Flowchart Template
Troubleshooting Flowchart Template
The Troubleshooting Flowchart Template is an easy-to-use and versatile tool that simplifies problem-solving. It provides a step-by-step visual guide to identify, analyze, and fix issues, ensuring a clear and structured approach to troubleshooting. One of the key benefits of utilizing this template is that it helps improve communication among team members. By representing the troubleshooting steps visually, it simplifies complex processes and makes it easier for team members to understand, collaborate, and contribute efficiently.
Flowchart Template
Flowchart Template
Trying to explain a process or workflow to your team — or just wrap your head around it yourself? Sometimes the best way is to see it, and that’s when you create a flowchart. Using common shapes (generally just ovals, rectangles, diamonds, and arrows), a flowchart shows you the direction a process or workflow goes and the order of steps. Beyond giving you a clear understanding, you’ll also be able to see potential flaws and bottlenecks, which helps you refine and improve your process and create a better product more efficiently.