Cloudflare RAG Architecture Knowledge Queries Template
Use the Cloudflare RAG Architecture Knowledge Queries Template to simplify the complex process of diagramming architectures. Promote better collaboration among team members, significantly improve documentation quality, and optimize decision-making processes.
Available on Enterprise, Business, Education plans.
About the Cloudflare RAG Architecture Knowledge Queries Template
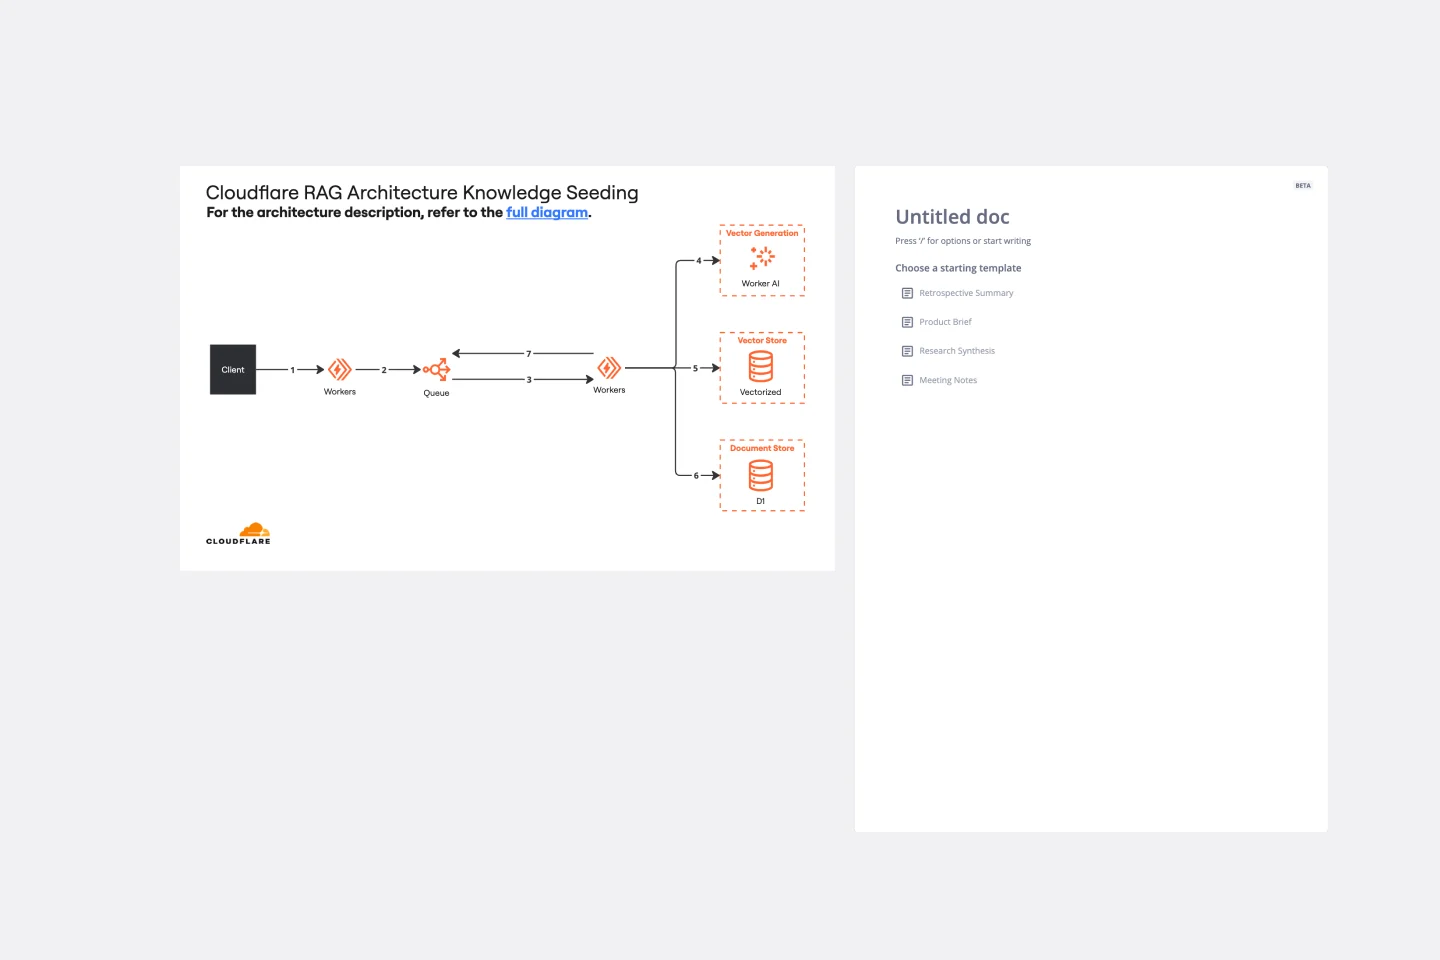
The Cloudflare RAG Architecture Knowledge Queries template is a tool designed for diagramming and understanding the complex architecture of Cloudflare's Retrieval Augmented Generation (RAG) system. This template helps in visualizing and querying architectural knowledge, making it easier for teams to collaborate on and optimize Cloudflare's infrastructure.
How to use the Cloudflare RAG Architecture Knowledge Queries Template in Miro
Customize your template: The template comes blank, allowing you to start diagramming your Cloudflare RAG architecture. Use the shape tool on the toolbar and click "All shapes." The Diagramming panel will open on the left-hand side, where you can manage and add necessary shapes to your board.
Collaborate and share: Invite team members to collaborate on the board. You can share insights, leave comments, and make real-time edits together.
Save and export: Once your architecture is fully diagrammed, save your board for future reference. You can also export it for presentations or documentation purposes.
Why use the Cloudflare RAG Architecture Knowledge Queries Template
The Cloudflare RAG Architecture Knowledge Queries template is invaluable for teams working with Cloudflare's RAG system. It simplifies the process of diagramming complex architectures, making it easier to visualize, analyze, and communicate about the system's structure and components. By using this template, teams can:
Enhance collaboration: Facilitate better communication and understanding among team members, regardless of their location.
Improve documentation: Create clear and detailed diagrams that serve as valuable documentation for the architecture.
Optimize decision-making: Visualize the architecture to identify potential improvements or optimizations in the system.
This template is designed to be flexible and user-friendly, accommodating the needs of both technical and non-technical team members.
Get started with this template right now. Available on Enterprise, Business, Education plans.
UML ERD Diagram
Works best for:
Diagramming, UML Diagram
This template contains a few Entity-Relationship diagrams that you can re-use for your own work.
20/80 Process Diagram - EOS Compatible
Works best for:
Diagramming
The 20/80 Process Diagram - EOS® Compatible template is a visual tool for mapping out processes and workflows aligned with the Entrepreneurial Operating System (EOS®) methodology. It provides a structured framework for identifying core processes and key activities that drive business outcomes. This template enables organizations to streamline operations, clarify roles and responsibilities, and enhance accountability. By promoting alignment with EOS® principles, the 20/80 Process Diagram empowers teams to achieve organizational excellence and drive sustainable growth.
Venn Diagrams by Dave Westgarth
Works best for:
Venn Diagram
Visualize relationships and intersections clearly with the Collection Venn Diagram template. This tool is perfect for comparing multiple sets of data, identifying commonalities, and showcasing unique elements. Use it in presentations, research, and data analysis to make complex information more digestible. Ideal for educators, researchers, and analysts seeking to present data insights effectively.
20/80 Process Diagram - EOS Compatible
Works best for:
Diagramming
The 20/80 Process Diagram - EOS® Compatible template is a visual tool for mapping out processes and workflows aligned with the Entrepreneurial Operating System (EOS®) methodology. It provides a structured framework for identifying core processes and key activities that drive business outcomes. This template enables organizations to streamline operations, clarify roles and responsibilities, and enhance accountability. By promoting alignment with EOS® principles, the 20/80 Process Diagram empowers teams to achieve organizational excellence and drive sustainable growth.
Cross-Account EC2 Status Monitoring for HPC Clusters Template
Works best for:
AWS
The Cross-Account EC2 Status Monitoring for HPC Clusters Template provides a centralized view of the health and performance of EC2 instances across multiple AWS accounts. It helps in early issue detection, reducing downtime and ensuring optimal efficiency of HPC clusters. The template offers customization options to meet specific HPC cluster configurations, simplifying monitoring and improving operational efficiency for administrators.
Venn Diagrams by Dave Westgarth
Works best for:
Venn Diagram
Visualize relationships and intersections clearly with the Collection Venn Diagram template. This tool is perfect for comparing multiple sets of data, identifying commonalities, and showcasing unique elements. Use it in presentations, research, and data analysis to make complex information more digestible. Ideal for educators, researchers, and analysts seeking to present data insights effectively.