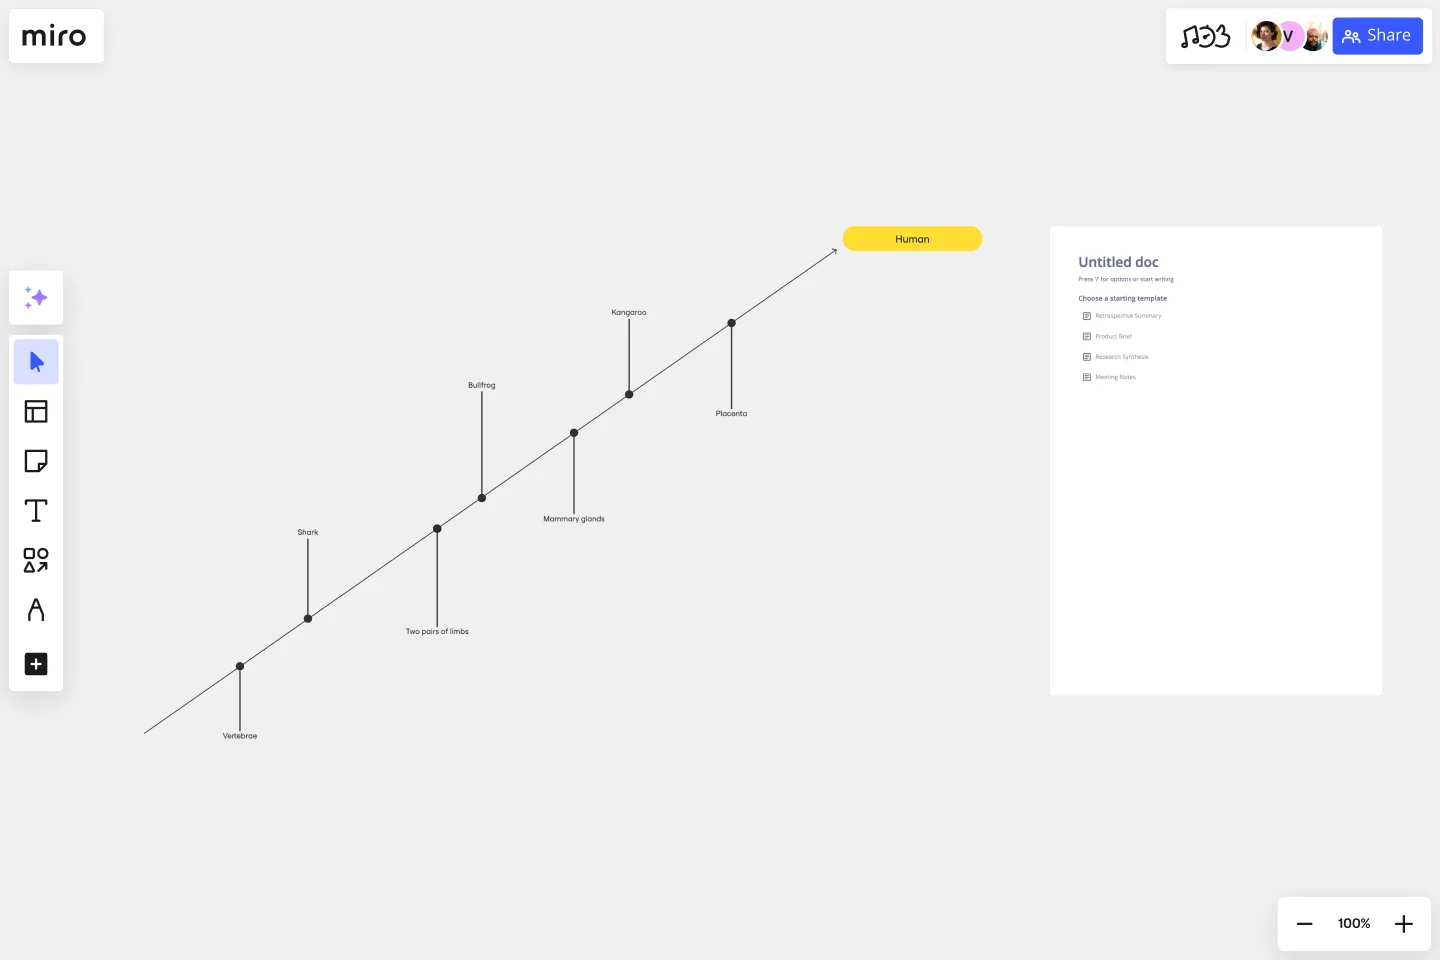
Cladogram Template
Easily explain evolutionary relationships with the Cladogram Template.
About the Cladogram Template
The Cladogram Template is a helpful visual tool that simplifies the representation of evolutionary relationships among different species or concepts. A cladogram is a branching diagram that displays the connections between various entities based on shared characteristics and evolutionary divergence.
The template enables users to easily create, edit, and expand cladograms. It's a powerful asset for educators, scientists, and professionals who want to simplify complex relationships and showcase evolutionary connections.
How to use the cladogram template in Miro
Customize easily: Edit the template with just a few clicks, tailoring it to your specific requirements. Change labels, change branches, and adjust the structure effortlessly.
Automated diagramming: Leverage Miro's automated diagramming features to expand your cladogram. The platform intelligently adjusts the layout as you add or remove elements, ensuring a visually appealing and logically structured diagram.
Add context: Enhance your cladogram by incorporating artifacts from your Miro board. This could include images, text, or other relevant materials, providing additional context and depth to your evolutionary representation.
Why use a cladogram template?
Simplify complex concepts: Simplify intricate evolutionary relationships and present them in a clear and comprehensible format.
Enhance collaboration: Facilitate team collaboration by visualizing a shared understanding of evolutionary connections.
Save time: Use the template's user-friendly design and automation features, which allow you to focus on content rather than formatting.
Dynamic adaptability: Adapt your cladogram quickly as new information arises or concepts evolve, ensuring that your diagrams remain relevant.
Effective communication: Communicate complex ideas effectively, whether in the classroom, research setting, or professional environment.
Find out all the features of Miro's cladogram maker and start building your diagram right now.
Can I customize the colors and shapes of elements in the cladogram?
Miro's cladogram template allows complete customization, including colors, shapes, and labels, empowering you to create visually appealing and informative diagrams.
Can I export the cladogram created in Miro to other file formats?
Yes, Miro supports various export formats, ensuring that your cladogram can be shared in multiple ways, such as PDFs or images.
Get started with this template right now.
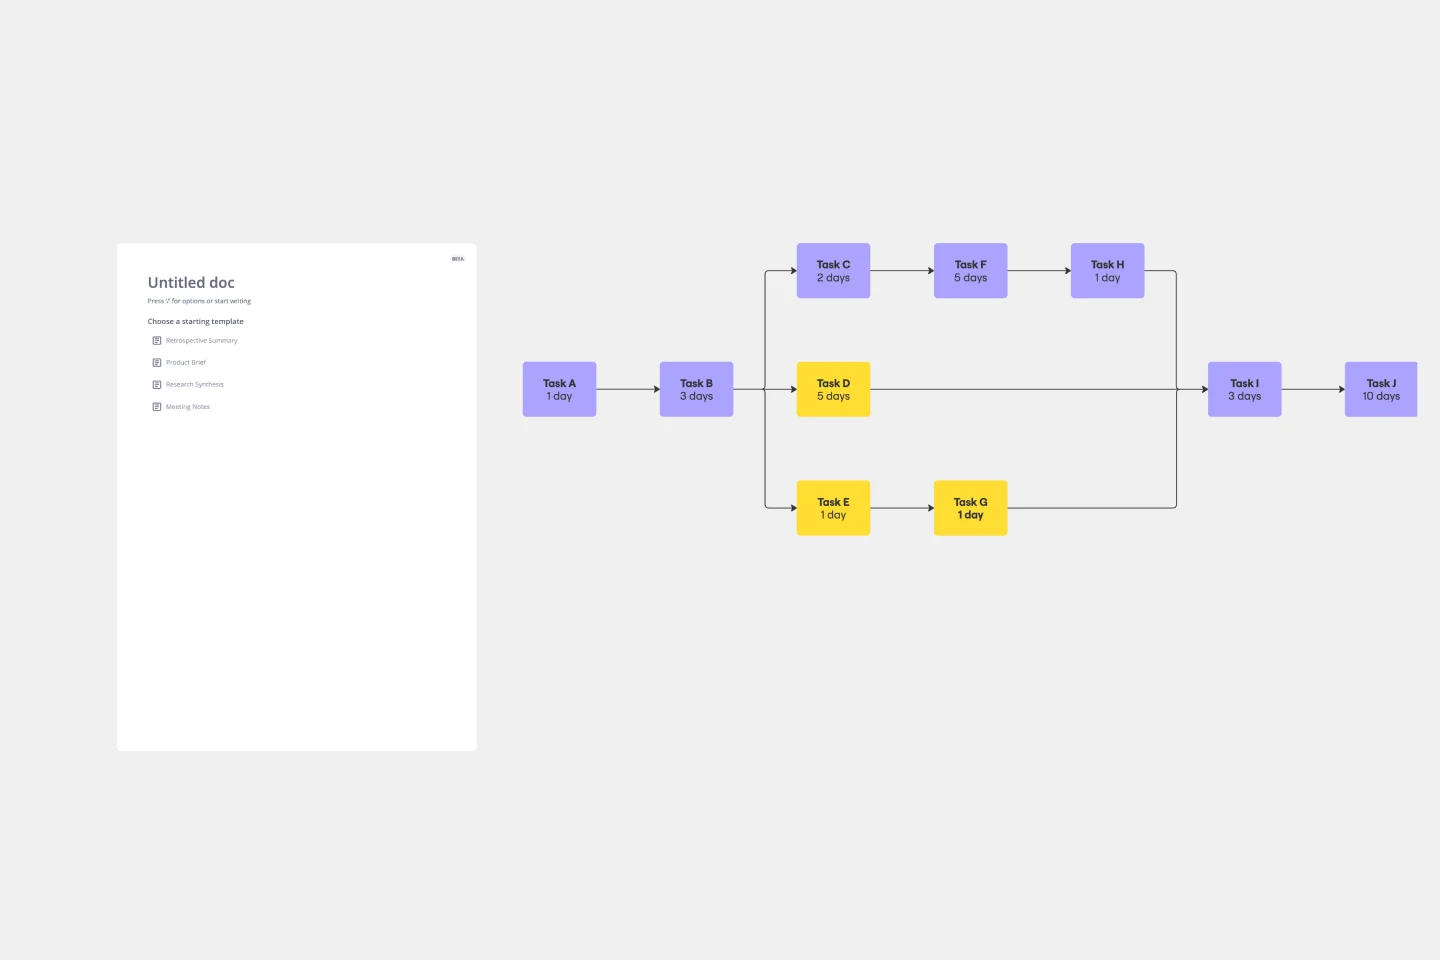
Critical Path Method Template
Works best for:
Diagramming, Project Management
Elevate your project management game with the Critical Path Method Template—an indispensable tool that brings clarity and precision to your project timelines. The template instantaneously adjusts as you edit tasks and dependencies, ensuring that your critical path is consistently up-to-date. This capability not only simplifies the complex process of project scheduling but also empowers your team to proactively respond to evolving project dynamics, fostering adaptability and efficiency throughout the project lifecycle.
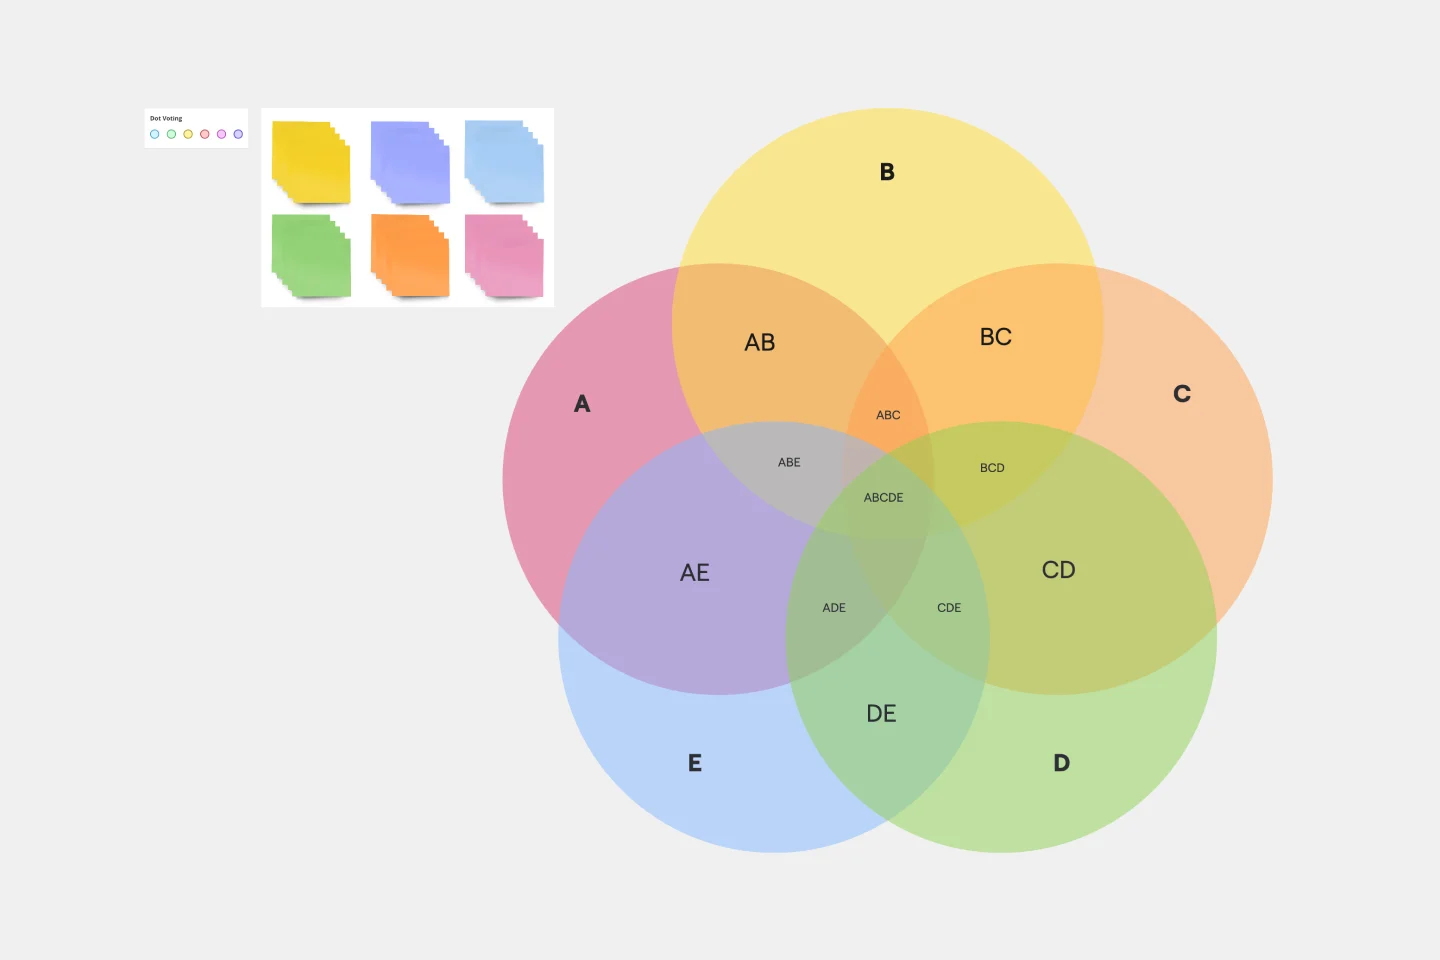
5-Circle Venn Diagram Template
Works best for:
Diagramming, Mapping, Brainstorming
Discover how Miro's 5 Circle Venn Diagram Template can simplify complex decision-making processes. Learn how to create, customize, and share your diagrams for effective visual collaboration. Transform brainstorming sessions with real time, remote teamwork.
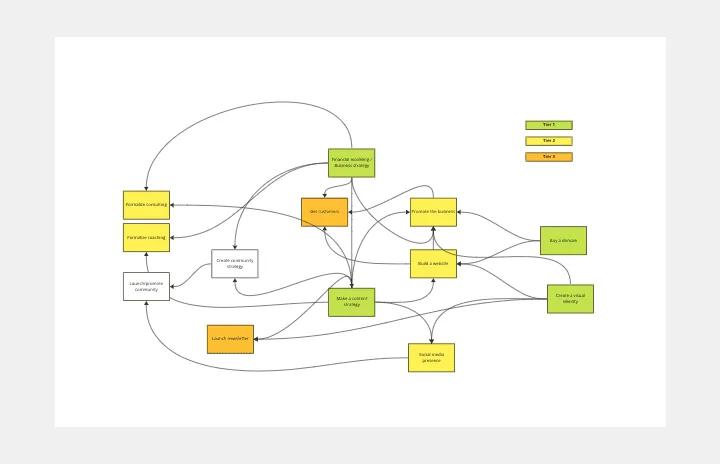
Interrelationship Diagram
Works best for:
Diagramming
The Interrelationship Diagram template is a visual tool for analyzing and illustrating complex relationships between variables or elements within a system. It provides a structured framework for mapping out connections, dependencies, and interactions. This template enables teams to visualize patterns, identify causal relationships, and uncover insights into system behavior. By promoting systems thinking and understanding of interdependencies, the Interrelationship Diagram empowers organizations to make informed decisions and drive effective solutions to complex problems.
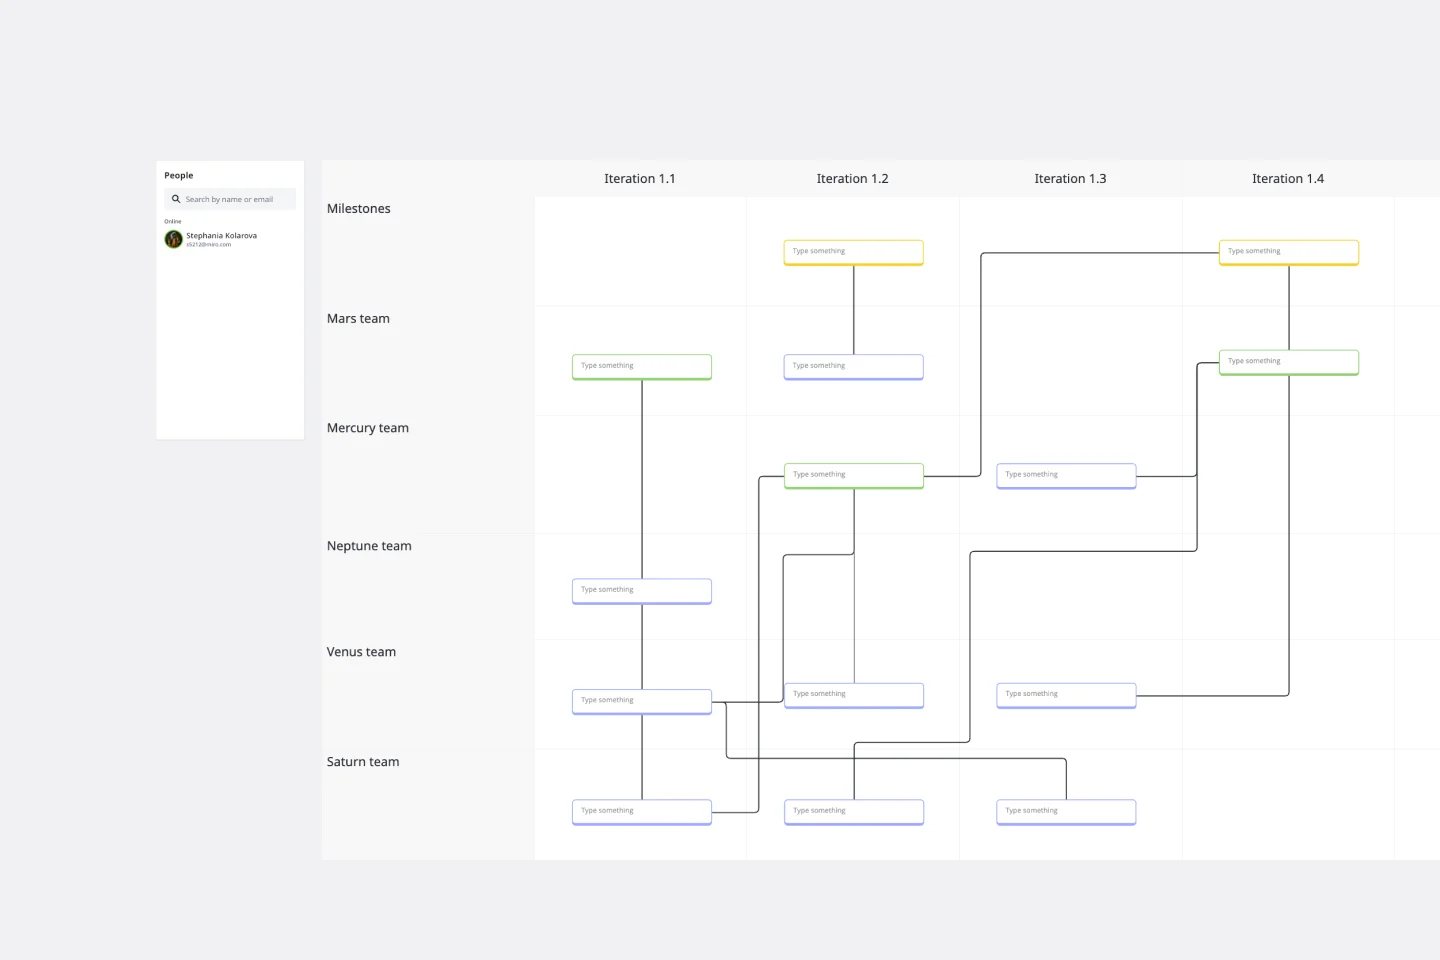
SAFe Program Board
Works best for:
Agile Methodology, Diagrams, Agile Workflows
Many organizations use the Agile model, but even companies that don’t rigorously adhere to all Agile standards have adopted Agile tools and methods like Program Increment (PI) Planning. Even if you’re not participating in a formal PI session, a program board can be a great way to establish communication across teams and stakeholders, align development objectives with business goals, clarify dependencies, and foster cross-functional collaboration. The board provides much-needed structure to planning sessions, yet is adaptable enough to accommodate brainstorming and alignment meetings.
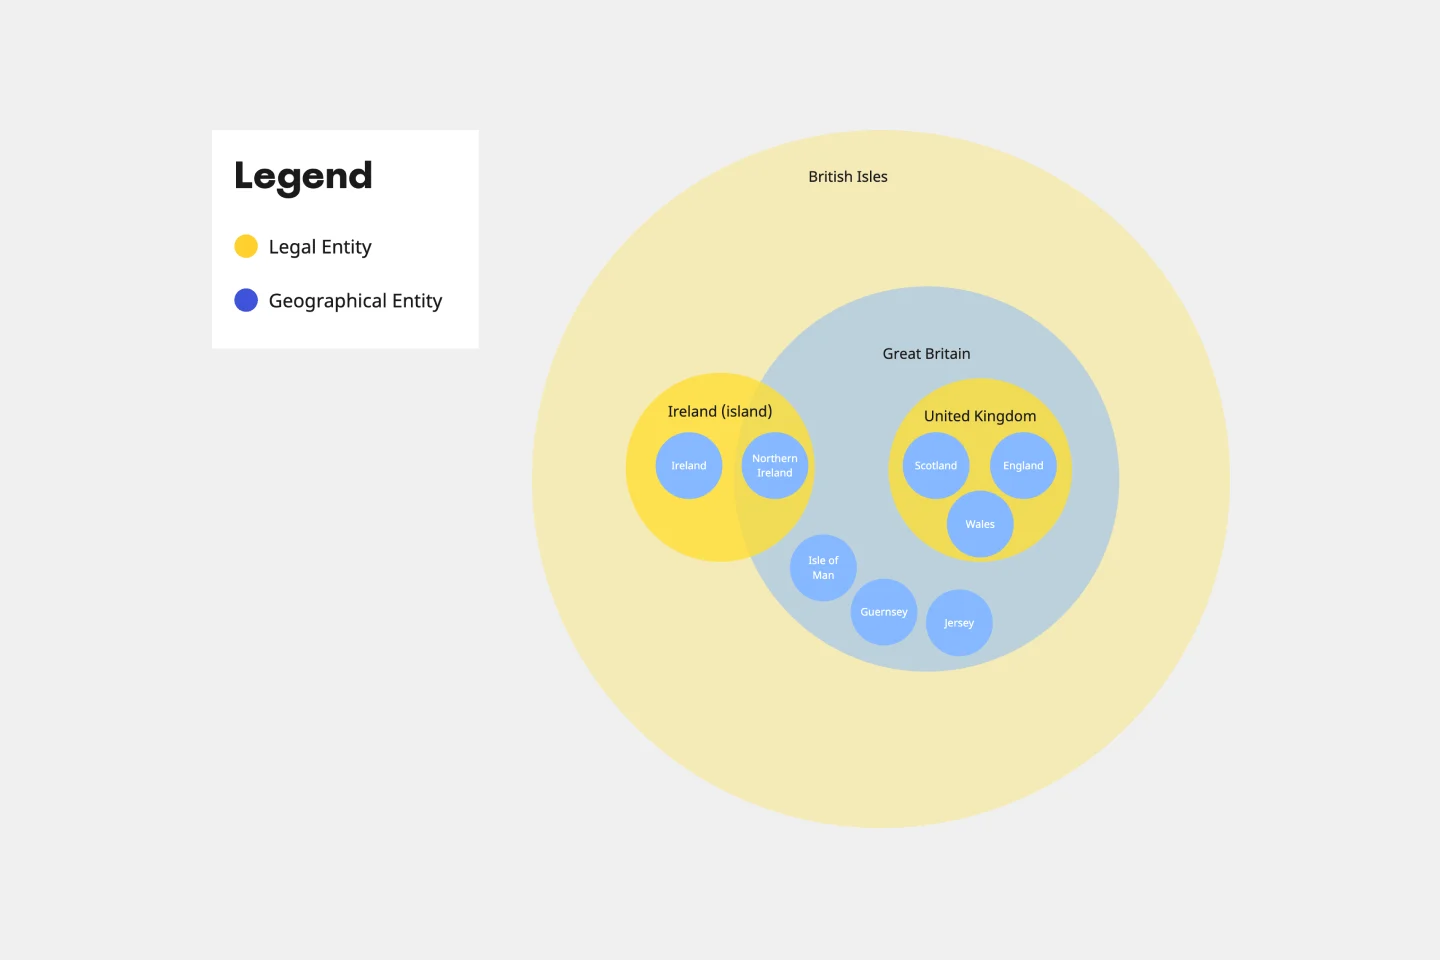
Euler Diagram Template
Works best for:
Business Management, Operations, Diagrams
Euler diagrams are valuable for showing different relationships between subjects by representing them with circles or "cells." Euler diagrams are frequently used in IT systems to show how objects relate to one another and how they interact. However, you can use them for any sort of explanation that needs to show connections.
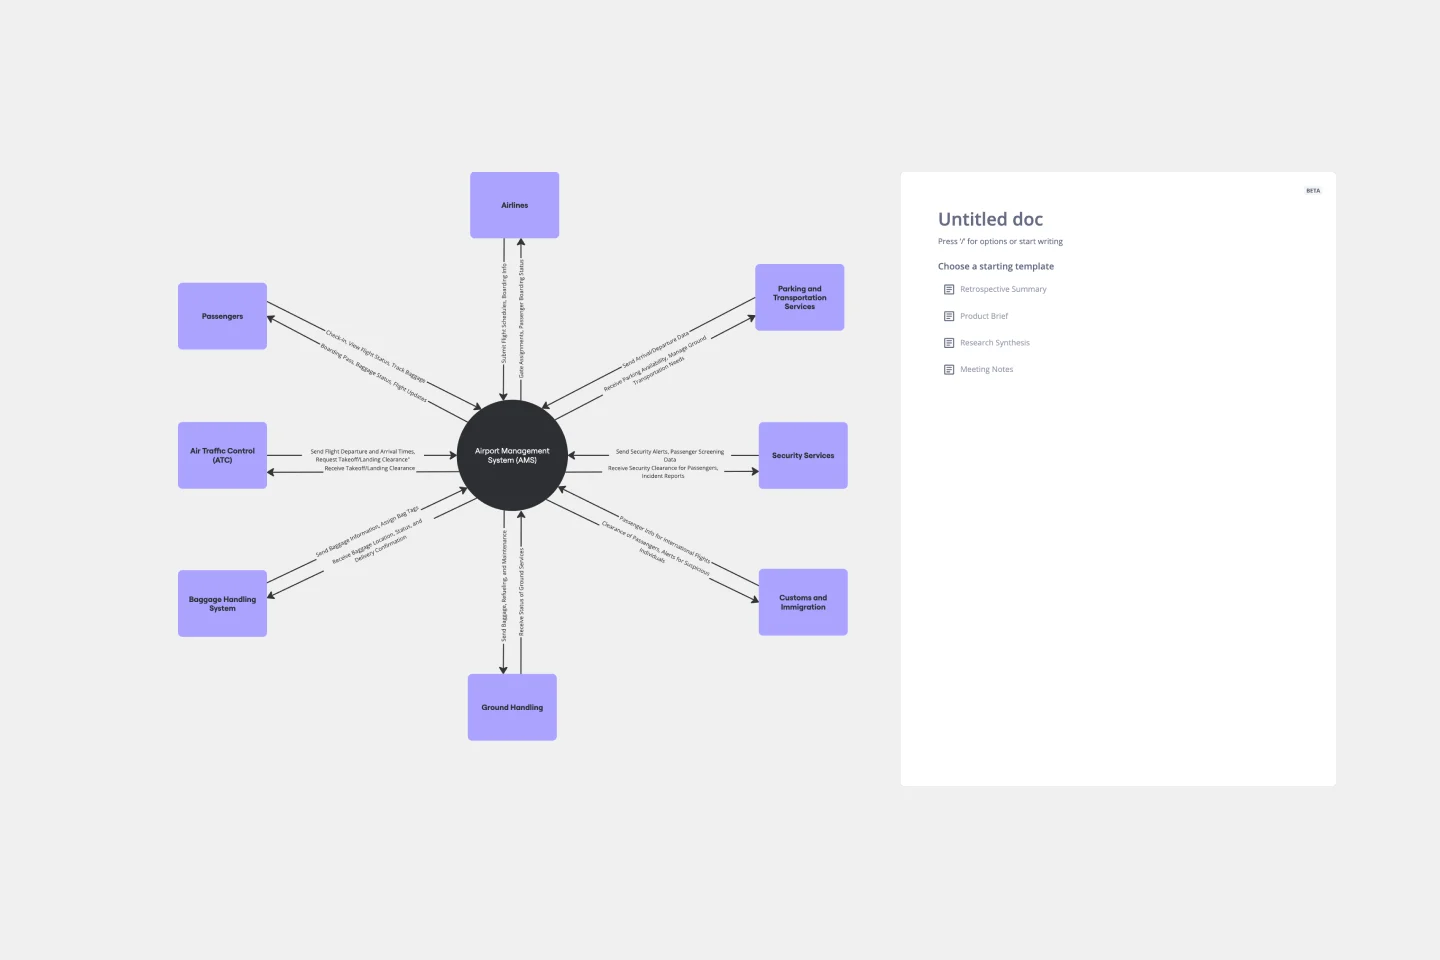
Context Diagram Template
Works best for:
Business Management, Mapping, Diagrams
A context diagram is a perfect tool to view an entire system as a single process and understand how external factors interact with it. These external factors can include customers, developers, management, and more. The Context Diagram Template is your tool for creating this diagram.