About the CI/CD Diagram Template
Efficiency and reliability are crucial in software development, and the CI/CD template helps achieve both. It is a visual guide that facilitates the integration of Continuous Integration and Continuous Delivery practices into project management. The template streamlines the development process from writing code to deploying it to production.
This diagram outlines each phase of the CI/CD pipeline. It provides a clear structure for the sequence of events in the automation process, including code commits, unit tests, integration tests, and deployment. Each stage has designated areas where users can plot specific actions, such as automated builds or deployment schedules. By interacting with each segment, one can trace the path from code conception to delivery, ensuring transparency and manageability at every process step.
Each area in the template not only defines a specific stage in the CI/CD process but also serves as a conduit for collaboration, allowing team members to assign tasks, share updates, and maintain the integrity and continuity of the software delivery pipeline.
Source Code Management:
Repository for maintaining code versions and history (e.g., Git repositories).
Integration with hooks/triggers to notify the CI/CD pipeline of changes.
Branching strategies and merge policies are documented here.
Access control and review process for code contributions are outlined.
Automation Server:
Central system that orchestrates the build process and executes the pipeline.
Manages task scheduling, executes automated tests, and reports outcomes.
Configurations for building jobs and dependencies between them are handled here.
Often includes a dashboard or interface for monitoring build statuses and history.
Container Server:
Infrastructure for running and managing containers (e.g., Docker, Kubernetes).
Details containerization of the application for consistent deployment environments.
Describes image repositories and management for versioning of containerized services.
Specifies orchestration requirements, scaling policies, and health checks.
Staging Environment:
A mirror of the production environment used for final testing before release.
Deployment strategies such as blue-green deployments or canary releases are outlined.
Performance testing, security scanning, and user acceptance testing criteria are specified.
Mechanisms for monitoring and logging are established for pre-production vetting.
Production:
The live environment where the application is available to end-users.
Includes details on infrastructure management, scaling, load balancing, and disaster recovery.
Security measures, compliance standards, and real-time monitoring tools are documented.
Continuous Deployment strategies for pushing changes to users with minimal downtime are detailed.
How to use the CI/CD diagram template in Miro
To harness the full potential of the CI/CD template, follow these simple steps:
Customization: Click to edit text and drag-and-drop elements to tailor the template to your project's unique pipeline structure.
Expand the Framework: Effortlessly add more shapes and connector lines using the automated diagramming features to scale the pipeline to your needs.
Integrate Artifacts: Drag any artifact onto your board to contextualize each stage—documentation, code snippets, or test results.
Why should you use a CI/CD template?
The benefits of employing a CI/CD diagram template are considerable:
Clarity in process: It provides a visual representation of the development pipeline, making complex processes understandable at a glance.
Enhanced collaboration: Teams can work together more effectively with a common visual language and understanding of the workflow.
Time efficiency: Streamlines the development process by providing a clear roadmap from development to deployment, reducing time-to-market.
Error reduction: By visualizing each step, teams can identify and address potential issues early, minimizing the risk of errors in the production environment.
Continuous improvement: A CI/CD template enables ongoing optimization of development practices by making it easy to identify bottlenecks or redundant steps.
If you prefer to start from scratch, Miro's diagramming tool is intuitive and comes with a wide range of diagramming shapes in Miro's extensive library, so you'll find just what you need.
CI/CD Diagram Template FAQs
Can the CI/CD template handle multiple project pipelines?
Absolutely. The template can be replicated or adjusted to accommodate as many project pipelines as needed.
Is the CI/CD template suitable for teams new to CI/CD practices?
Yes, it's designed to be user-friendly, making it an excellent tool for teams of any experience level to visualize and understand CI/CD workflows.
How can I track changes made to the CI/CD template?
Changes are logged, and version history can be reviewed to track the evolution of the pipeline diagram over time.
Can I integrate third-party tools into the CI/CD template?
While the template itself is a visual representation, it can be used with various third-party tools by adding links or notes to specific parts of the template, creating a dynamic and integrated project environment.

Miro
Your virtual workspace for innovation
Miro is an innovation workspace designed for teams of every size, everywhere, to dream, design, and build the future together. Our mission? To empower these teams to create the next big thing, powered by AI at every step of the way. Over 90 million users around the world rely on Miro to untangle complex ideas, put customer needs first, and deliver products and services faster. All supported by best-in-class security, compliance, and scalability.
Categories
Similar templates
Production Flowchart Template
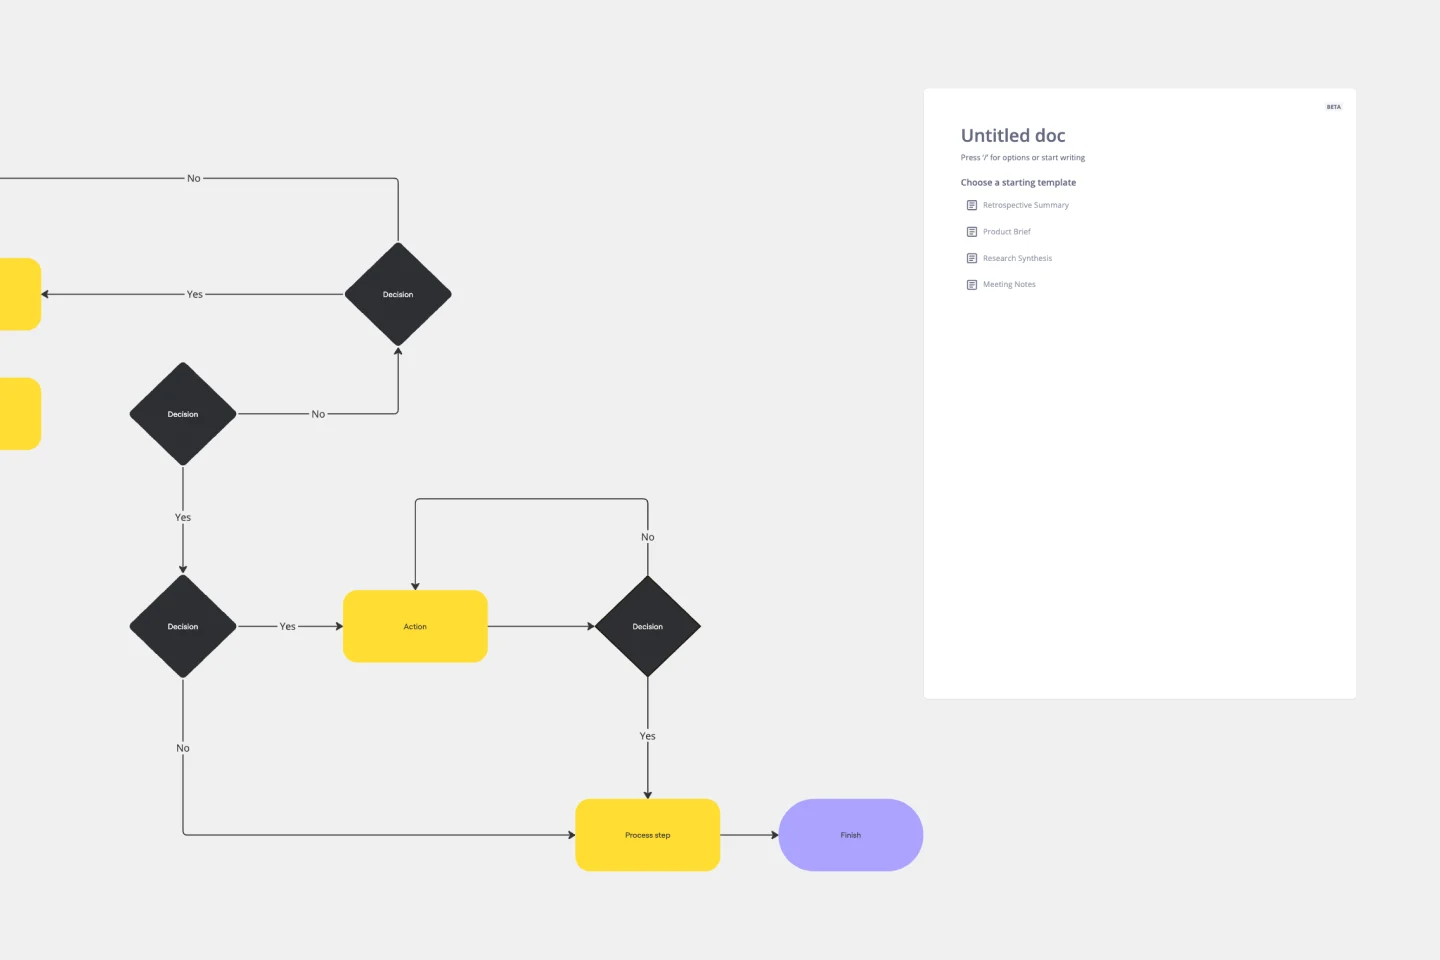
Production Flowchart Template
The Production Flowchart Template is a well-crafted tool that clearly represents a production process from start to finish. It breaks down complex procedures into easy-to-understand segments, making it easier for stakeholders to grasp the entire process. One of the key benefits of using this template is that it helps to clarify complex production pathways. By mapping out operations visually, teams can identify potential bottlenecks or inefficiencies, facilitating timely and well-informed decision-making.
Yes No Flowchart Template
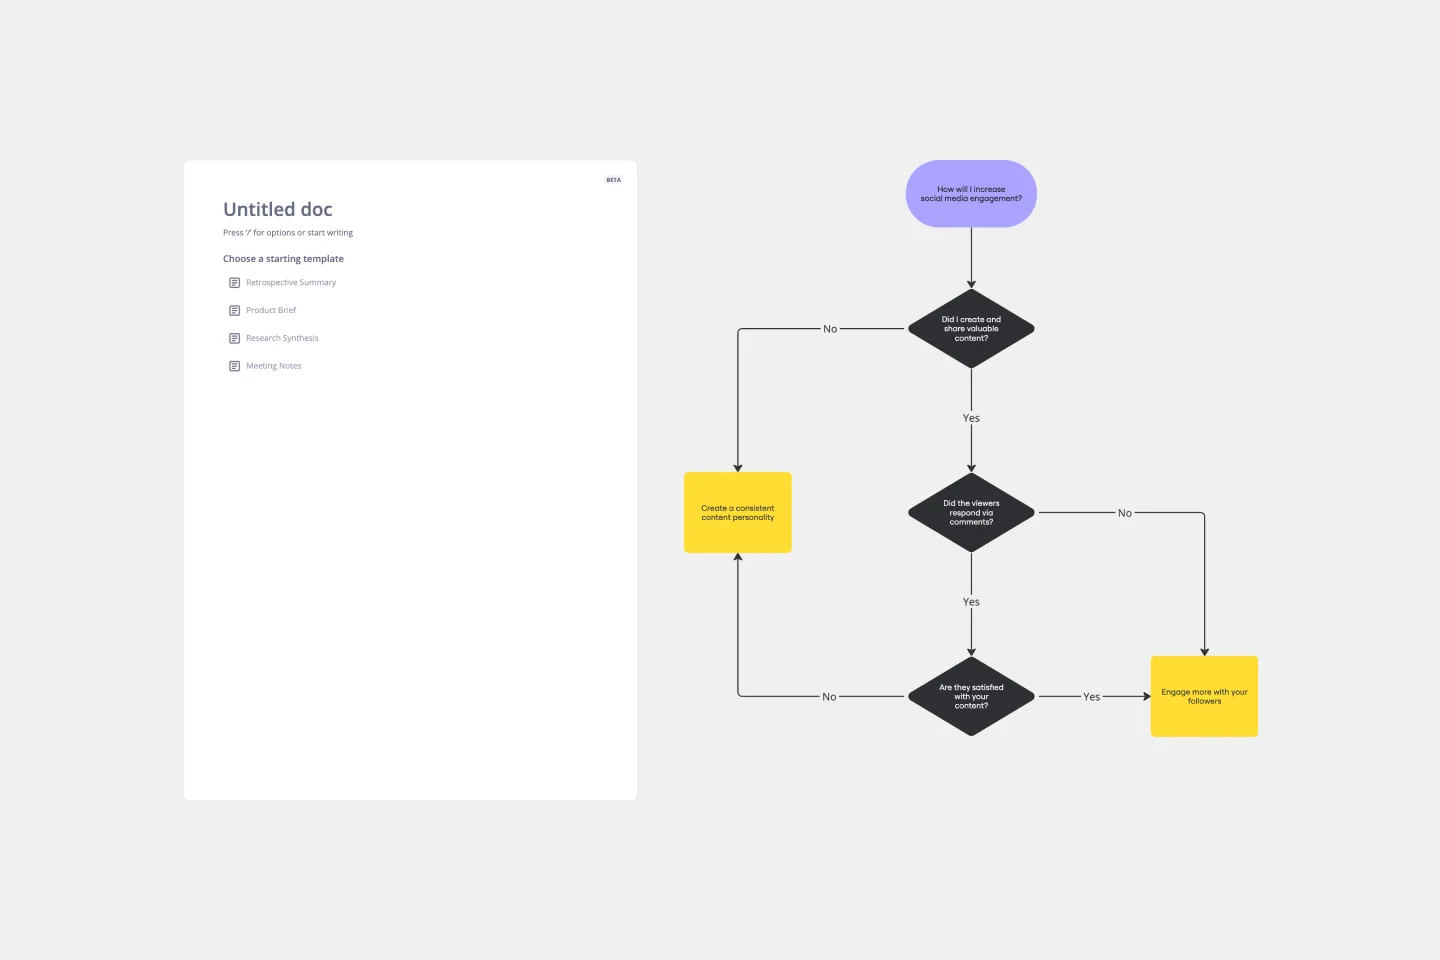
Yes No Flowchart Template
The Yes-No Flowchart Template is a simple and efficient tool that helps to simplify complex decision-making processes into clear and easy-to-follow steps. This template uses standard shapes to illustrate processes, decisions, and outcomes, with arrows that guide users from one action point to the next based on binary 'yes' or 'no' decisions. Its most prominent benefit is its ability to bring clarity to decision-making. By presenting processes visually, teams can effortlessly understand and navigate complex scenarios, ensuring that each step is transparent and reducing the potential for misunderstandings or missteps.
Workflow Diagram Template

Workflow Diagram Template
The Workflow Diagram Template maps out and represents processes or systems using standardized symbols and shapes. By delineating the various steps or stages in a process, it ensures that tasks flow seamlessly from initiation to completion. One of the standout benefits of using this template is its clarity. By translating processes into a visual format, all participants can gain a comprehensive understanding at a glance, eliminating confusion and ensuring everyone is on the same page. This clarity not only promotes efficient task execution but also fosters collaboration among team members.
UML Diagram Template
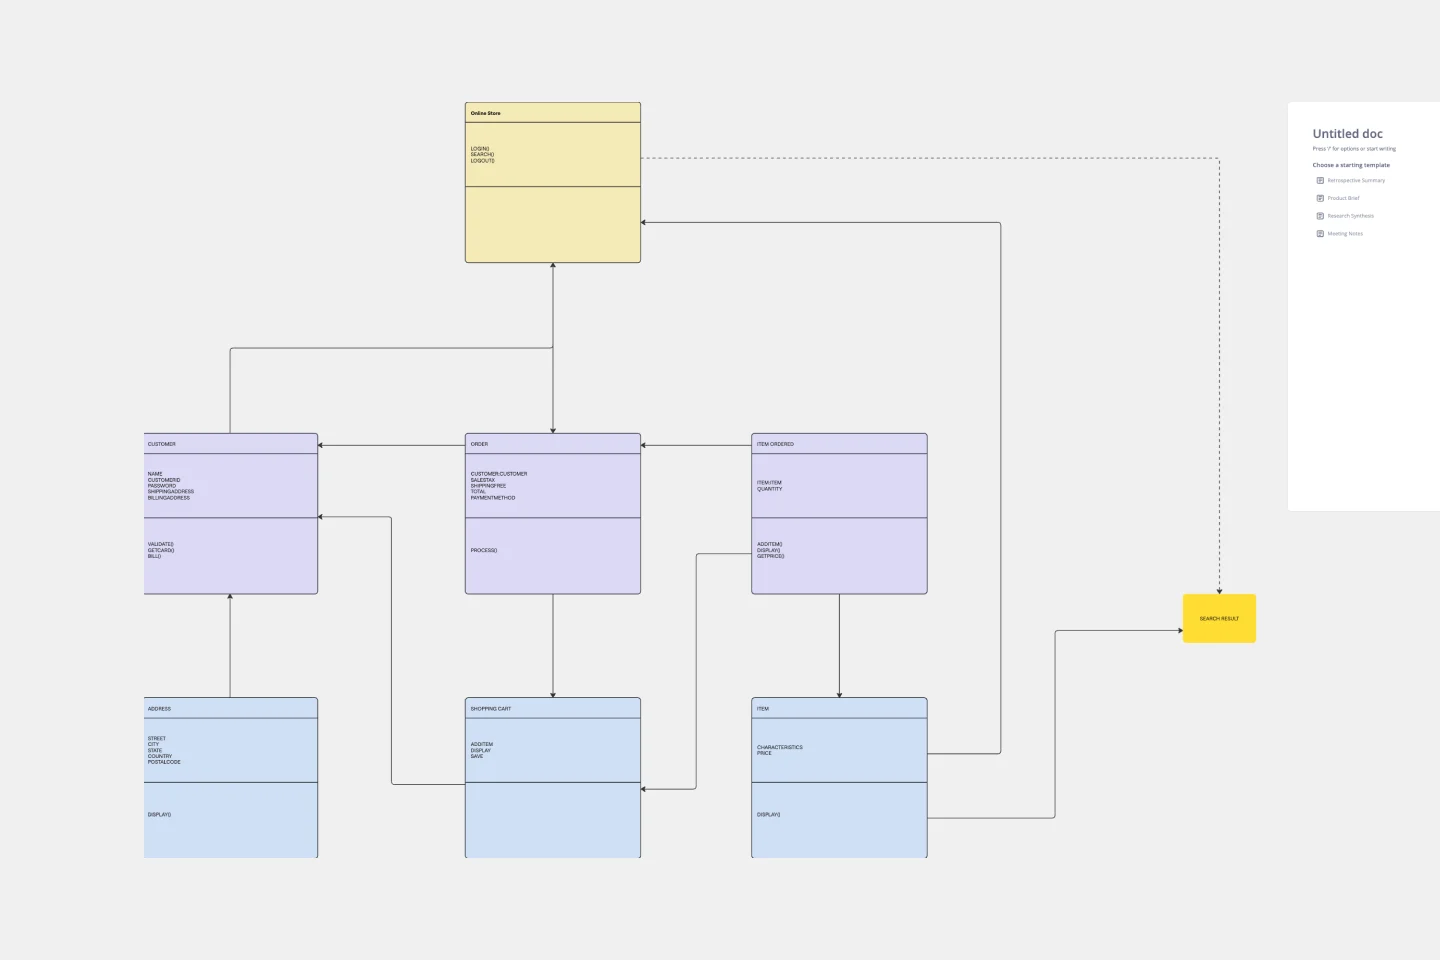
UML Diagram Template
Originally used as a modeling language in software engineering, UML has become a popular approach to application structures and documenting software. UML stands for Unified Modeling Language, and you can use it to model business processes and workflows. Like flowcharts, UML diagrams can provide your organization with a standardized method of mapping out step-by-step processes. They allow your team to easily view the relationships between systems and tasks. UML diagrams are an effective tool that can help you bring new employees up to speed, create documentation, organize your workplace and team, and streamline your projects.
Azure Data Flow Template
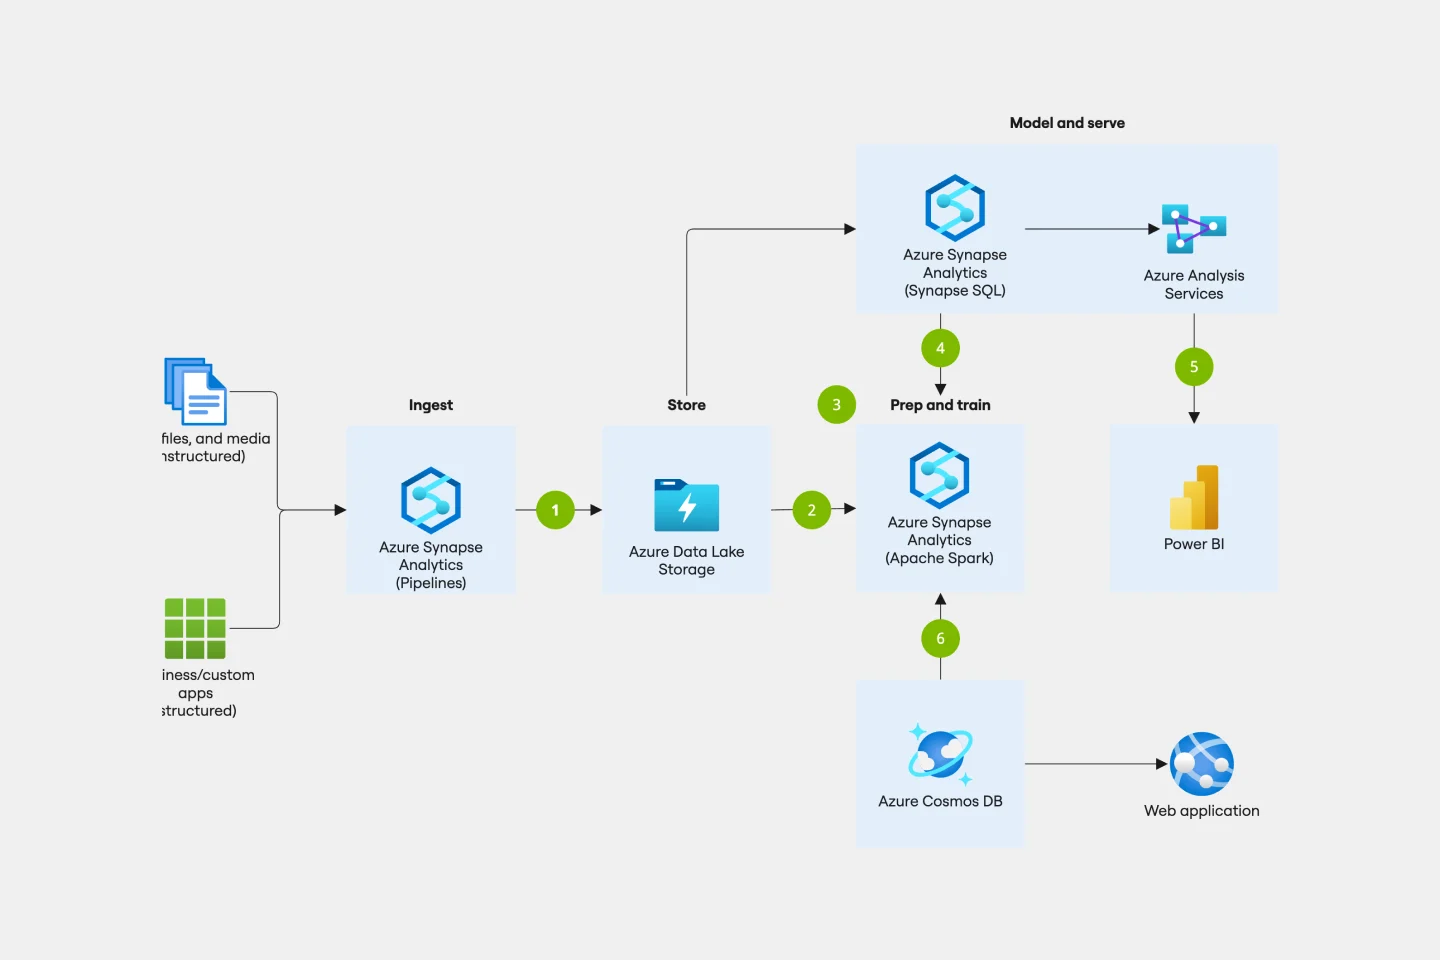
Azure Data Flow Template
The Azure Data Flow is a diagram that will allow you to combine data and build and deploy custom machine learning models at scale. Azure is Microsoft’s cloud computing platform, designed to provide many cloud-based services like remote storage, database hosting, and centralized account management. Azure also offers new capabilities like AI and the Internet of Things (IoT).
Production Flowchart Template
Production Flowchart Template
The Production Flowchart Template is a well-crafted tool that clearly represents a production process from start to finish. It breaks down complex procedures into easy-to-understand segments, making it easier for stakeholders to grasp the entire process. One of the key benefits of using this template is that it helps to clarify complex production pathways. By mapping out operations visually, teams can identify potential bottlenecks or inefficiencies, facilitating timely and well-informed decision-making.
Yes No Flowchart Template
Yes No Flowchart Template
The Yes-No Flowchart Template is a simple and efficient tool that helps to simplify complex decision-making processes into clear and easy-to-follow steps. This template uses standard shapes to illustrate processes, decisions, and outcomes, with arrows that guide users from one action point to the next based on binary 'yes' or 'no' decisions. Its most prominent benefit is its ability to bring clarity to decision-making. By presenting processes visually, teams can effortlessly understand and navigate complex scenarios, ensuring that each step is transparent and reducing the potential for misunderstandings or missteps.
Workflow Diagram Template
Workflow Diagram Template
The Workflow Diagram Template maps out and represents processes or systems using standardized symbols and shapes. By delineating the various steps or stages in a process, it ensures that tasks flow seamlessly from initiation to completion. One of the standout benefits of using this template is its clarity. By translating processes into a visual format, all participants can gain a comprehensive understanding at a glance, eliminating confusion and ensuring everyone is on the same page. This clarity not only promotes efficient task execution but also fosters collaboration among team members.
UML Diagram Template
UML Diagram Template
Originally used as a modeling language in software engineering, UML has become a popular approach to application structures and documenting software. UML stands for Unified Modeling Language, and you can use it to model business processes and workflows. Like flowcharts, UML diagrams can provide your organization with a standardized method of mapping out step-by-step processes. They allow your team to easily view the relationships between systems and tasks. UML diagrams are an effective tool that can help you bring new employees up to speed, create documentation, organize your workplace and team, and streamline your projects.
Azure Data Flow Template
Azure Data Flow Template
The Azure Data Flow is a diagram that will allow you to combine data and build and deploy custom machine learning models at scale. Azure is Microsoft’s cloud computing platform, designed to provide many cloud-based services like remote storage, database hosting, and centralized account management. Azure also offers new capabilities like AI and the Internet of Things (IoT).