Cause and Effect Diagram Template
Quickly analyze relationships and identify the root causes within a system with the cause and effect diagram template.
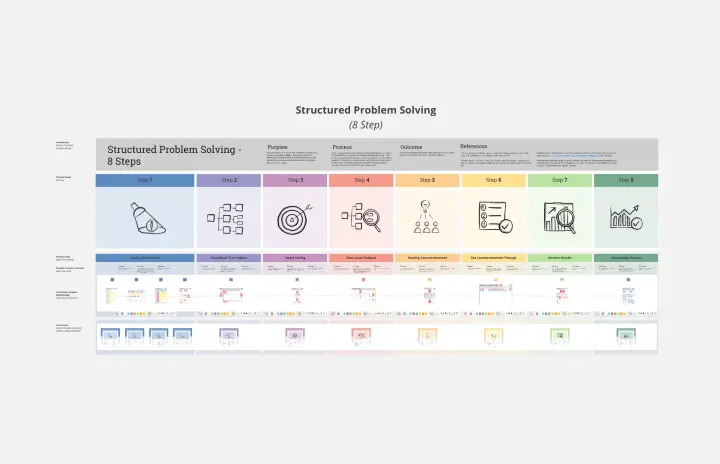
About the Cause and Effect Diagram Template
The cause-and-effect diagram template is an effective tool for analyzing complex relationships and identifying the root causes within a system. This template is a more straightforward version of the Fishbone or Ishikawa diagram. It is used to visually represent the cause-and-effect relationships in a structured manner. Whether you are solving problems, improving a process, or troubleshooting, this template provides a systematic approach to identifying and understanding the factors influencing a specific issue.
Understanding the cause and effect diagram template
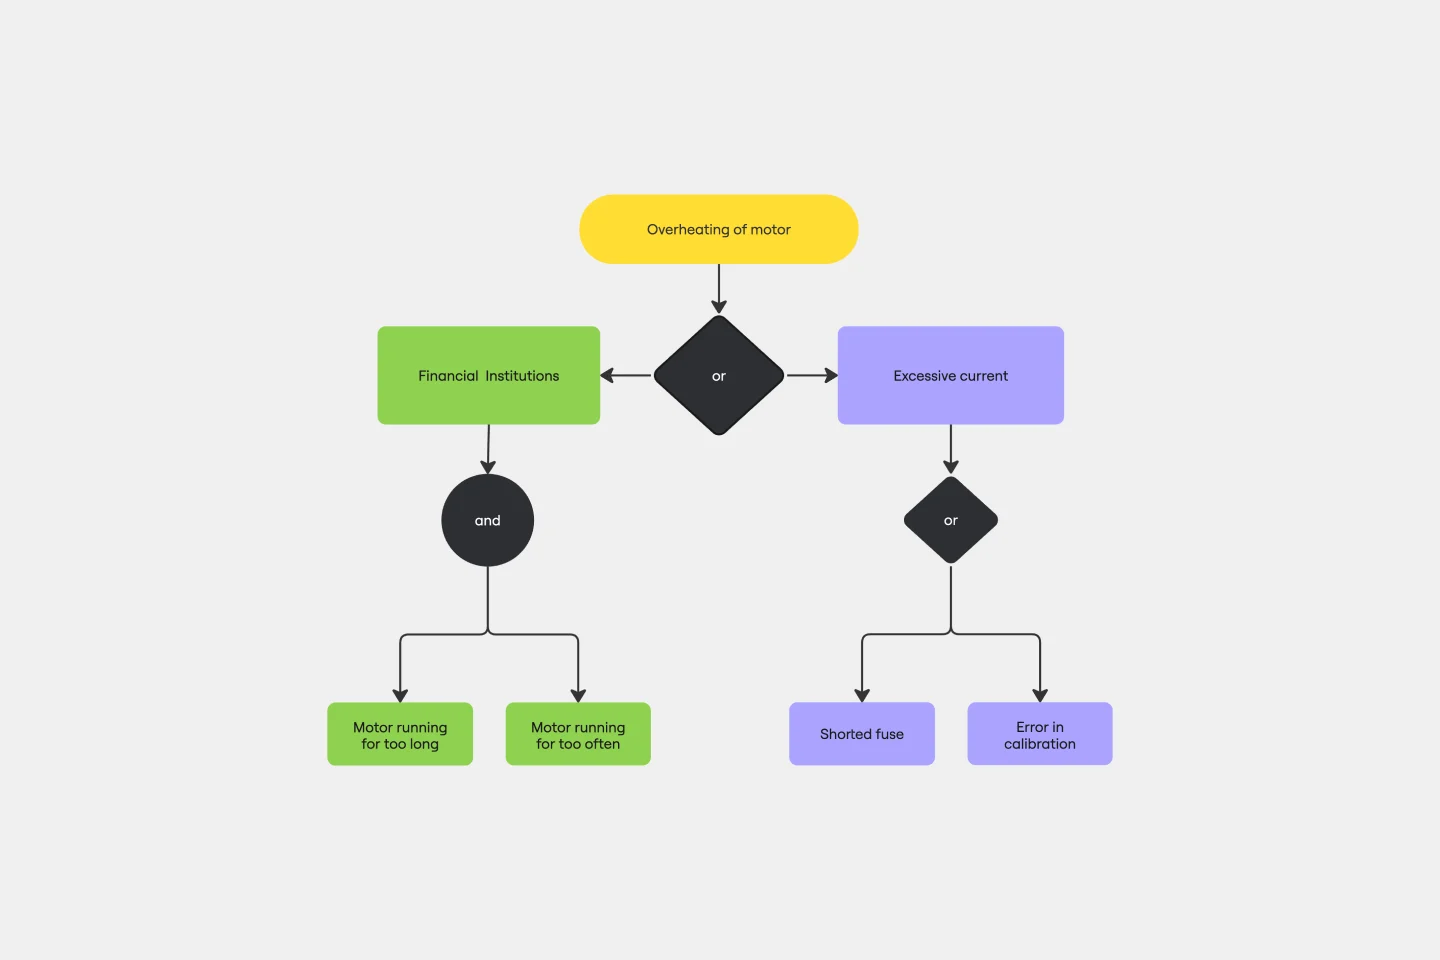
The cause and effect diagram template categorizes potential causes into branches. Here is how the template is built:
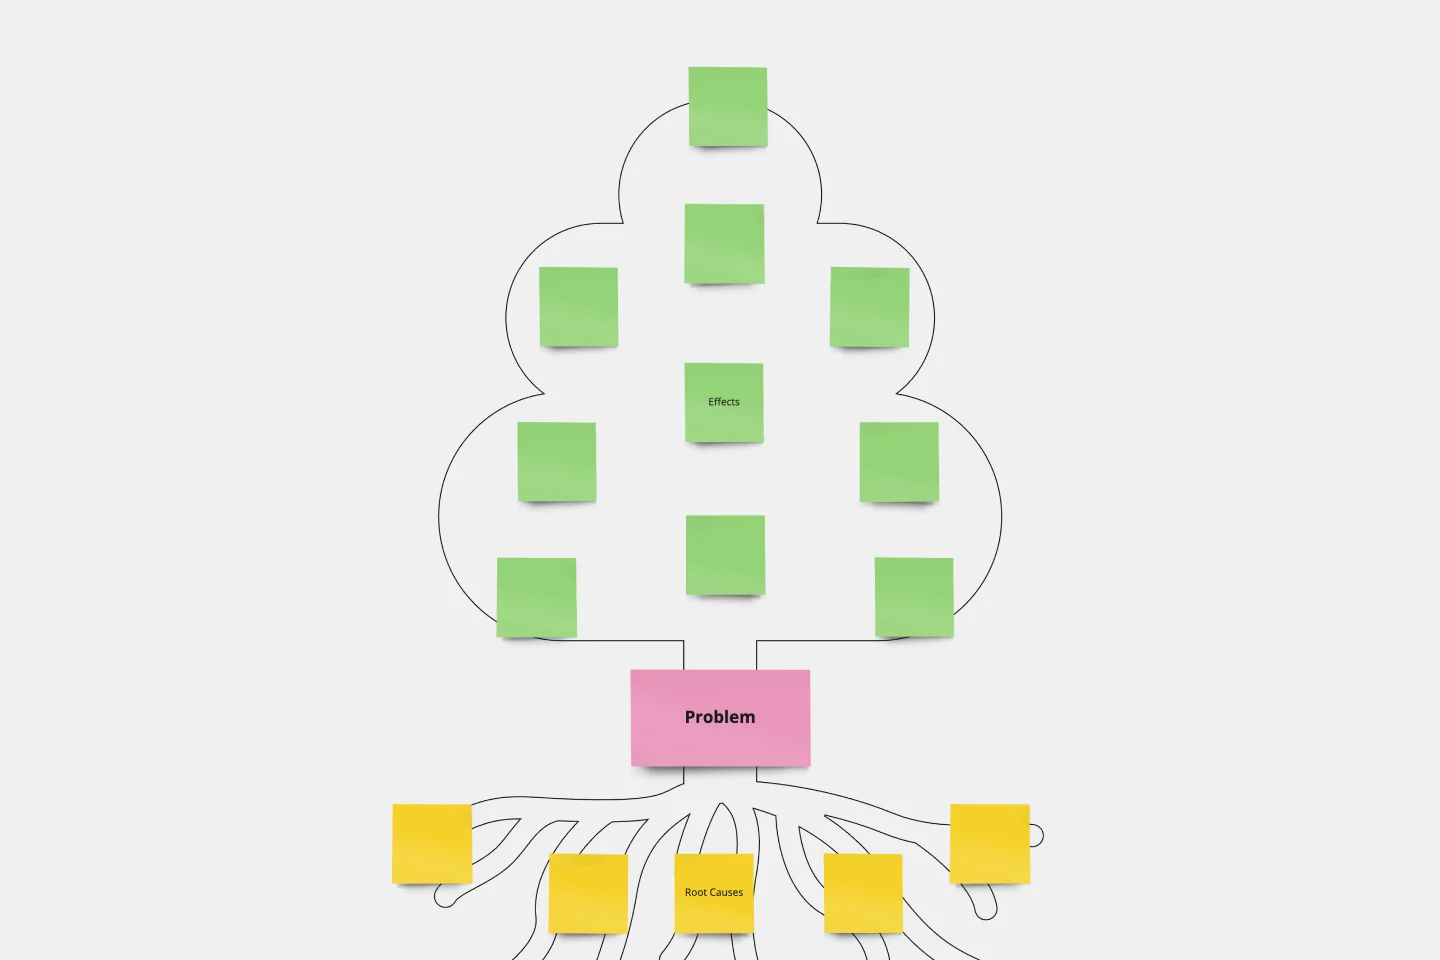
Problem statement: Clearly defines the identified issue as the central focal point for exploring potential causes.
Categories of causes: Organizes potential causes into branches, offering a systematic and categorized approach to analysis.
Main bones: Represents primary categories of causes as main branches extending from the spine of the fishbone diagram.
Sub-branches: Break down each main branch into sub-branches, thoroughly exploring potential causes.
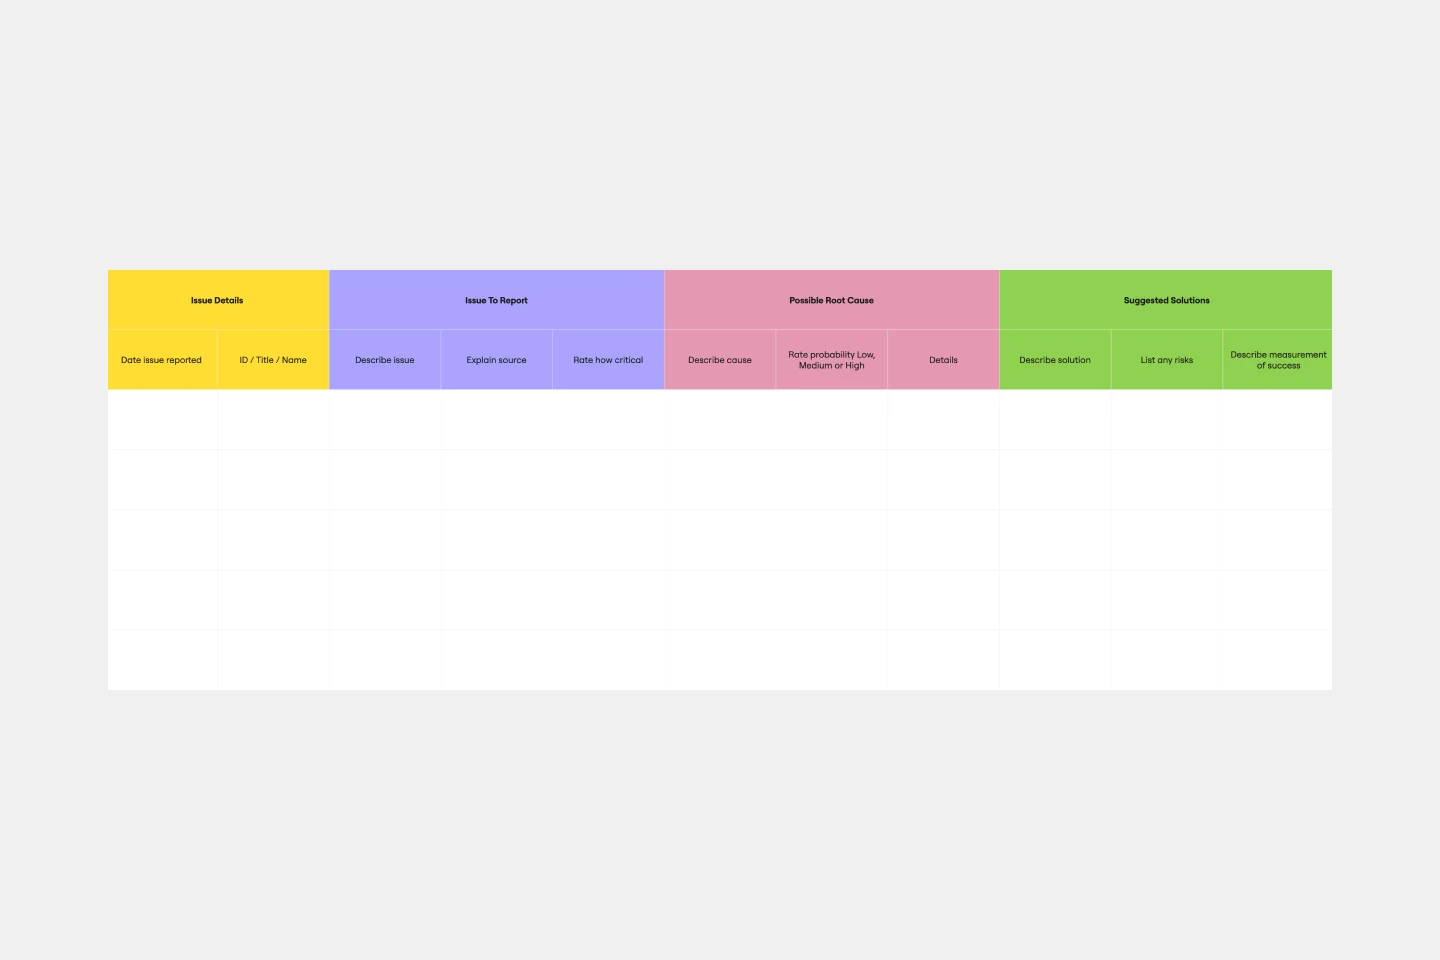
Analysis section: Dedicates space for in-depth analysis, enabling teams to fully explore each cause's impact on the identified problem.
How to use the cause and effect diagram template
Edit with precision: You can customize the template easily by using drag-and-drop functionality. This will help you address your specific problem and its potential causes.
Collaborative analysis: You can engage in real-time collaboration with your team members directly on the Miro board. This will foster collective analysis and brainstorming sessions.
Root cause identification: You can use the template to systematically identify root causes. This will help you gain a thorough understanding of the problem and enable you to solve it effectively.
Why should you use a cause-and-effect diagram template?
Structured problem analysis: Organize and analyze potential causes systematically, providing a structured framework for identifying the root cause of a problem.
Team collaboration: Facilitate collaborative problem-solving sessions, ensuring diverse perspectives contribute to a comprehensive analysis.
Visual clarity: Enhance understanding through visual representation, facilitating comprehension of complex cause-and-effect relationships.
Strategic decision-making: Equip teams with insights to make informed and strategic decisions based on a thorough understanding of the problem's causes.
Process improvement: Drive continuous improvement by systematically addressing root causes enhancing efficiency and effectiveness within processes.
Is there a recommended order for exploring the causes in the template?
While there is no strict order, initiating analysis with main branches and progressively exploring sub-branches for a thorough and structured examination is often beneficial.
Can I export or share the Cause and Effect Diagram created in Miro with stakeholders outside the platform?
Miro offers export and sharing features, allowing users to share the diagram with stakeholders outside the platform for review and collaboration.
Get started with this template right now.
Serverless Image Handler on AWS Template
Works best for:
AWS
The Serverless Image Handler on AWS template is designed to facilitate the management and transformation of images in cloud-based projects without the need for server infrastructure management. It is particularly useful for applications and projects that require dynamic image management, offering benefits like efficiency, scalability, and seamless integration with AWS services. By incorporating this template into Miro boards or projects, teams can streamline their workflows, especially when dealing with digital assets or dynamic content, ensuring that their image-handling needs are met efficiently as they scale.
Influence Diagram Template
Works best for:
Business Management, Decision Making, Diagrams
See the big picture of any business decision with this Influence Diagram Template. You’ll define the decision you have to make and brainstorm everything that could impact it. When you build connections between these factors, you’ll be able to put the right amount of weight into each one as you make your decision.
Bubble Map Template
Works best for:
Diagramming, Mapping, Brainstorming
A Bubble Map Template is a visual organization tool that uses bubbles or circles to represent various ideas or data points. These bubbles are linked together, displaying their relationships and creating a network of interconnected thoughts. Use a Bubble Map Template to streamline complex information, enhancing comprehension and promoting efficient decision-making.
Causal Loop Diagrams (1.0)
Works best for:
Diagramming
The Causal Loop Diagrams (1.0) template offers a visual tool for modeling complex systems and understanding the feedback loops that drive behavior. It provides a structured framework for identifying causal relationships, reinforcing loops, and balancing feedback within a system. This template enables teams to analyze system dynamics, anticipate unintended consequences, and formulate effective strategies for intervention. By promoting systems thinking and understanding of interdependencies, Causal Loop Diagrams empower organizations to navigate complexity and drive sustainable change.
Miro x AWS: Accelerate your cloud journey
Works best for:
Diagramming
The Miro x AWS: Accelerate your cloud journey template offers a visual framework for planning and executing cloud migration and optimization projects using Amazon Web Services (AWS). It provides elements for mapping out cloud architectures, migration strategies, and cost optimization initiatives. This template enables teams to collaborate effectively, align on objectives, and accelerate their cloud journey with AWS services. By promoting collaboration and alignment, the Miro x AWS template empowers organizations to leverage AWS cloud technologies efficiently and achieve their business objectives effectively.
BPM
Works best for:
Diagramming
The BPM (Business Process Management) template is a visual tool for modeling, analyzing, and optimizing business processes. It provides a structured framework for documenting process flows, identifying bottlenecks, and improving efficiency. This template enables organizations to streamline operations, enhance productivity, and drive business performance. By promoting process transparency and agility, the BPM template empowers teams to achieve operational excellence and deliver value to stakeholders.