About the Burndown Chart Template
Burndown charts are visual graphs that show teams how much work is left to complete and how much time is available to finish the job.
A typical layout will have two lines representing the volume of work and the number of workdays. Team members leading and executing the day-to-day workload can use a burndown chart to make realistic project estimates.
The visual format helps project managers figure out the difference between the “ideal” progress of work and how the “actual” work is tracking. Teams can use a burndown chart to work toward specific goals and finish a project on time and within budget.
When to use a burndown chart
A burndown chart is a useful project management tool and can be a quicker alternative to a Kanban board or a Gantt Chart. With a burndown, the team can focus on the time left to finish tasks instead of each task’s specific breakdowns.
As a visual reference, burndown charts encourage team transparency and awareness of how much work is getting done on a day-to-day basis.
Burndown charts can also help individual team members realize their pace of work. By checking on it at least once a day, everyone can figure out how to adjust or maintain their output level according to project needs.
How to use the burndown chart template
Making your own burndown chart is easy with Miro's template. Simply follow these steps to get started:
1. Set a target
Set a target for the ideal number of story points you need to finish. Once “total story points” is set, that number should stay untouched for the duration of your team’s sprint.
By default, this template assumes your sprint will last 2.5 weeks. You can edit the X-axis to accommodate week-long, fortnightly, or month-long sprints as well. Your team should keep an eye on the “completed” and “remaining” numbers as these will be updated daily.
2. Set the completion rate
Edit the “ideal” completion rate line to set your target. The grey dotted line represents what the best-case productivity rate would look like. Consider this your visual baseline for whether or not your project is on track.
3. Add to the "completed" storyline
As your team completes story points on a daily basis, update the relevant sticky notes. Grow the solid line that represents your team’s actual completion rate by adding daily extensions. Keep in mind non-working days like weekends or public holidays where progress slows down or isn't expected.
4. Check-in regularly
Keep an open line of communication with your team to set expectations, predict risks, and keep your project on track. Priorities will evolve, and stakeholders may come back to your team with new requests. If your team keeps a record of their progress, they can push back on unreasonable requests together.
A burndown chart tracks your team’s daily progress honestly. Burndowns should also account for when new items are added after the sprint kicks off.
5. Plan future sprints based on previous ones
Use the chart as a reference to plan for future sprints. The chart can help you visualize the impact of new stakeholder requests over time and how much your team can do in an allocated sprint period. Notice a large productivity spurt at the end of your sprint? Break tasks into smaller, manageable tasks for your next sprint.

Miro
Your virtual workspace for innovation
Miro is an innovation workspace designed for teams of every size, everywhere, to dream, design, and build the future together. Our mission? To empower these teams to create the next big thing, powered by AI at every step of the way. Over 90 million users around the world rely on Miro to untangle complex ideas, put customer needs first, and deliver products and services faster. All supported by best-in-class security, compliance, and scalability.
Categories
Similar templates
Product Development Roadmap Template
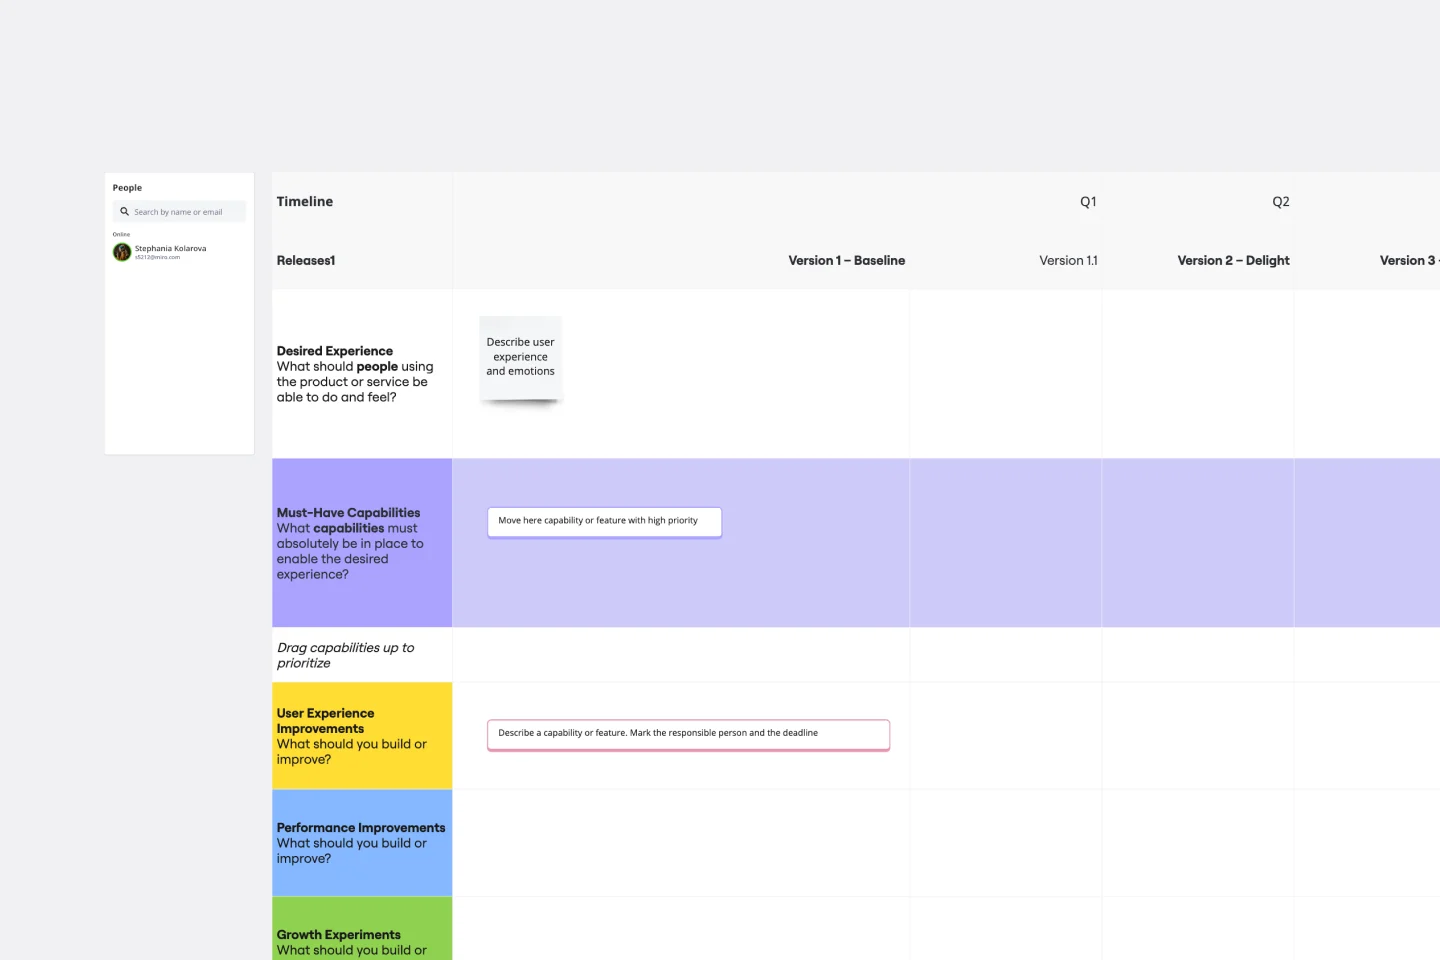
Product Development Roadmap Template
Product development roadmaps cover everything your team needs to achieve when delivering a product from concept to market launch. Your product development roadmap is also a team alignment tool that offers guidance and leadership to help your team focus on balancing product innovation and meeting your customer’s needs. Investing time in creating a roadmap focused on your product development phases helps your team communicate a vision to business leaders, designers, developers, project managers, marketers, and anyone else who influences meeting team goals.
DevOps Roadmap Template
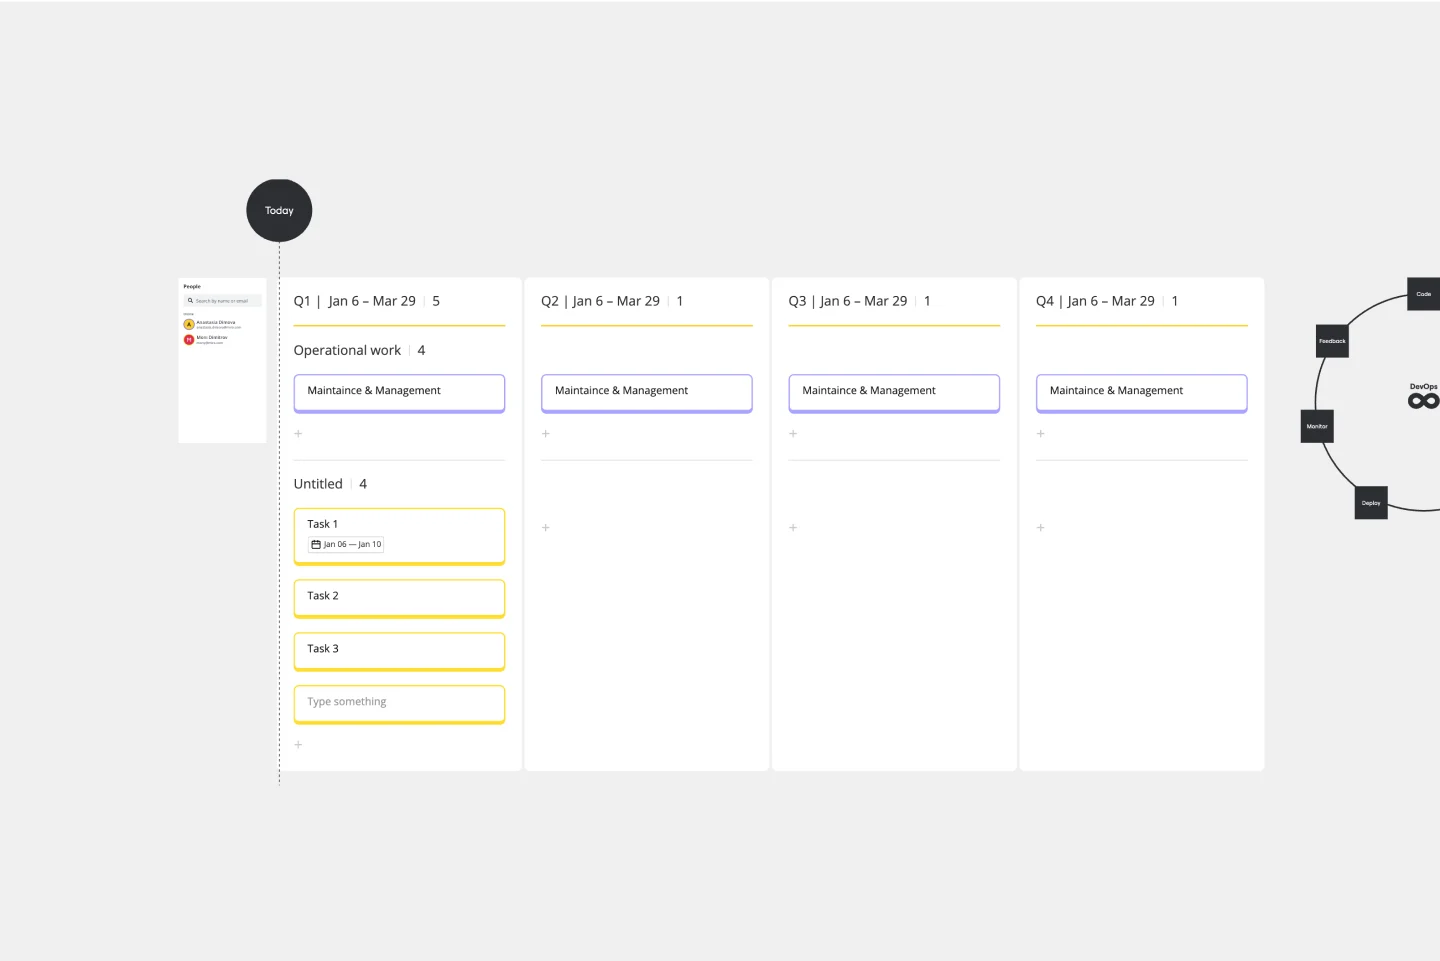
DevOps Roadmap Template
DevOps teams are constantly creating code, iterating, and pushing it live. Against this backdrop of continuous development, it can be hard to stay abreast of your projects. Use this DevOps Roadmap template to get a granular view of the product development process and how it fits into your organization's product strategy. The DevOps Roadmap lays out the development and operations initiatives you have planned in the short term, including milestones and dependencies. This easy-to-use format is easily digestible for audiences such as product, development, and IT ops.
Gantt Chart Template
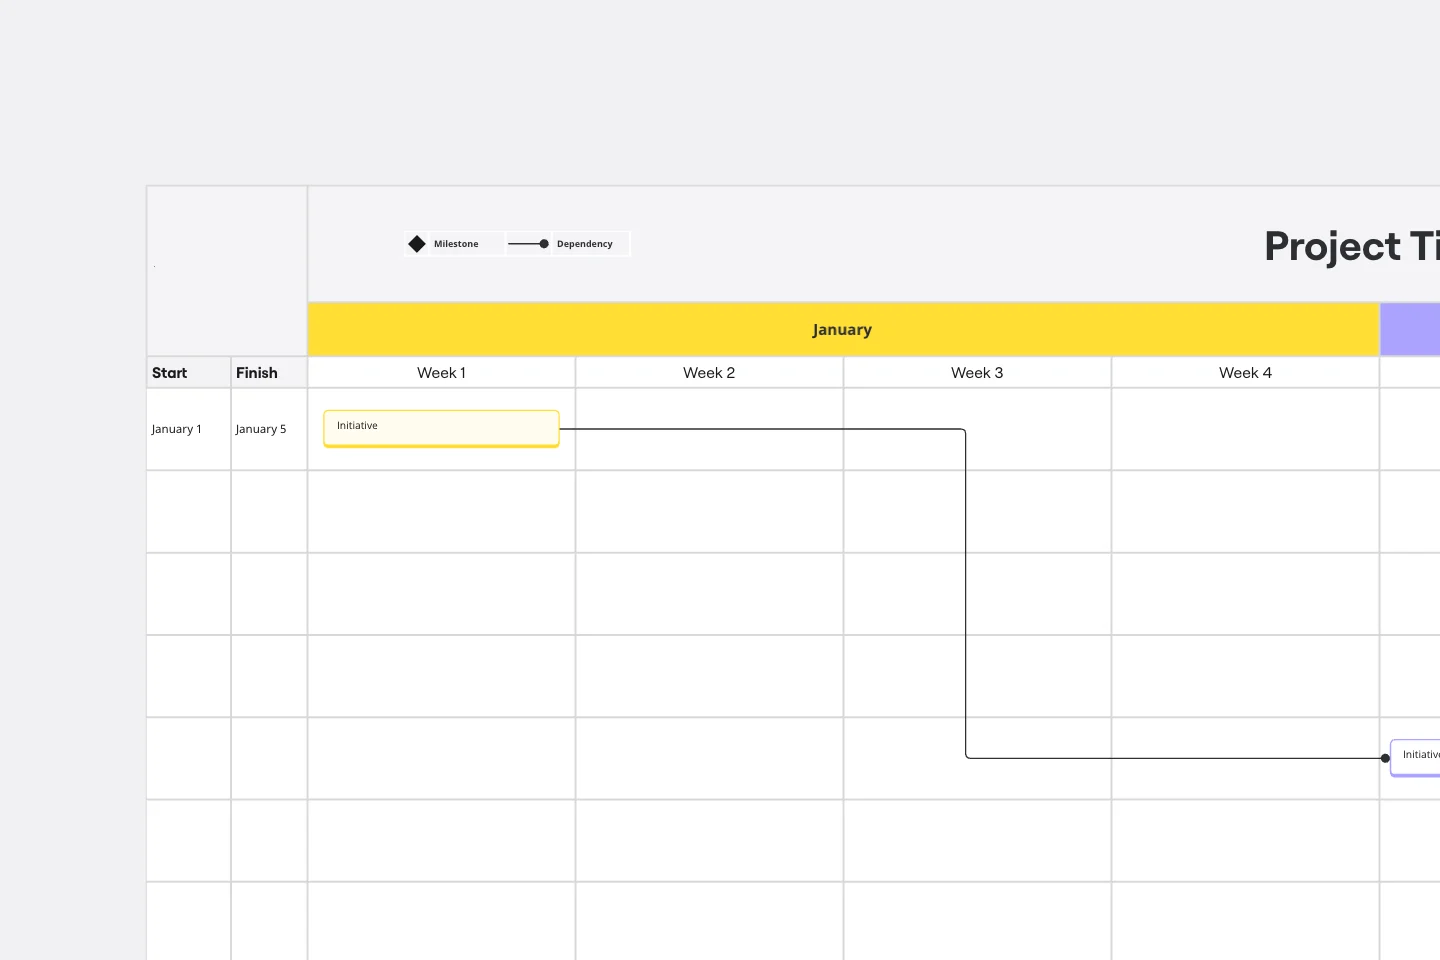
Gantt Chart Template
Simplicity, clarity, and power — that’s what make Gantt charts such a popular choice for organizing and displaying a project plan. Built upon a horizontal bar that represents the project progress over time, these charts break down projects by task, allowing the whole team to see the task status, who it’s assigned to, and how long it will take to complete. Gantt charts are also easily shareable among team members and stakeholders, making them great tools for collaboration.
Product Development Roadmap Template
Product Development Roadmap Template
Product development roadmaps cover everything your team needs to achieve when delivering a product from concept to market launch. Your product development roadmap is also a team alignment tool that offers guidance and leadership to help your team focus on balancing product innovation and meeting your customer’s needs. Investing time in creating a roadmap focused on your product development phases helps your team communicate a vision to business leaders, designers, developers, project managers, marketers, and anyone else who influences meeting team goals.
DevOps Roadmap Template
DevOps Roadmap Template
DevOps teams are constantly creating code, iterating, and pushing it live. Against this backdrop of continuous development, it can be hard to stay abreast of your projects. Use this DevOps Roadmap template to get a granular view of the product development process and how it fits into your organization's product strategy. The DevOps Roadmap lays out the development and operations initiatives you have planned in the short term, including milestones and dependencies. This easy-to-use format is easily digestible for audiences such as product, development, and IT ops.
Gantt Chart Template
Gantt Chart Template
Simplicity, clarity, and power — that’s what make Gantt charts such a popular choice for organizing and displaying a project plan. Built upon a horizontal bar that represents the project progress over time, these charts break down projects by task, allowing the whole team to see the task status, who it’s assigned to, and how long it will take to complete. Gantt charts are also easily shareable among team members and stakeholders, making them great tools for collaboration.