About the Bubble Map Templates Collection
Bubble map templates are a versatile tool designed to help you visually organize and connect ideas, concepts, or data points. These templates use bubbles or circles to represent different elements, which are then linked together to show their relationships. Whether you're brainstorming, planning, or presenting, bubble map templates can simplify complex information and make it more digestible.
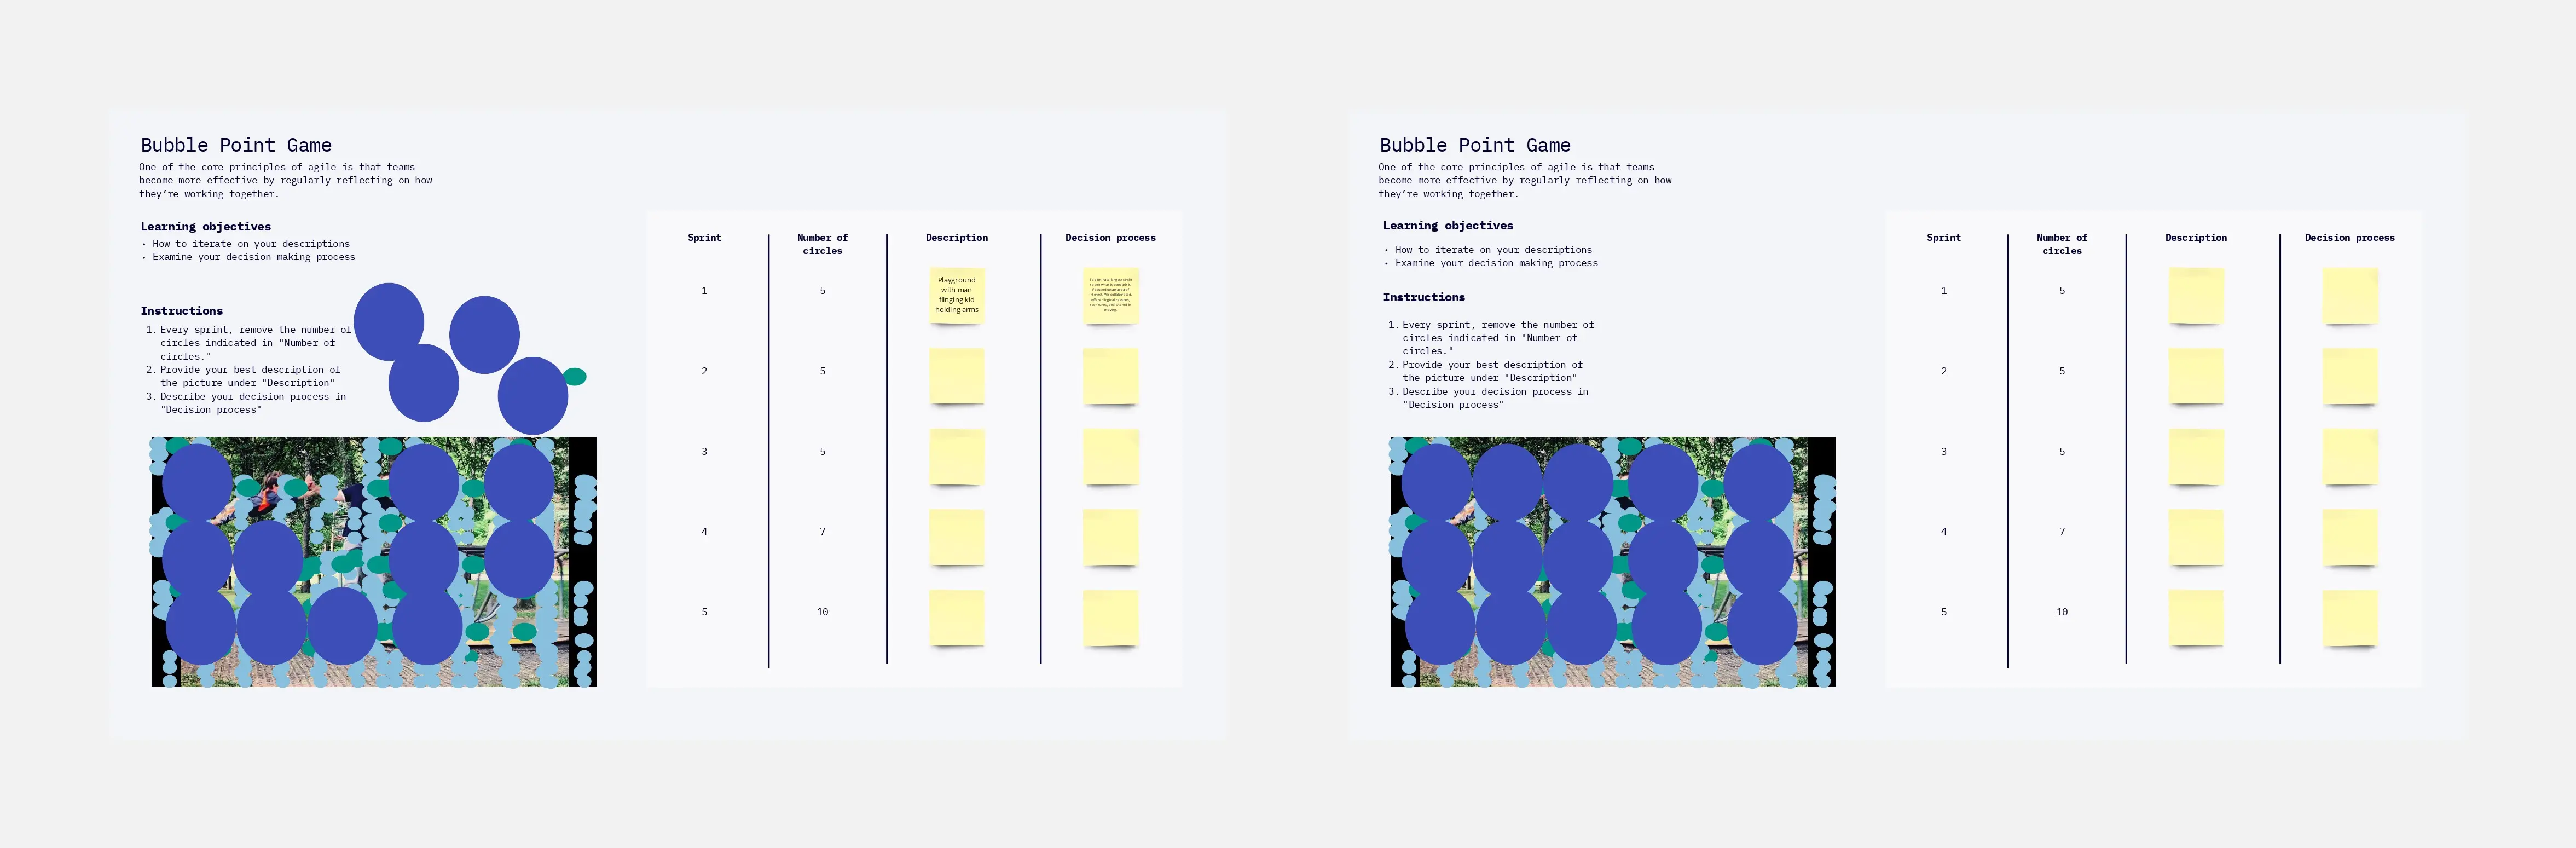
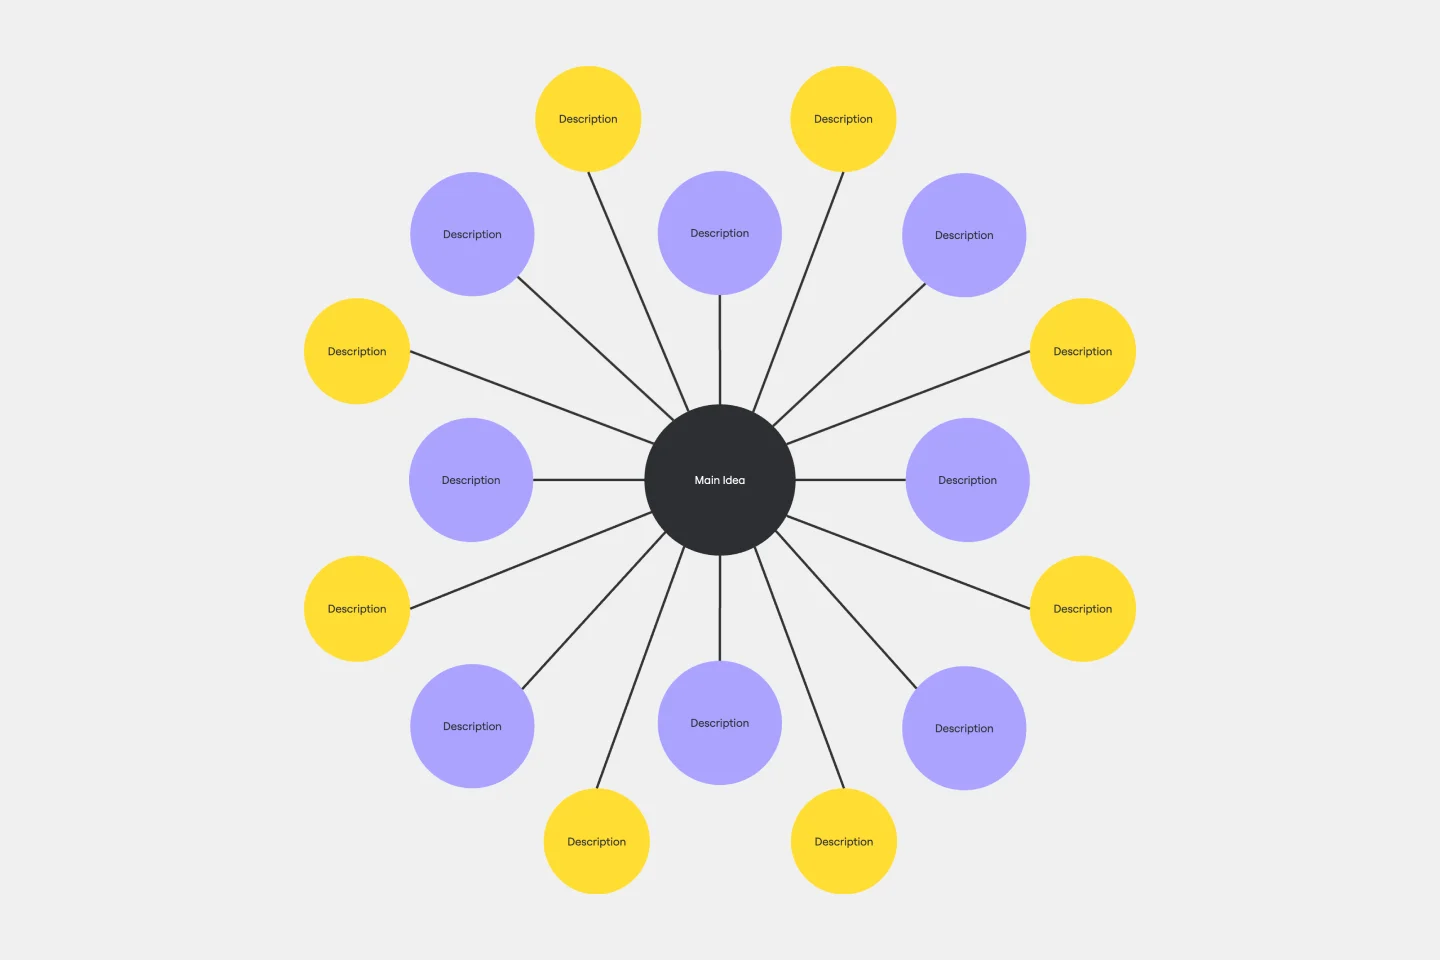
What's a Bubble Map Template?
A Bubble Map Template is a diagramming tool used for visually organizing information. The diagram uses varying-sized circles or "bubbles" to represent concepts and lines to denote relationships or connections between them. It's a great tool for understanding complex systems, brainstorming ideas, or visualizing hierarchies and relationships.
Why should you use it?
Bubble maps help streamline thoughts, ideas, and information in an easily digestible format. They encourage critical thinking and facilitate understanding of relationships and patterns within complex data.
Why you'll love our bubble map templates
Using bubble map templates in Miro offers many benefits:
Enhanced visualization: Bubble maps provide a clear and visually appealing way to display relationships between ideas or data points.
Improved organization: They help in structuring thoughts and information logically, making it easier to understand and follow.
Collaboration: Miro's collaborative features allow multiple team members to work on the same bubble map in real time, fostering teamwork and idea sharing.
Flexibility: These templates can be used for various purposes, including online brainstorming sessions, project planning, and presentations.
Accessibility: Miro offers free bubble map templates, making it easy for anyone to start organizing their ideas without any cost.
How to use the bubble map templates in Miro
Select a template: Start by choosing a bubble map template from Miro's template library. You can find a variety of free bubble map templates that suit different needs.
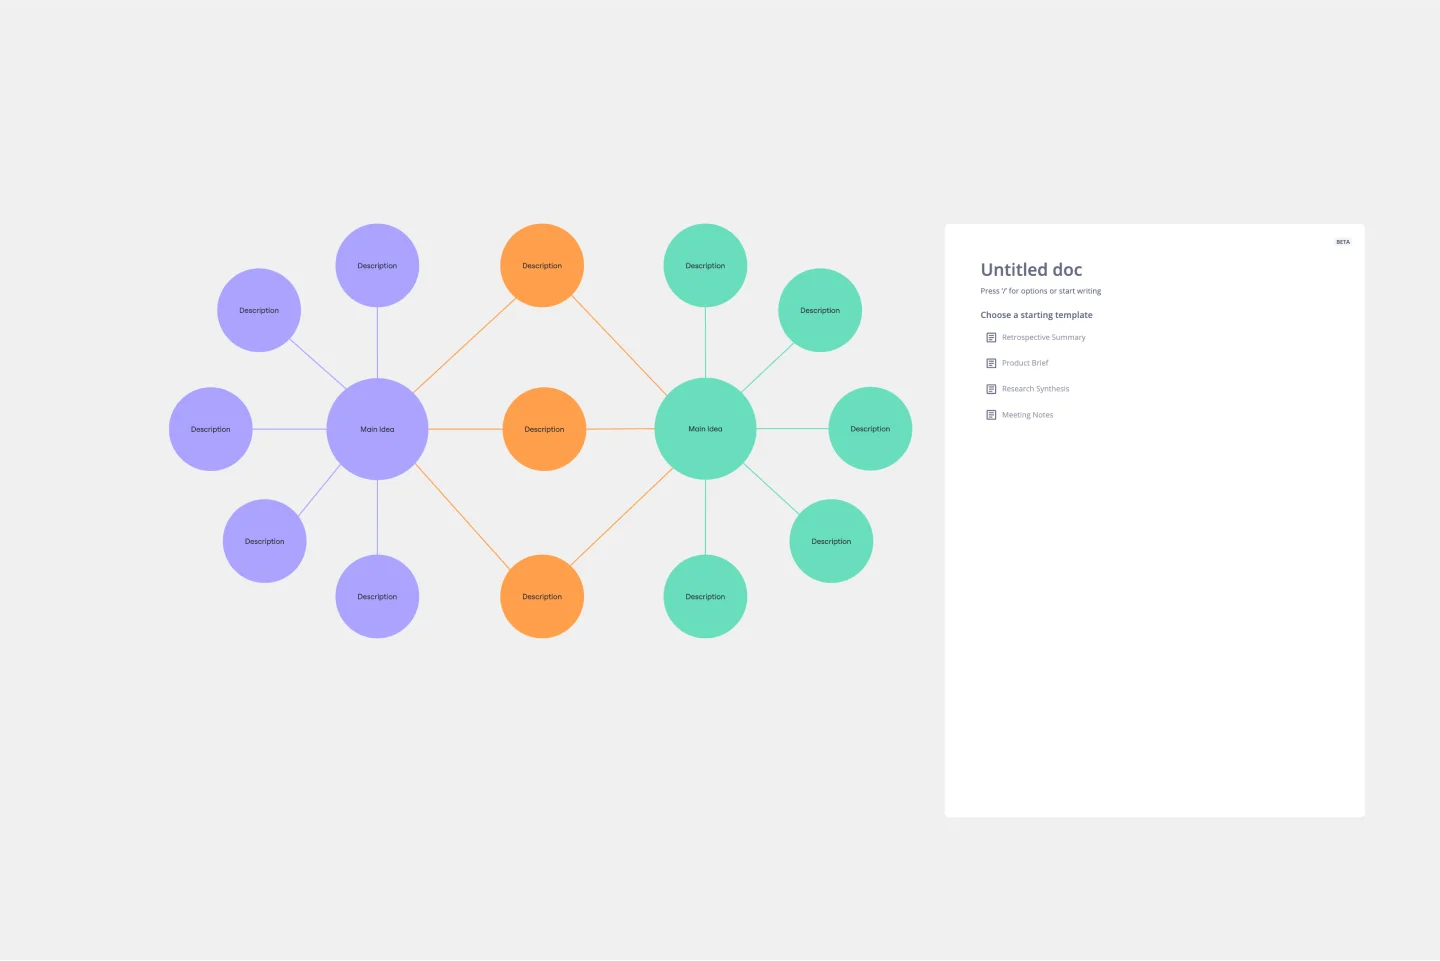
Customize your map: Add your main idea or topic in the central bubble. From there, create additional bubbles for related subtopics or data points. Use lines or arrows to connect these bubbles, illustrating their relationships.
Add details: Enhance your map by adding text, images, or icons to each bubble. This can help provide more context and make your map more informative.
Collaborate: Invite team members to join your Miro board. They can add their own bubbles, make connections, and provide feedback in real time.
Review and refine: Regularly review your bubble map to ensure it accurately represents your ideas or data. Make adjustments as needed to keep it up-to-date and relevant.
Using bubble map templates in Miro not only helps organize and visualize information but also promotes collaboration and creativity within teams. By leveraging these templates, teams can thrive and achieve their goals more efficiently.