About the Bang for the Buck template
What is Bang for the Buck?
Bang for the Buck is a strategy for facilitating collaboration between the product manager and development teams. The goal is to prioritize backlog items. Rather than moving through your agenda without prioritizing what needs to get done, the Bang for the Buck model empowers you to identify the costs and benefits associated with various tasks. You can then assign scores to each task based on the “bang for your buck” you can expect to get from the task. With your scores in hand, you can then organize your tasks based on the order in which you can complete them. Finally, graph each task according to cost and value so you can start checking things off of your to-do list.
How does the Bang for the Buck work?
The Bang for the Buck model consists of a graph with the value of your items on the y-axis and the cost on the x-axis. Each axis is organized as a Fibonacci number. Write down the tasks on your backlog. With your teammates, discuss where each item belongs on the graph. The product manager’s job is to focus on the value of the task, while the development team should focus on the cost of the task. These various stakeholders allow you to get multiple perspectives on your tasks. When your graph is finished, you can follow your graphed items in a clockwise order to maximize efficiency.
How do you use the Bang for the Buck template?
Team members can create sticky notes to represent the tasks they have for an upcoming sprint. You can color-code the notes to make it easy to keep track of which tasks belong to which person. Invite your team members to collaborate on the board, using the @mention features and video chat to discuss items in more detail. Any changes made to the board will be visible in real-time.
Bang for Buck FAQs
Who should use the Bang for the Buck template?
Any team that follows the sprint workflow can use the Bang for the Buck template to prioritize tasks for an upcoming sprint. The team may work together to decide on the values for different tasks, with input from the product manager to ensure tasks are assigned the correct value.

Miro
Your virtual workspace for innovation
Miro is an innovation workspace designed for teams of every size, everywhere, to dream, design, and build the future together. Our mission? To empower these teams to create the next big thing, powered by AI at every step of the way. Over 90 million users around the world rely on Miro to untangle complex ideas, put customer needs first, and deliver products and services faster. All supported by best-in-class security, compliance, and scalability.
Categories
Similar templates
Blue Ocean 4 Actions Framework Template
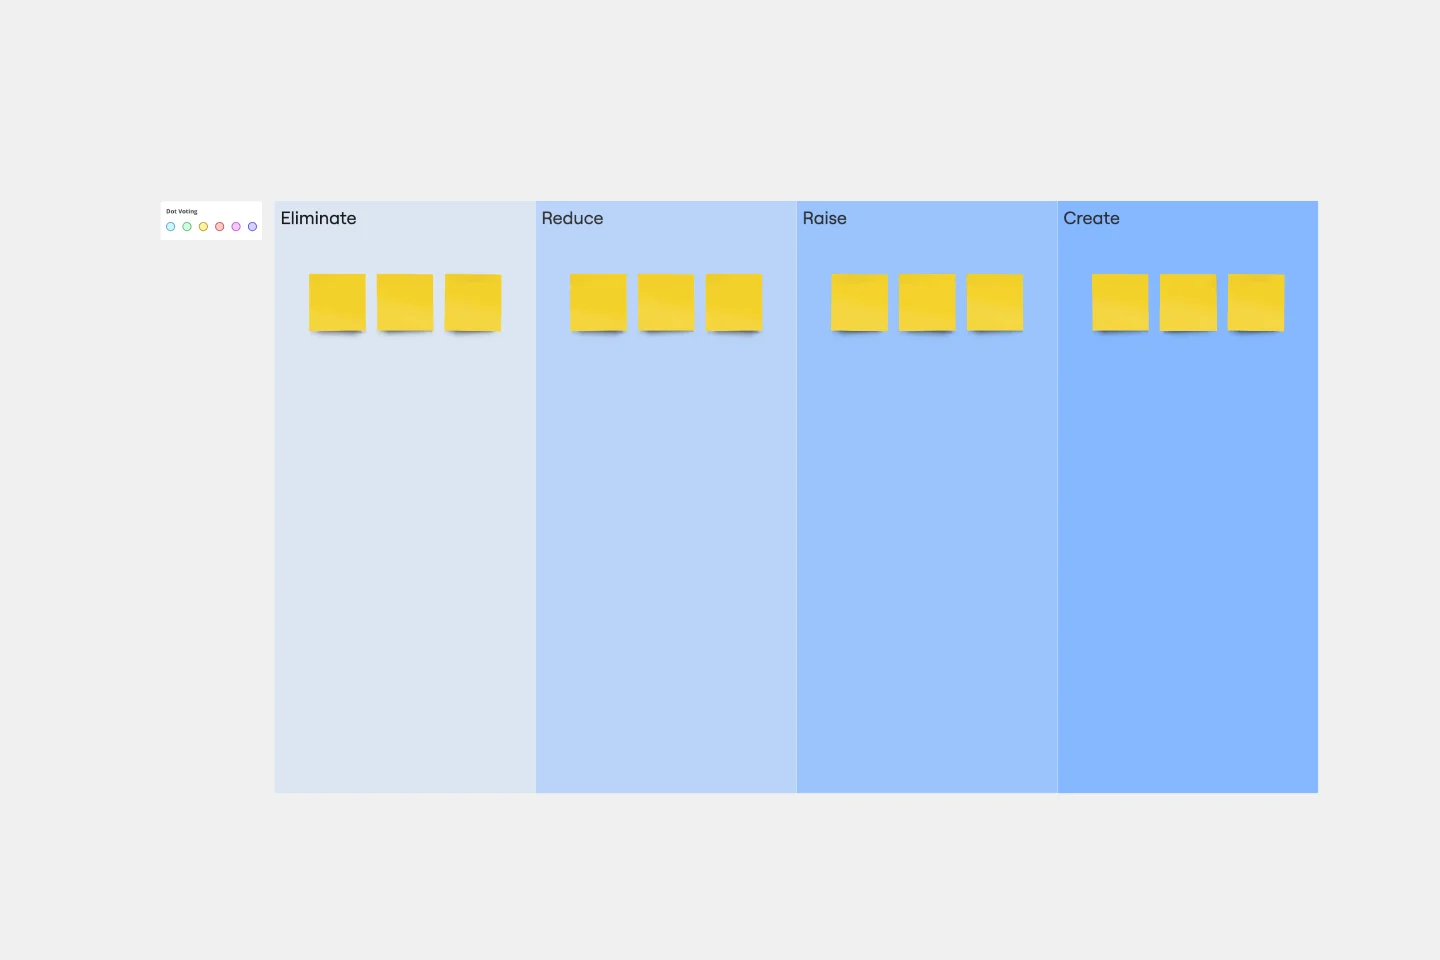
Blue Ocean 4 Actions Framework Template
For entrepreneurs, so much comes down to new users—how to attract them, impress them, and convert them to loyal customers. This template, designed by the authors of Blue Ocean Strategy: How to Create Uncontested Market Space and Make the Competition Irrelevant, will help you maximize value for you and your customers alike. Using the template’s four steps (divided into easy columns), you’ll easily evaluate your products in more innovative ways and make sure money is being spent in areas that really matter.
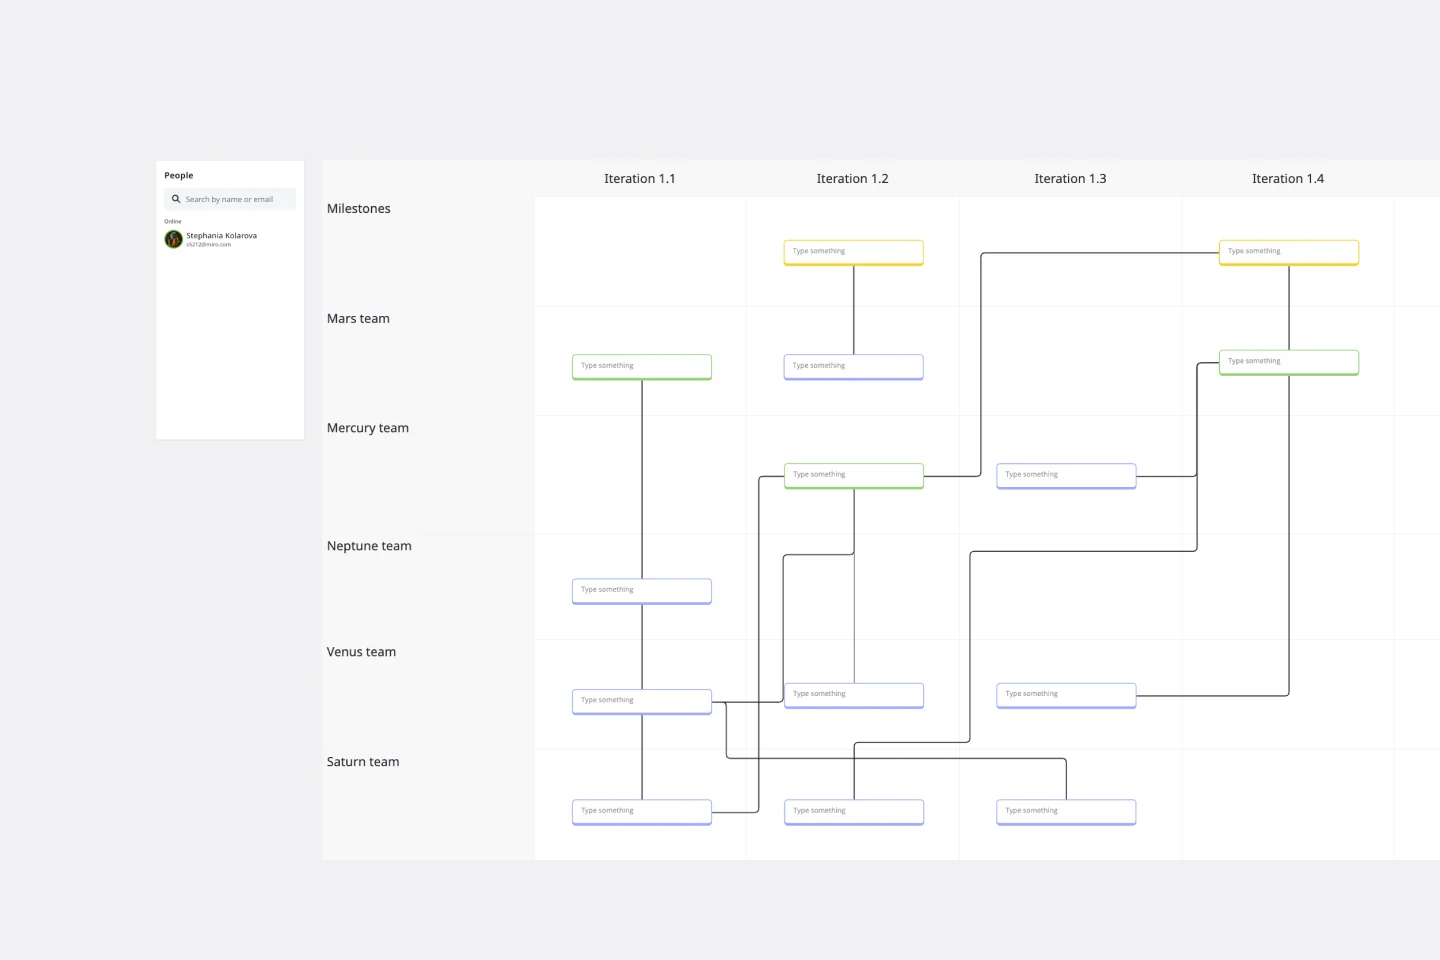
Agile Transformation Roadmap
Agile Transformation Roadmap
An Agile transformation roadmap can help you, your team, and your organization transition from rigid compliance-heavy methods to the more flexible Agile way of doing things incrementally. From requirements to integrations to security, you can map out your organization's moving parts as “swim lanes” that you can then update regularly. Use your roadmap as a way to tell the story of how you see your product growing over a period of time. Get buy-in without overselling and keep your roadmap simple, viable and measurable. By using an Agile transformation roadmap, you can avoid getting bogged down in details and instead invest in big-picture strategic thinking.
SAFe Program Board
SAFe Program Board
Many organizations use the Agile model, but even companies that don’t rigorously adhere to all Agile standards have adopted Agile tools and methods like Program Increment (PI) Planning. Even if you’re not participating in a formal PI session, a program board can be a great way to establish communication across teams and stakeholders, align development objectives with business goals, clarify dependencies, and foster cross-functional collaboration. The board provides much-needed structure to planning sessions, yet is adaptable enough to accommodate brainstorming and alignment meetings.
Sprint Review Template
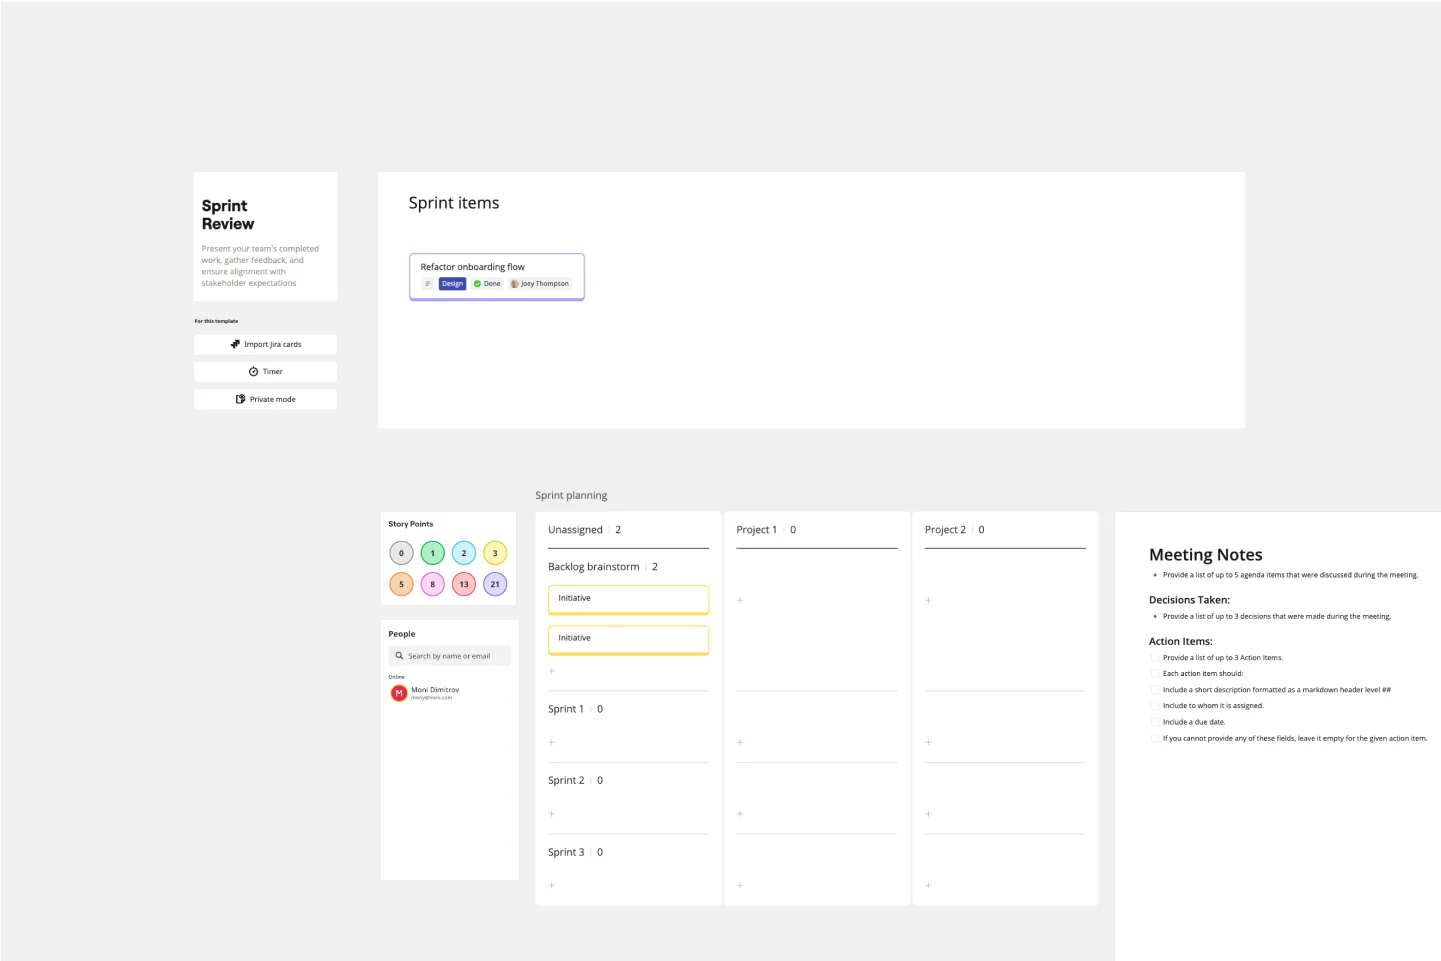
Sprint Review Template
The Sprint Review Template is a vital tool in Agile project management that enhances communication between team members and stakeholders by providing a clear format for presenting the sprint's accomplishments and challenges. It encourages active participation and feedback from all attendees, leading to more informed decision-making and continuous improvement. In essence, it's a catalyst for meaningful dialogue and collaborative growth.
Blue Ocean 4 Actions Framework Template
Blue Ocean 4 Actions Framework Template
For entrepreneurs, so much comes down to new users—how to attract them, impress them, and convert them to loyal customers. This template, designed by the authors of Blue Ocean Strategy: How to Create Uncontested Market Space and Make the Competition Irrelevant, will help you maximize value for you and your customers alike. Using the template’s four steps (divided into easy columns), you’ll easily evaluate your products in more innovative ways and make sure money is being spent in areas that really matter.
Agile Transformation Roadmap
Agile Transformation Roadmap
An Agile transformation roadmap can help you, your team, and your organization transition from rigid compliance-heavy methods to the more flexible Agile way of doing things incrementally. From requirements to integrations to security, you can map out your organization's moving parts as “swim lanes” that you can then update regularly. Use your roadmap as a way to tell the story of how you see your product growing over a period of time. Get buy-in without overselling and keep your roadmap simple, viable and measurable. By using an Agile transformation roadmap, you can avoid getting bogged down in details and instead invest in big-picture strategic thinking.
SAFe Program Board
SAFe Program Board
Many organizations use the Agile model, but even companies that don’t rigorously adhere to all Agile standards have adopted Agile tools and methods like Program Increment (PI) Planning. Even if you’re not participating in a formal PI session, a program board can be a great way to establish communication across teams and stakeholders, align development objectives with business goals, clarify dependencies, and foster cross-functional collaboration. The board provides much-needed structure to planning sessions, yet is adaptable enough to accommodate brainstorming and alignment meetings.
Sprint Review Template
Sprint Review Template
The Sprint Review Template is a vital tool in Agile project management that enhances communication between team members and stakeholders by providing a clear format for presenting the sprint's accomplishments and challenges. It encourages active participation and feedback from all attendees, leading to more informed decision-making and continuous improvement. In essence, it's a catalyst for meaningful dialogue and collaborative growth.