Azure Data Flow Template
Combine data and build and deploy custom machine learning models at scale.
Available on Enterprise, Business, Education plans.
About the Azure Data Flow Template
The Azure Data Flow Template will show you how to transform your data into actionable insights using the best-in-class machine learning tools. This architecture allows you to combine data and build and deploy custom machine learning models at scale.
Keep reading to learn more about the Azure Data Flow Template.
What is an Azure Data Flow Template
The Azure Data Flow Template visually shows the data flow to deploy and build custom machine learning models. The Azure Data Flow Template has unique icons categorized into Stencils. Each Stencil focuses on a specific task to make it easier for users to access the right set of icons.
When to use Azure Data Flow Template
You can use the Azure Data Flow Template to transform your data into actionable insights and better inform decision making. Collect data, analyze it, and use it to make decisions surrounding your architecture, from cost data, to performance, to user load, using data will guide you to make the right choices in your environment.
To build your Azure Data Flow Template, check out these best practices:
Do’s
Use the icon to illustrate how products can work together
In diagrams, we recommend to include the product name somewhere close to the icon
Use the icons as they would appear within Azure
Don’ts
Don’t crop, flip or rotate icons
Don’t distort or change icon shape in any way
Don’t use Microsoft product icons to represent your product or service.
How do I make an Azure Data Flow Template?
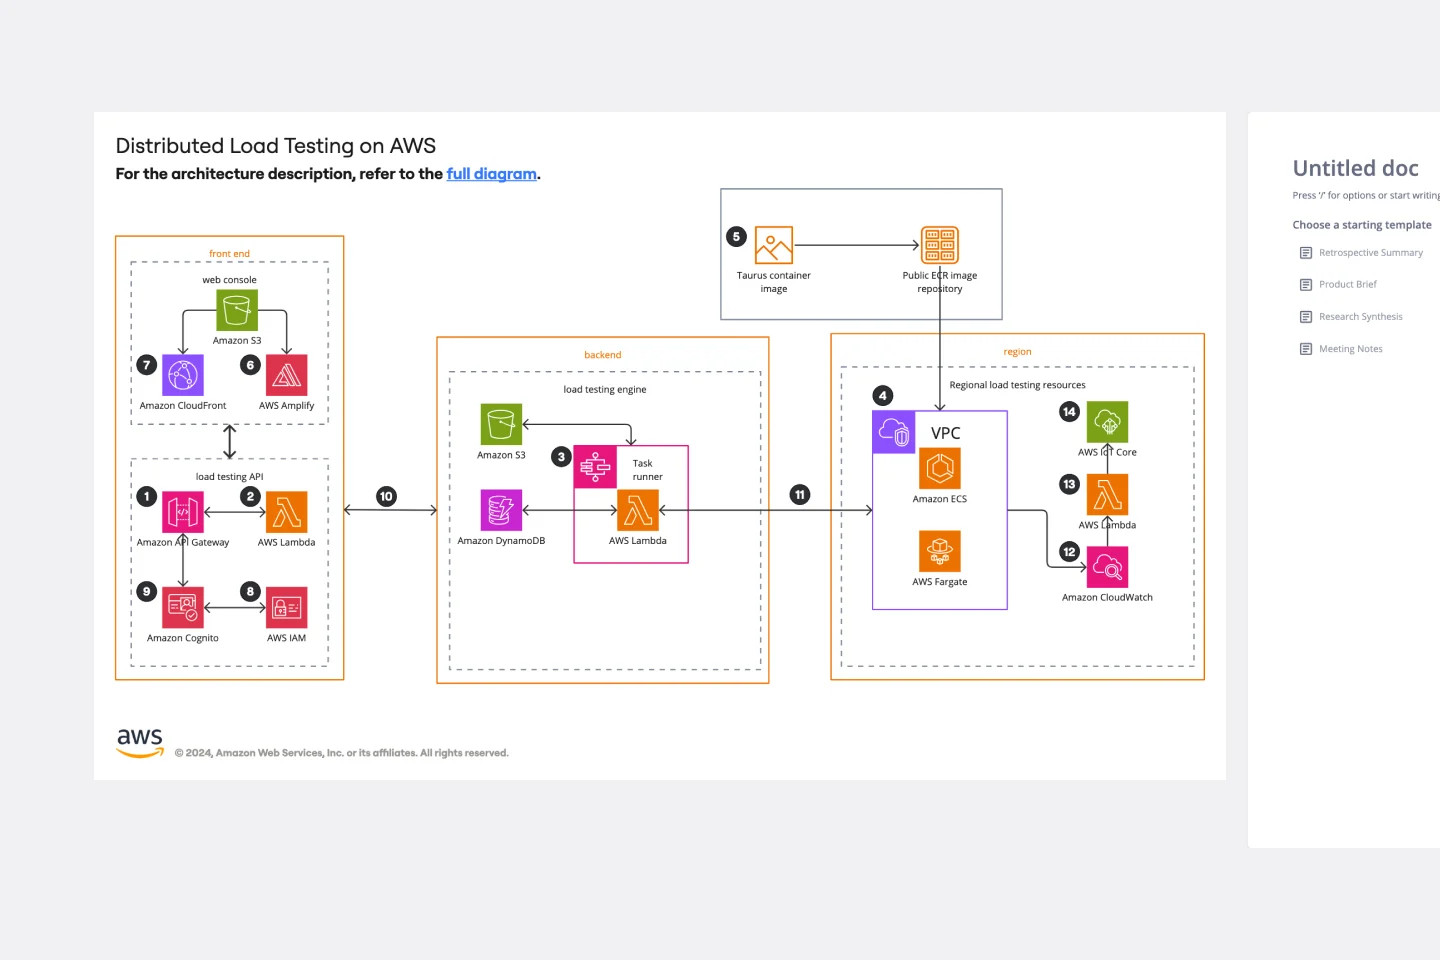
To make an Azure Data Flow in Miro is easy. You can use our Azure Data Flow Template and customize it as you see fit. Once you have the diagram structure, you can start adding the icons. You can find the icons under our Azure Icon Set integration.
Get started with this template right now. Available on Enterprise, Business, Education plans.
Timeline Template
Works best for:
Project Management, Flowcharts, Project Planning
A timeline displays a chronological order of important dates, and scheduled events. Timelines help product managers, project managers, and team members tell visual stories about progress and obstacles. Timelines enable teams to see at a glance what happened before, what progress is happening now, and what needs tackling in the future. Projects or products with specific purpose or deliverables should be based on a timeline to be successful. Use the timeline as a shared reference for start dates, end dates, and milestones.
Ansoff Matrix Template
Works best for:
Leadership, Operations, Strategic Planning
Keep growing. Keep scaling. Keep finding those new opportunities in new markets—and creative new ways to reach customers there. Sound like your approach? Then this template might be a great fit. An Ansoff Matrix (aka, a product or market expansion grid) is broken into four potential growth strategies: Market Penetration, Market Development, Product Development, and Diversification. When you go through each section with your team, you’ll get a clear view of your options going forward and the potential risks and rewards of each.
Kubernetes Architecture Diagram Template
Works best for:
Software Development, Diagrams
Use the Kubernetes Architecture Diagram template to manage your containerized applications better and bring your apps’ deployment, management, and scalability to the next level. This template helps you lower the downtime in production and allows you to have a more agile app production. Improve the deployment of your apps by visualizing every step of the process with the Kubernetes Architecture template. Try it out, and see if it works for you and your team.
Blue Ocean 4 Actions Framework Template
Works best for:
Leadership, Decision Making, Strategic Planning
For entrepreneurs, so much comes down to new users—how to attract them, impress them, and convert them to loyal customers. This template, designed by the authors of Blue Ocean Strategy: How to Create Uncontested Market Space and Make the Competition Irrelevant, will help you maximize value for you and your customers alike. Using the template’s four steps (divided into easy columns), you’ll easily evaluate your products in more innovative ways and make sure money is being spent in areas that really matter.
Company Organizational Chart
Works best for:
Org Charts, Operations, Mapping
An org chart is a visual guide that sums up a company’s structure at a glance—who reports to whom and who manages what teams. But it does more than just display the chain of command. It also showcases the structure of different departments and informs employees who to reach out to with issues and concerns. That makes it an especially valuable tool for new hires who are getting familiar with the company. Our templates make it easy for you to add your entire team and customize the chart with colors and shapes.
Floor Plan Template
Works best for:
Operations, Workshops
Maybe you’re planning a big occasion or event. Or maybe you’re arranging seating structures and traffic flows that are more permanent. Either way, creating a floor plan—an overhead scaled diagram of the space—is equal parts functional and fun. This template will let you visualize how people will move about the space and know quickly if the space will do what you need, before you commit time, money, or resources. And you’ll be able to get as detailed as you want—finding the right measurements and dimensions, and adding or removing appliances and furniture.