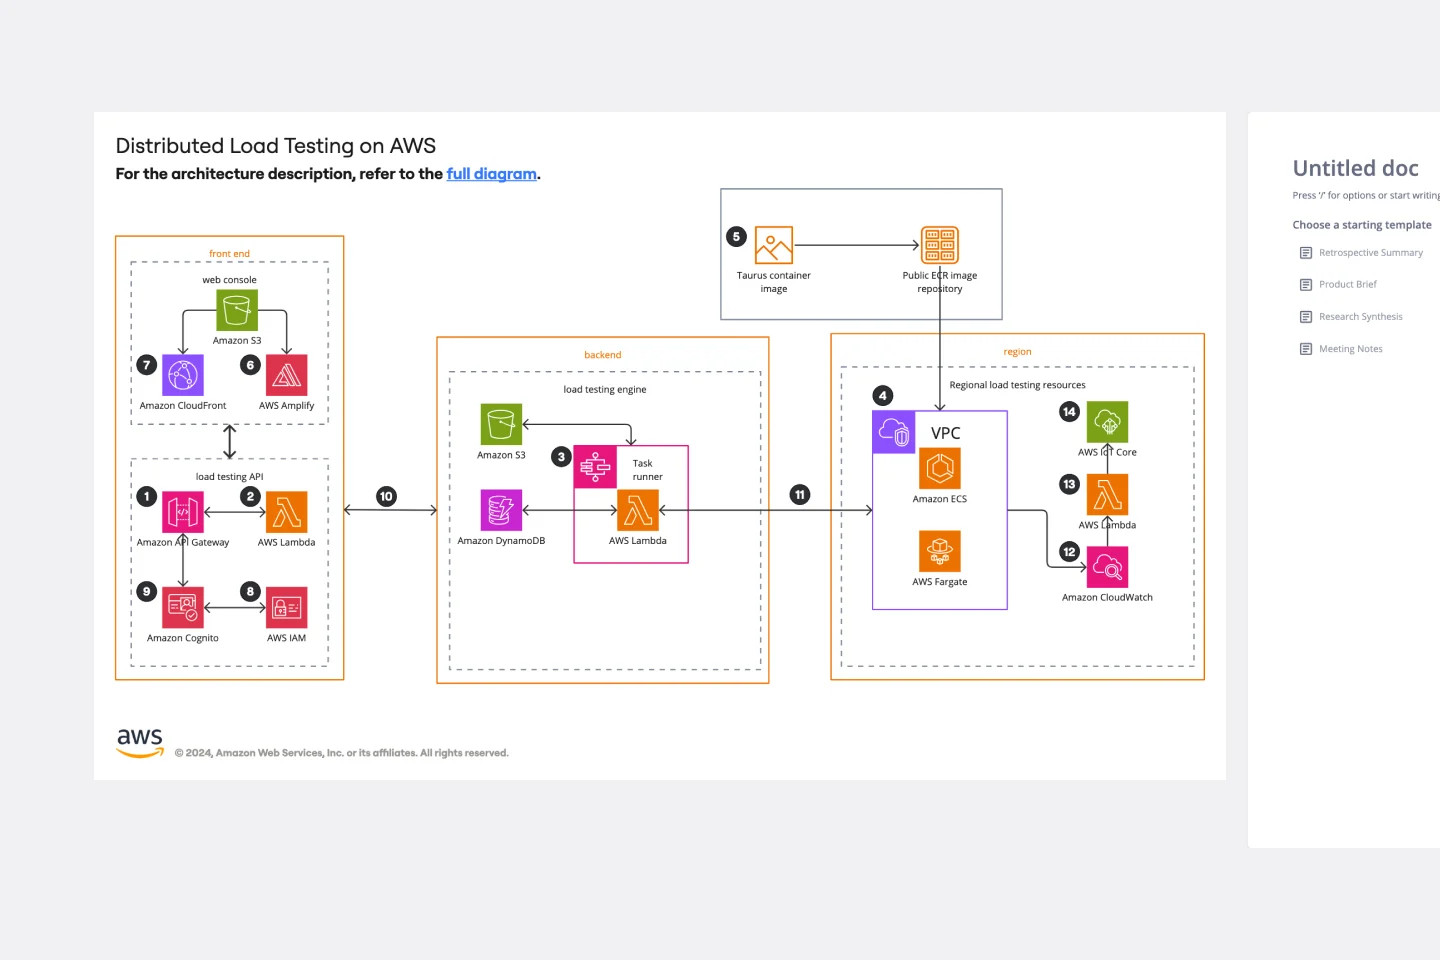
Serverless Image Handler on AWS Template
Handle image management and transformation in cloud-based projects, eliminating the need for server infrastructure management with the Serverless Image Handler on AWS Template.
Available on Enterprise, Business, Education plans.
About the Serverless Image Handler on AWS Template
The Serverless Image Handler on AWS template is designed to streamline managing and transforming images in the cloud without needing to manage server infrastructure. This solution leverages AWS services to automatically handle common image manipulation tasks, such as resizing, cropping, and formatting, making it an efficient tool for applications requiring dynamic image management.
How to use the Serverless Image Handler on AWS Template
Edit the template: Use Miro's intuitive drag-and-drop interface to customize the template according to your project's requirements. You can add or remove shapes, and use relevant AWS shape packs.
Analyze and collaborate: Collaborate with team members by sharing insights and making real-time updates to the template.
Iterate and optimize: Based on your analysis and team feedback, iterate on your data connections and analysis within the template. Miro's flexible nature allows for continuous optimization of your data analysis processes.
Why use the Serverless Image Handler on AWS Template
Using the Serverless Image Handler on AWS template in Miro could offer several benefits, such as:
Efficiency: Automating image manipulation tasks directly within project boards can streamline workflows, especially for teams dealing with dynamic content or digital assets.
Scalability: Leveraging AWS's serverless architecture can help teams scale their image-handling needs without worrying about infrastructure.
Integration: For teams utilizing AWS for their projects, this template can provide a seamless way to incorporate cloud-based image handling into their Miro boards.
Get started with this template right now. Available on Enterprise, Business, Education plans.
Pie Chart Template
Works best for:
Education, Operations
Pie charts are an excellent way to present relationships between datasets graphically, where you can quickly compare information and see contrast right away. Professionals from many fields use pie charts to support their presentations and enrich their storytelling as it’s one of the most commonly used data charts.
Data Flow Diagram Template
Works best for:
Flowcharts, Software Development, Diagrams
Any process can get pretty complex, especially when it has multiple components. Get a better grasp of your process through a data flow diagram (DFD). DFDs create a simple visual representation of all components in the flow of data and requirements in an entire system. They’re most often used by growth teams, data analysts, and product teams, and they’re created with one of three levels of complexity—0, 1, or 2. This template will help you easily build the best DFD for your process.
Causal Loop Diagram Template
Works best for:
Diagramming
The Causal Loop Diagram Template offers a structured framework to visualize the intricate interconnections within any system. Its standout benefit is the ability to provide a holistic perspective, ensuring that users don't just see isolated issues but understand the entire web of relationships, ultimately leading to more informed and strategic decision-making.
Service Blueprint by Edmond Gozo
Works best for:
Diagramming
The Service Blueprint template is a visual tool for designing and optimizing service experiences. It provides a structured framework for mapping customer journeys, identifying touchpoints, and aligning internal processes. This template enables teams to visualize the entire service ecosystem, uncover pain points, and innovate solutions to enhance customer satisfaction. By promoting customer-centricity and collaboration, the Service Blueprint empowers organizations to deliver exceptional service experiences and drive sustainable growth.
Product Development Process Flowchart Template
The Product Development Process Flowchart Template is a strategic tool designed to guide teams through the intricate journey of bringing a new product to market. This template serves as a visual roadmap, outlining each critical step in the product development lifecycle, from initial concept and design to testing, refinement, and eventual launch. It's structured to foster clarity, ensuring that all team members are aligned and aware of their roles and responsibilities at every phase.
Project Organizational Chart Template
Works best for:
Project Management, Documentation, Org Charts
When you’re embarking on a long, complex project, you will inevitably hit roadblocks and obstacles. It’s important to have your project organizational chart on hand to overcome those challenges. A project organizational chart is a visual diagram that illustrates who is on your team and the role they play in a given project. It documents the structure of the project organization, the hierarchy between team members, and the relationships between employees. Project organizational charts are useful tools for clarifying who does what, securing buy-in, and setting expectations for the group.