About the AWS Cloud Infrastructure Optimization Template
The AWS Cloud Infrastructure Optimization Template is part of Miro's Intelligent Templates collection, designed to streamline and enhance the management of your AWS cloud resources. This template leverages Miro's advanced diagramming tools and integrates seamlessly with AWS to provide real-time data visualization, cost analysis, and performance optimization. It is an invaluable resource for cloud architects, AWS practitioners, and DevOps engineers looking to optimize their cloud infrastructure efficiently.
How to use the AWS Cloud Infrastructure Optimization Template
Connect to AWS: Begin by linking your AWS account to Miro. This integration allows the template to fetch real-time data from your AWS environment.
Import data: Use the template to import your existing AWS infrastructure data. This can be done manually or automatically through the integration.
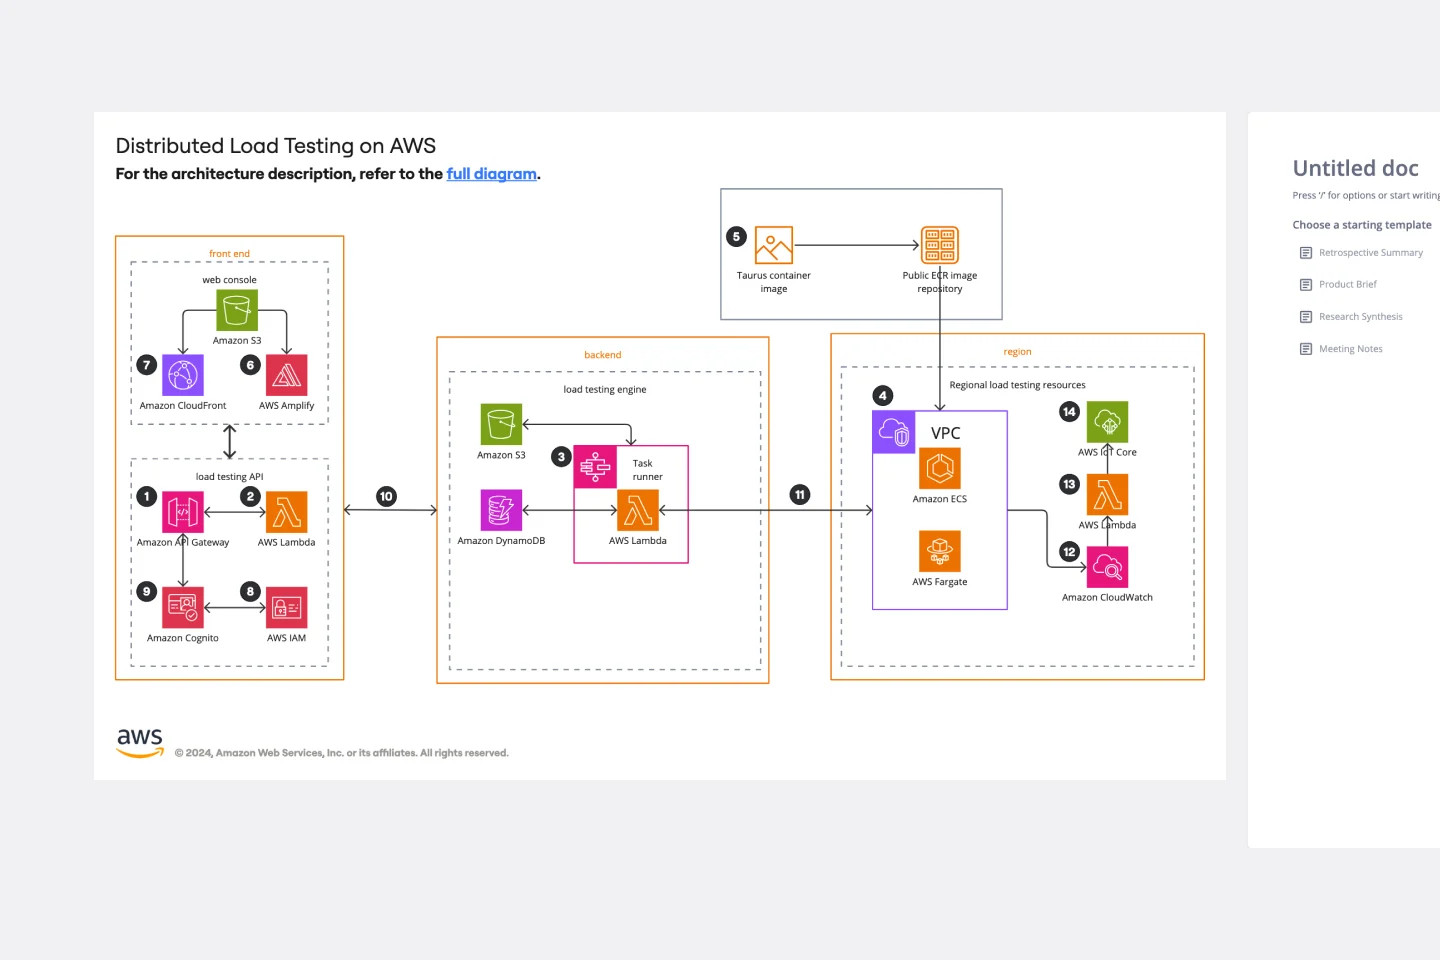
Visualize infrastructure: The template will auto-generate a detailed diagram of your current AWS setup, providing a clear visual representation of your architecture.
Optimize costs: Use the built-in AWS cost calculator to estimate and compare costs across different configurations. This feature supports a wide range of AWS services, ensuring comprehensive cost management.
Performance enhancements: Identify performance bottlenecks and optimize your infrastructure for better reliability and efficiency. The template offers insights and suggestions for performance improvements.
Collaborate and share: Use Miro's collaborative features to share the infrastructure diagrams with your team, gather feedback, and make informed decisions collectively.
Why use the AWS Cloud Infrastructure Optimization Template
Efficiency: Save time by automating the creation of infrastructure diagrams and cost calculations. The template reduces the manual effort required to visualize and optimize your AWS setup.
Cost management: With detailed cost analysis and comparison features, you can gain better control over your cloud spending and make more cost-effective decisions.
Performance optimization: Improve the performance and reliability of your cloud infrastructure by identifying and addressing potential issues.
Collaboration: Enhance team collaboration with Miro's interactive and real-time editing capabilities. Share insights and work together to optimize your cloud environment.
Comprehensive view: Get a holistic view of your AWS infrastructure, making it easier to manage and scale your cloud resources effectively.
The AWS Cloud Infrastructure Optimization Template, as part of Miro's Intelligent Templates, simplifies the complex task of managing cloud infrastructure, making it accessible and efficient for all users.

Miro
Your virtual workspace for innovation
Miro is an innovation workspace designed for teams of every size, everywhere, to dream, design, and build the future together. Our mission? To empower these teams to create the next big thing, powered by AI at every step of the way. Over 90 million users around the world rely on Miro to untangle complex ideas, put customer needs first, and deliver products and services faster. All supported by best-in-class security, compliance, and scalability.
Categories
Similar templates
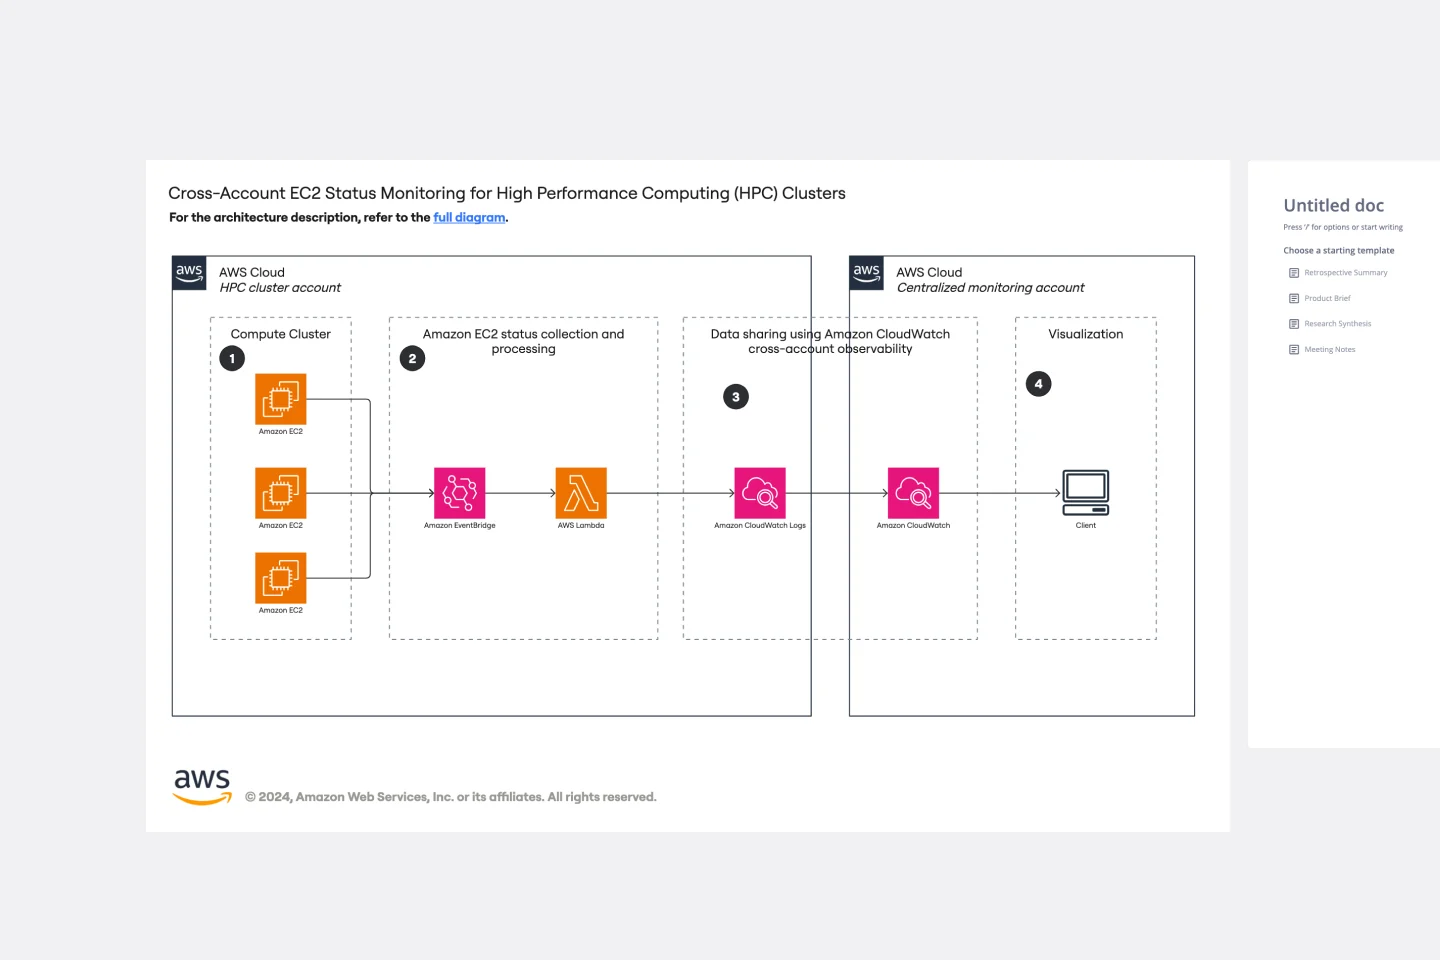
Cross-Account EC2 Status Monitoring for HPC Clusters Template
The Cross-Account EC2 Status Monitoring for HPC Clusters Template provides a centralized view of the health and performance of EC2 instances across multiple AWS accounts. It helps in early issue detection, reducing downtime and ensuring optimal efficiency of HPC clusters. The template offers customization options to meet specific HPC cluster configurations, simplifying monitoring and improving operational efficiency for administrators.
LUMINAI Refinery Advisor on AWS Template
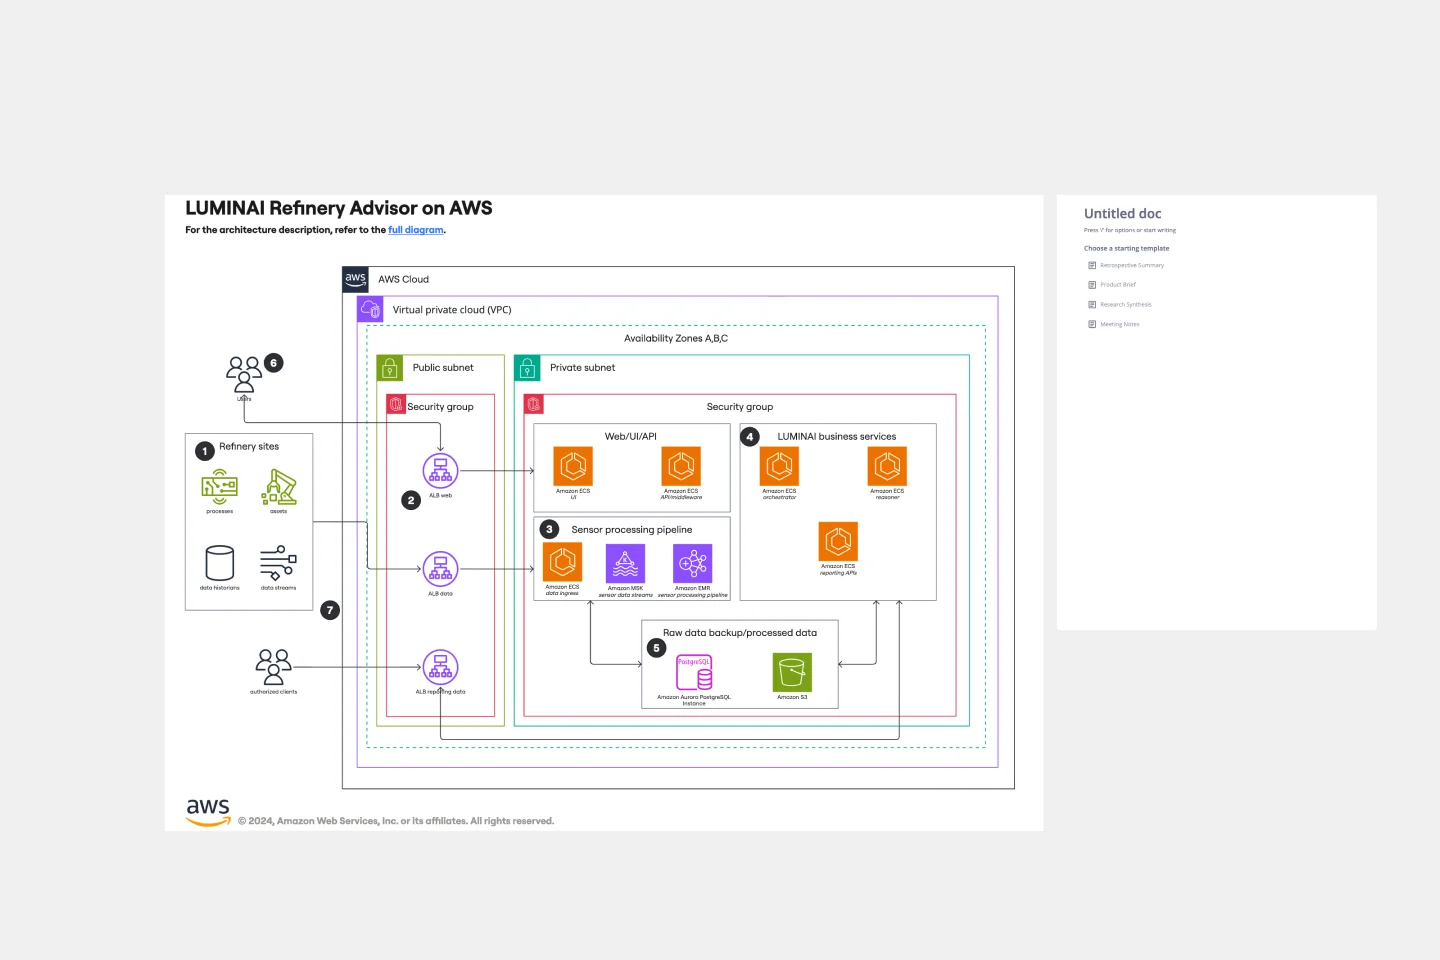
LUMINAI Refinery Advisor on AWS Template
The LUMINAI Refinery Advisor on AWS template streamlines and optimizes refinery operations through AWS. It provides a structured approach to setting up and managing AWS services, tailored specifically for engineers, developers, and data scientists in the refinery sector. This template not only saves time and effort by offering a predefined structure and best practices but also allows for customization to meet specific operational needs. With its focus on enhancing data processing capabilities, the LUMINAI Refinery Advisor on AWS template is an invaluable resource for improving the efficiency, effectiveness, and optimization of refinery processes on the AWS platform.
Datavant Switchboard with AWS Clean Rooms Template
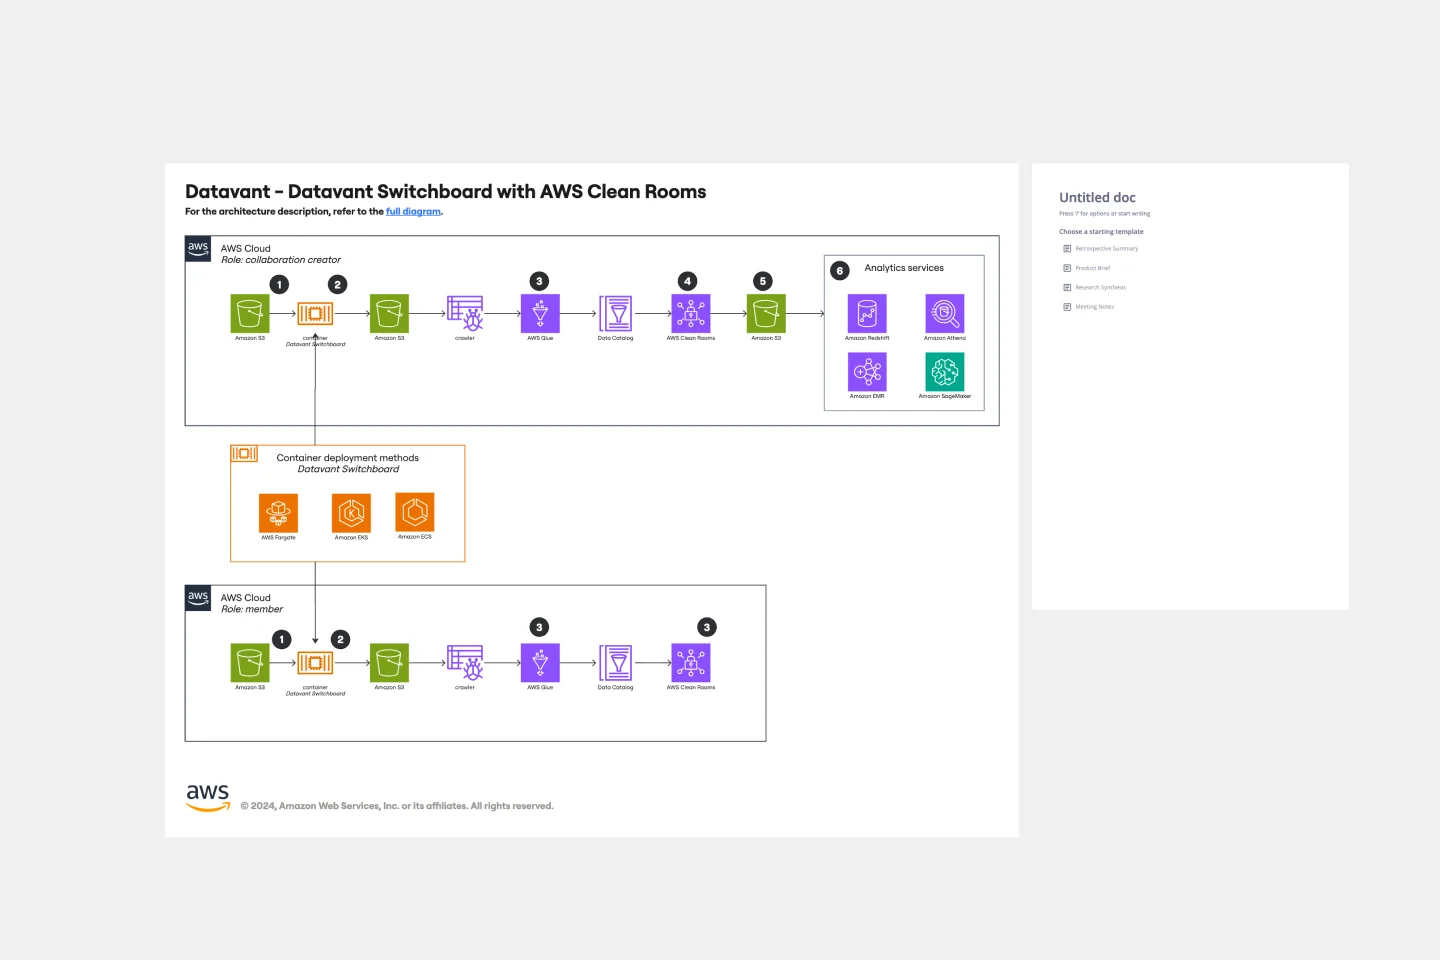
Datavant Switchboard with AWS Clean Rooms Template
The AWS Datavant Switchboard Clean Rooms Template integrates health data sources using Datavant's secure data connection capabilities and AWS Clean Rooms' scalable data processing environment. It's useful for professionals in engineering, database management, and development. The customizable Miro interface streamlines secure and efficient data handling and team collaboration for a wide range of projects.
Automated Security Response on AWS Template
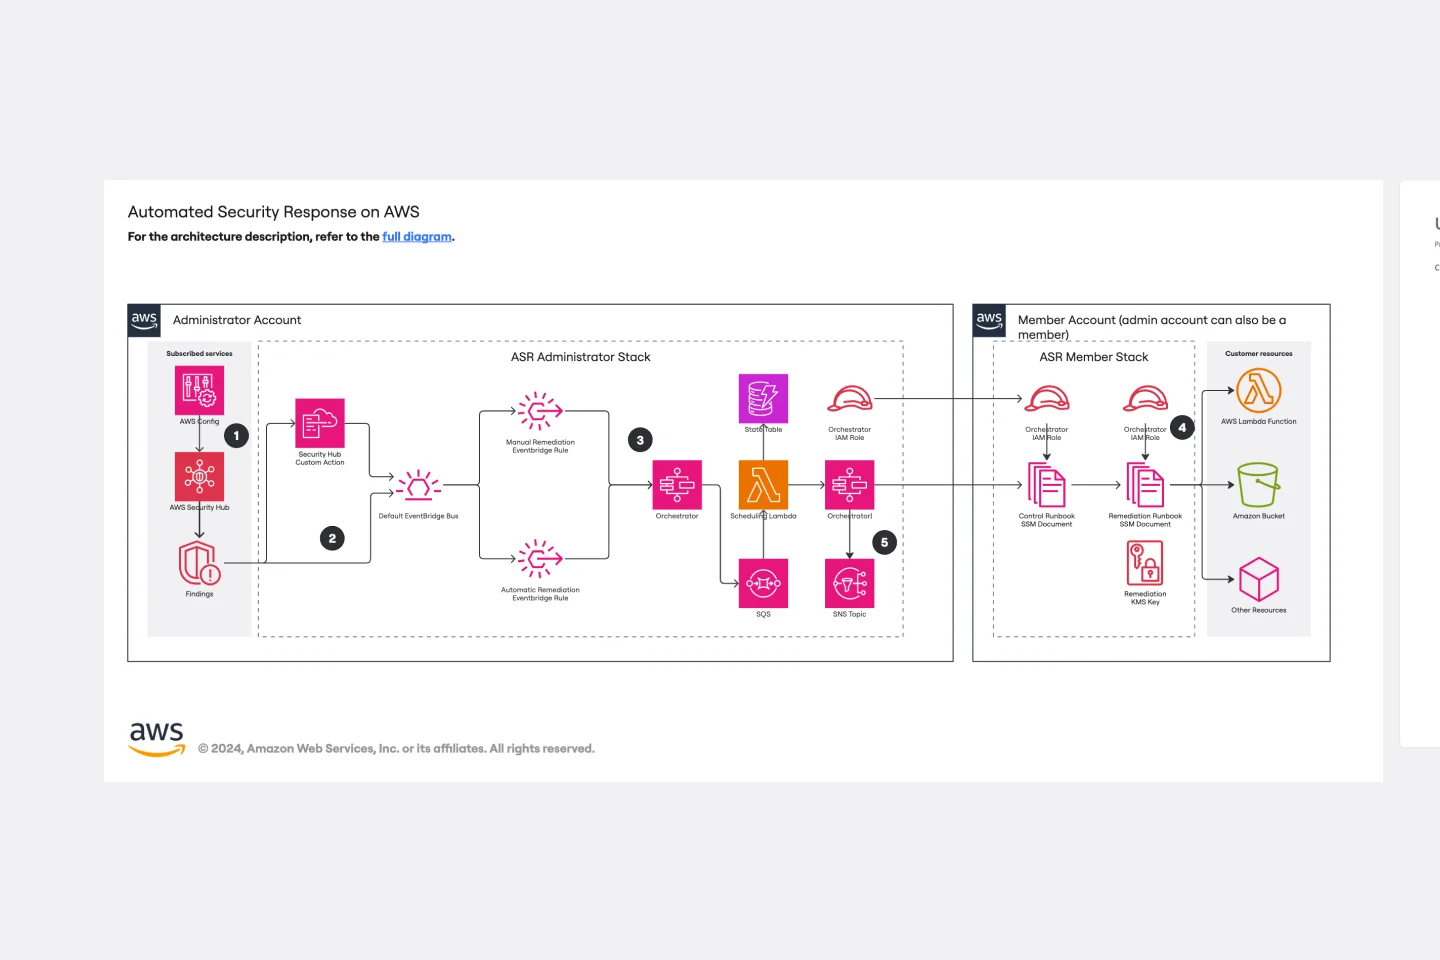
Automated Security Response on AWS Template
The Automated Security Response on AWS template is a tool for enhancing AWS security through automation, enabling quick identification and mitigation of threats with minimal manual effort. It integrates with AWS security services for a dynamic response mechanism, ensuring infrastructure security against evolving threats. This template streamlines operational efficiency, offers scalable and customizable security strategies, and accelerates threat response times, making it essential for improving AWS security posture.
Instance Scheduler on AWS Template
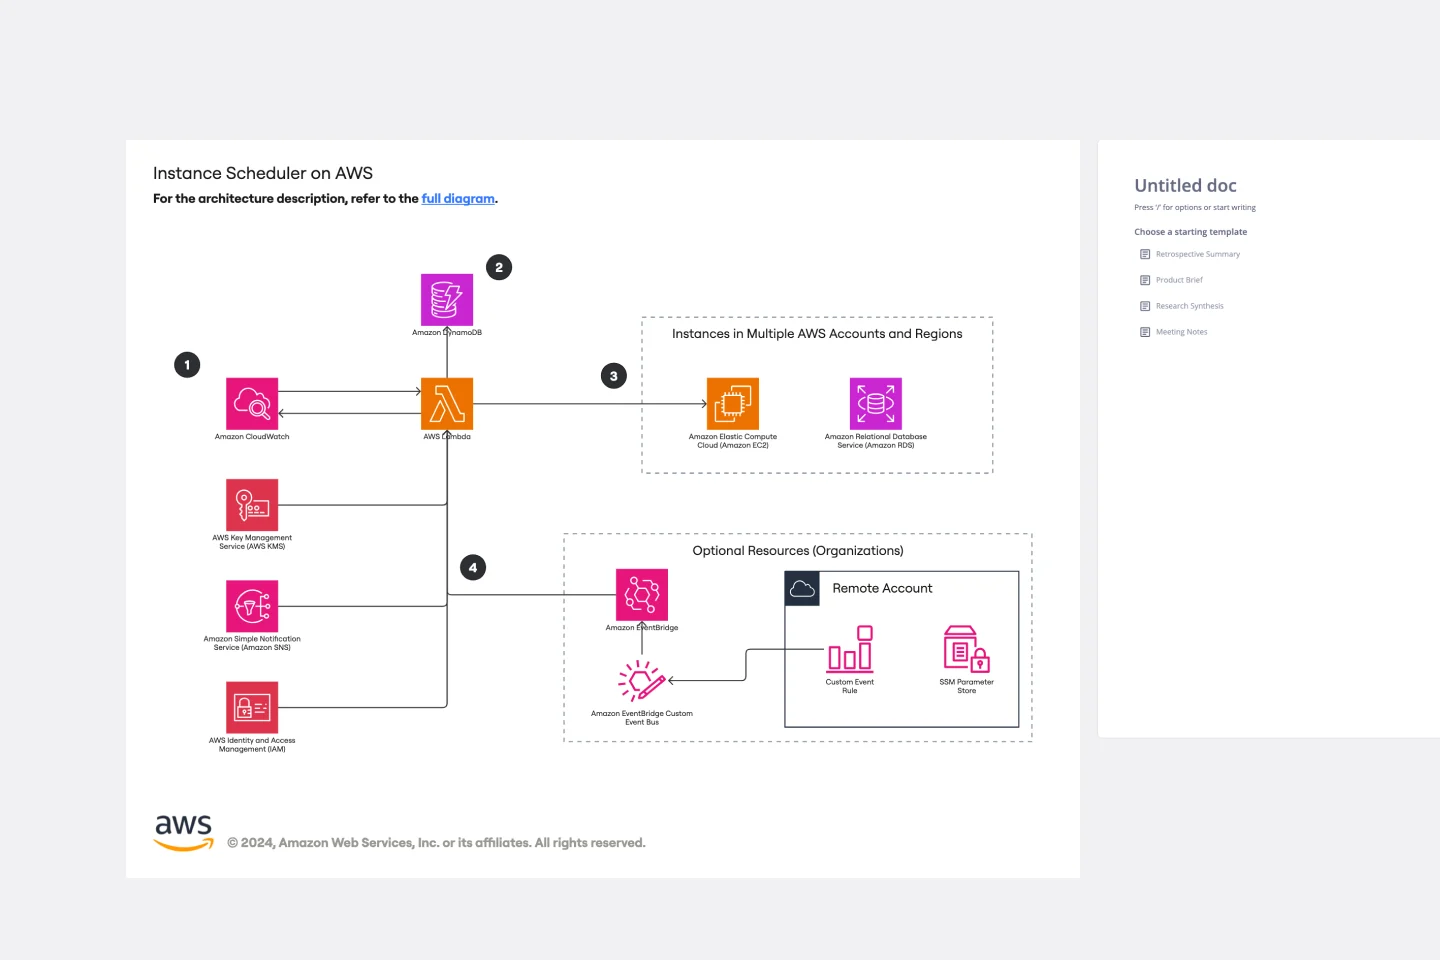
Instance Scheduler on AWS Template
The Instance Scheduler on AWS template is a strategic tool designed to enhance the efficiency and cost-effectiveness of managing AWS resources. It serves as a guide for automating the scheduling of Amazon EC2 and Amazon RDS instances, ensuring that these resources are operational only when necessary. This approach not only simplifies the management of instance schedules but also significantly reduces cloud computing costs by avoiding unnecessary runtime.
AWS Control Tower Account Governance Template
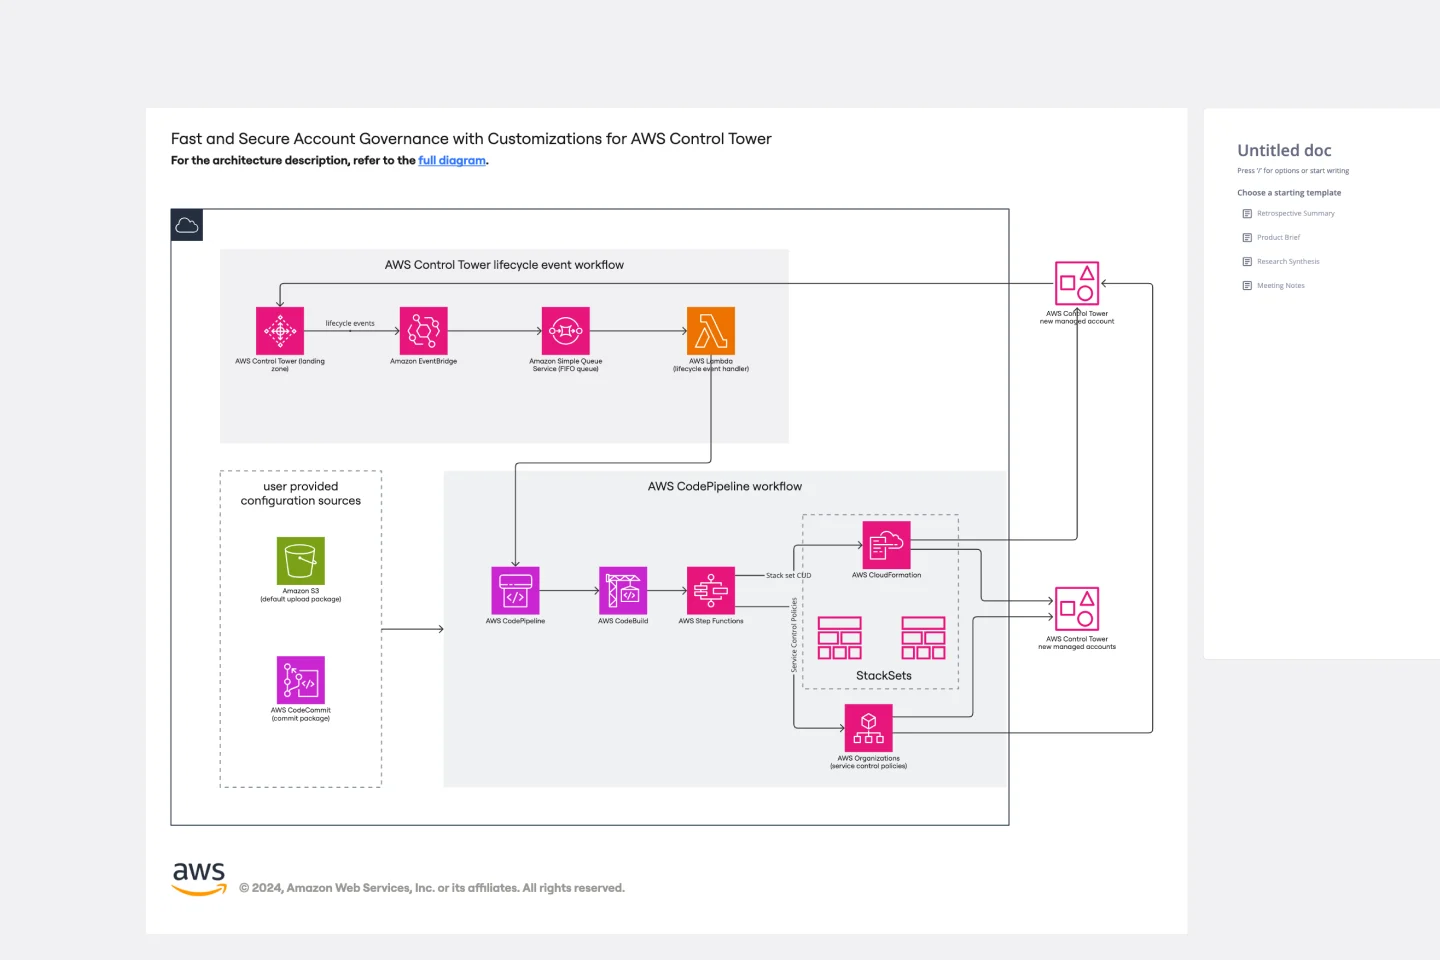
AWS Control Tower Account Governance Template
The AWS Control Tower Account Governance Template streamlines the setup and management of governance across multiple AWS accounts. It leverages AWS Control Tower to automate and simplify the governance process, ensuring that your AWS environment adheres to best practices for security, operations, and compliance. This template is highly customizable, allowing you to adjust governance controls and policies to meet the unique requirements of your organization. It provides a centralized view of your AWS environment, enhancing visibility and control, and scales with your organization as it grows.
Serverless Image Handler on AWS Template
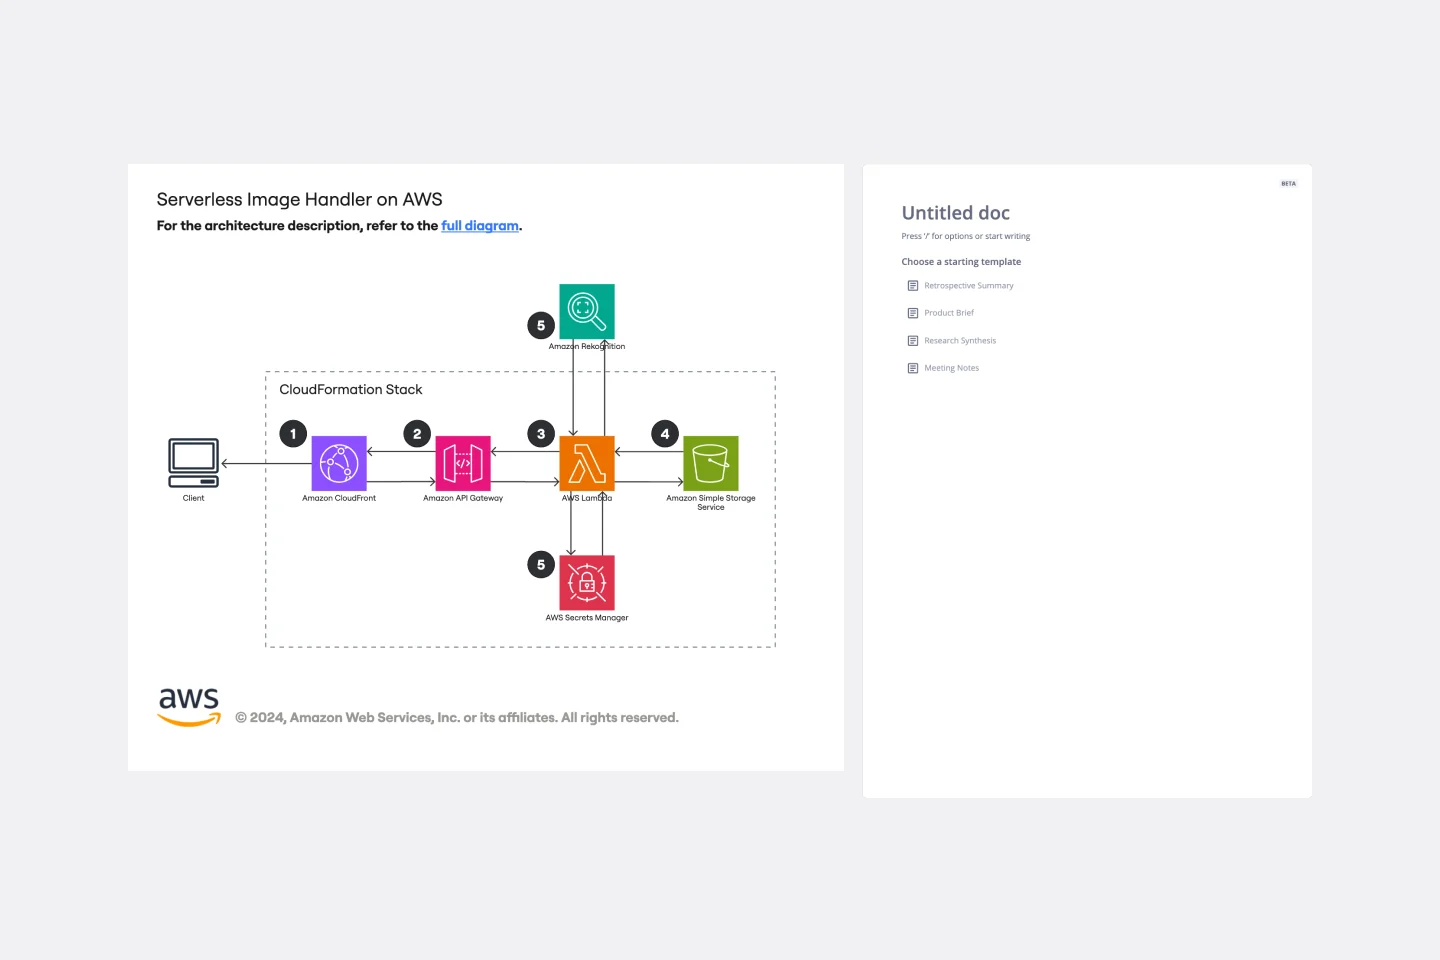
Serverless Image Handler on AWS Template
The Serverless Image Handler on AWS template is designed to facilitate the management and transformation of images in cloud-based projects without the need for server infrastructure management. It is particularly useful for applications and projects that require dynamic image management, offering benefits like efficiency, scalability, and seamless integration with AWS services. By incorporating this template into Miro boards or projects, teams can streamline their workflows, especially when dealing with digital assets or dynamic content, ensuring that their image-handling needs are met efficiently as they scale.
Security Automations for AWS WAF Template
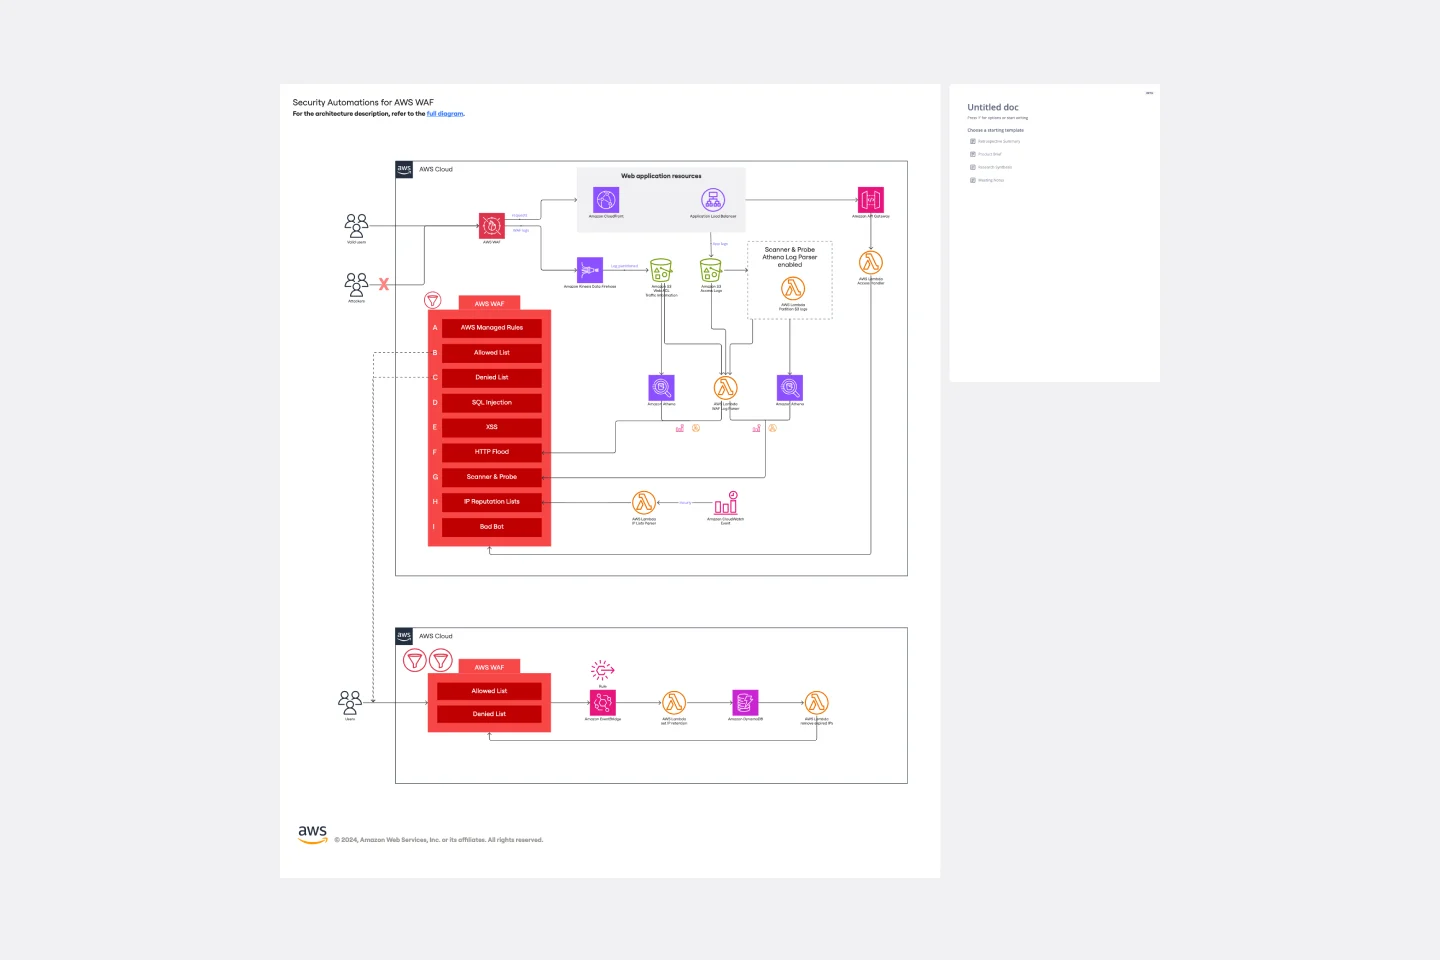
Security Automations for AWS WAF Template
The Security Automations for AWS WAF template is designed to streamline the process of enhancing the security of your AWS applications. It allows teams to collaboratively design, visualize, and refine AWS WAF configurations to protect against common web exploits effectively. This template includes various components such as automated deployment pipelines, instance schedulers, and serverless image handlers, providing a robust framework for managing AWS WAF security automations. By using this template, teams can improve collaboration, achieve a clear visual representation of their AWS WAF configurations, enhance efficiency in managing AWS WAF rules, and customize the template to meet specific application security needs.
AWS Architecture Diagram Template
AWS Architecture Diagram Template
The AWS Architecture Diagram is a visual representation of the AWS framework, and it also translates the best practices when using Amazon Web Services architecture. You can now have an overview of your AWS architecture with Miro’s AWS Architecture Diagram Template, track your cloud solutions easily, and optimize processes like never before.
Cross-Account EC2 Status Monitoring for HPC Clusters Template
The Cross-Account EC2 Status Monitoring for HPC Clusters Template provides a centralized view of the health and performance of EC2 instances across multiple AWS accounts. It helps in early issue detection, reducing downtime and ensuring optimal efficiency of HPC clusters. The template offers customization options to meet specific HPC cluster configurations, simplifying monitoring and improving operational efficiency for administrators.
LUMINAI Refinery Advisor on AWS Template
LUMINAI Refinery Advisor on AWS Template
The LUMINAI Refinery Advisor on AWS template streamlines and optimizes refinery operations through AWS. It provides a structured approach to setting up and managing AWS services, tailored specifically for engineers, developers, and data scientists in the refinery sector. This template not only saves time and effort by offering a predefined structure and best practices but also allows for customization to meet specific operational needs. With its focus on enhancing data processing capabilities, the LUMINAI Refinery Advisor on AWS template is an invaluable resource for improving the efficiency, effectiveness, and optimization of refinery processes on the AWS platform.
Datavant Switchboard with AWS Clean Rooms Template
Datavant Switchboard with AWS Clean Rooms Template
The AWS Datavant Switchboard Clean Rooms Template integrates health data sources using Datavant's secure data connection capabilities and AWS Clean Rooms' scalable data processing environment. It's useful for professionals in engineering, database management, and development. The customizable Miro interface streamlines secure and efficient data handling and team collaboration for a wide range of projects.
Automated Security Response on AWS Template
Automated Security Response on AWS Template
The Automated Security Response on AWS template is a tool for enhancing AWS security through automation, enabling quick identification and mitigation of threats with minimal manual effort. It integrates with AWS security services for a dynamic response mechanism, ensuring infrastructure security against evolving threats. This template streamlines operational efficiency, offers scalable and customizable security strategies, and accelerates threat response times, making it essential for improving AWS security posture.
Instance Scheduler on AWS Template
Instance Scheduler on AWS Template
The Instance Scheduler on AWS template is a strategic tool designed to enhance the efficiency and cost-effectiveness of managing AWS resources. It serves as a guide for automating the scheduling of Amazon EC2 and Amazon RDS instances, ensuring that these resources are operational only when necessary. This approach not only simplifies the management of instance schedules but also significantly reduces cloud computing costs by avoiding unnecessary runtime.
AWS Control Tower Account Governance Template
AWS Control Tower Account Governance Template
The AWS Control Tower Account Governance Template streamlines the setup and management of governance across multiple AWS accounts. It leverages AWS Control Tower to automate and simplify the governance process, ensuring that your AWS environment adheres to best practices for security, operations, and compliance. This template is highly customizable, allowing you to adjust governance controls and policies to meet the unique requirements of your organization. It provides a centralized view of your AWS environment, enhancing visibility and control, and scales with your organization as it grows.
Serverless Image Handler on AWS Template
Serverless Image Handler on AWS Template
The Serverless Image Handler on AWS template is designed to facilitate the management and transformation of images in cloud-based projects without the need for server infrastructure management. It is particularly useful for applications and projects that require dynamic image management, offering benefits like efficiency, scalability, and seamless integration with AWS services. By incorporating this template into Miro boards or projects, teams can streamline their workflows, especially when dealing with digital assets or dynamic content, ensuring that their image-handling needs are met efficiently as they scale.
Security Automations for AWS WAF Template
Security Automations for AWS WAF Template
The Security Automations for AWS WAF template is designed to streamline the process of enhancing the security of your AWS applications. It allows teams to collaboratively design, visualize, and refine AWS WAF configurations to protect against common web exploits effectively. This template includes various components such as automated deployment pipelines, instance schedulers, and serverless image handlers, providing a robust framework for managing AWS WAF security automations. By using this template, teams can improve collaboration, achieve a clear visual representation of their AWS WAF configurations, enhance efficiency in managing AWS WAF rules, and customize the template to meet specific application security needs.
AWS Architecture Diagram Template
AWS Architecture Diagram Template
The AWS Architecture Diagram is a visual representation of the AWS framework, and it also translates the best practices when using Amazon Web Services architecture. You can now have an overview of your AWS architecture with Miro’s AWS Architecture Diagram Template, track your cloud solutions easily, and optimize processes like never before.