About the 3x3 Prioritization Method Template
The 3x3 Prioritization Method Template, or action priority matrix, helps teams prioritize features and initiatives based on their user impact and the level of effort needed for success. It offers a new level of detail that the 2x2 Prioritization Matrix (or Lean Prioritization Method) may lack.
With nine “buckets” or areas of interest, your team can quickly decide if an idea or feature is low, medium, or high effort. The team can also accordingly decide if the idea or feature will likely have low, medium, or high impact.
As a visual tool, 3x3 prioritization helps teams promptly reach an agreement on quick wins, big projects, filler tasks, or anything that could waste time.
What is the 3x3 prioritization method?
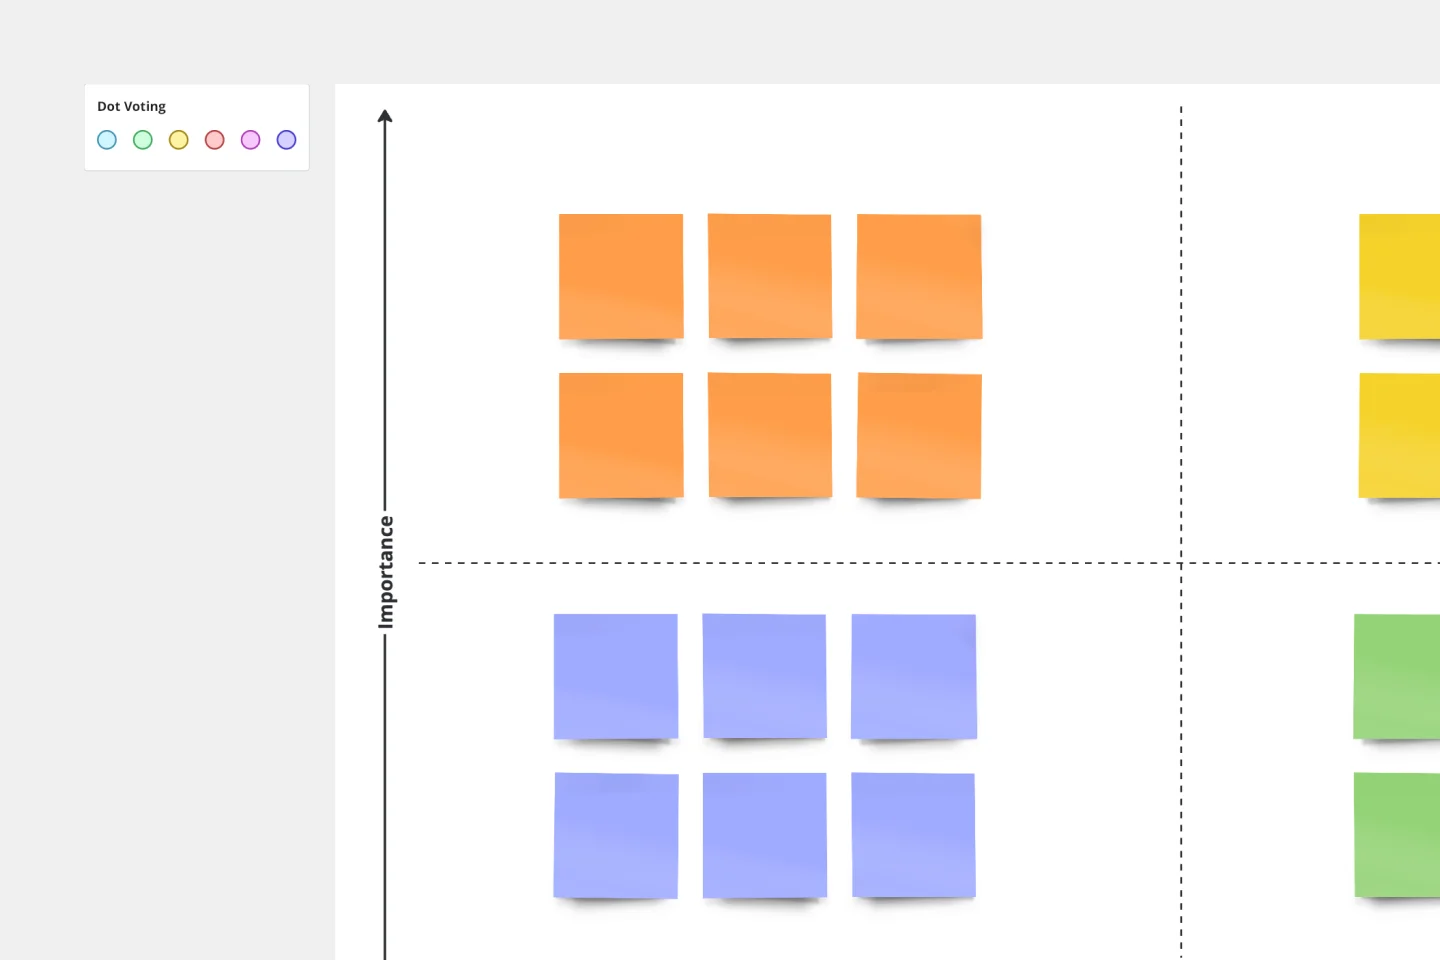
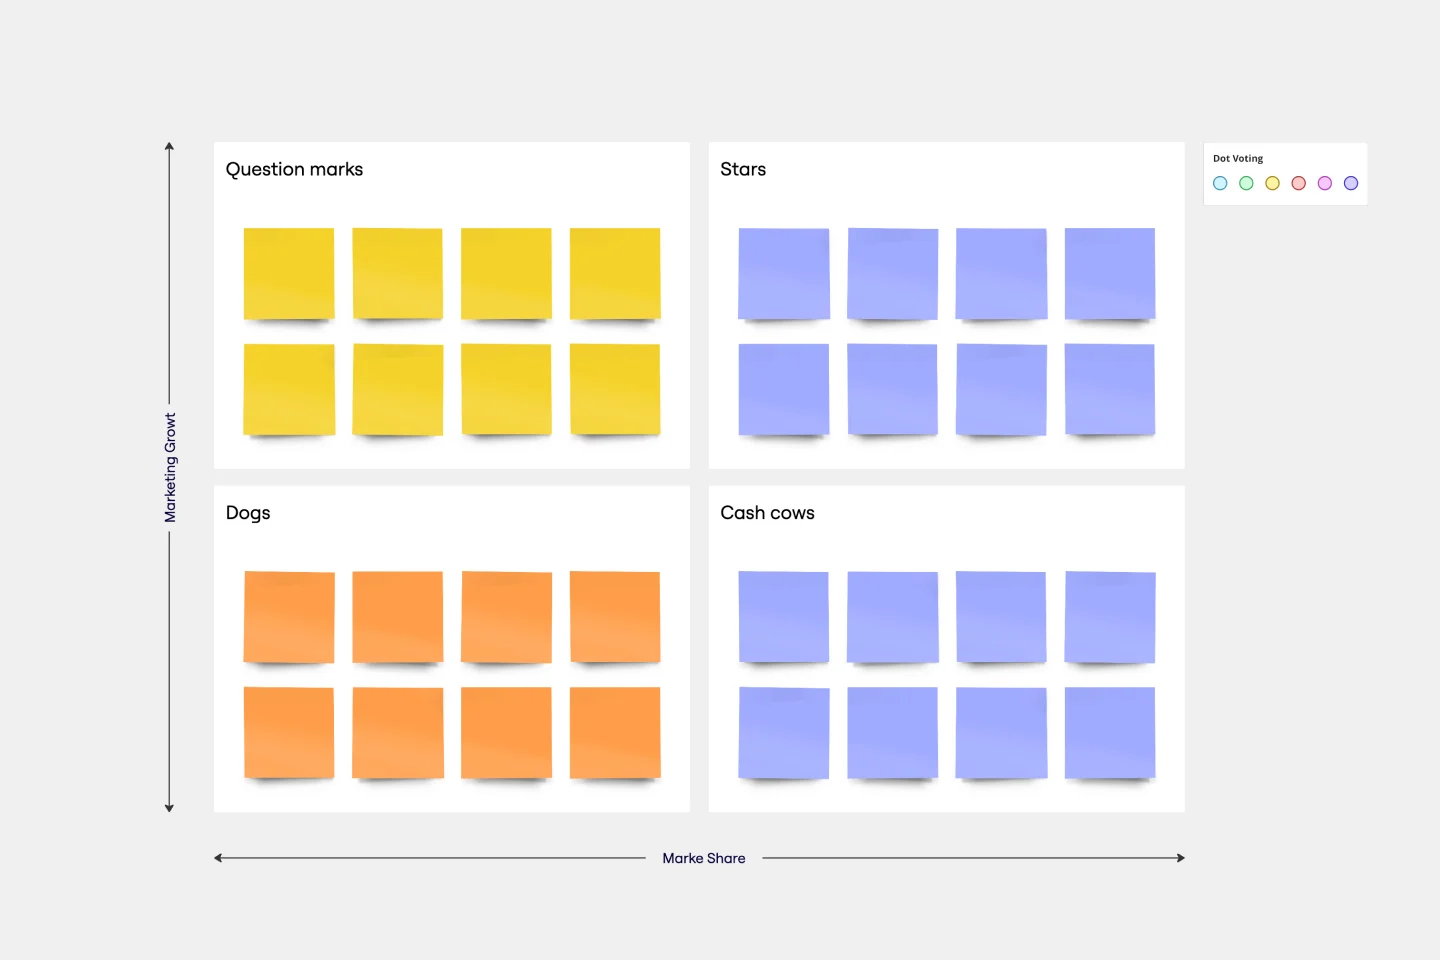
The 3x3 prioritization method is a visual representation of where teams should allocate their time and resources. There are typically 4 quadrants in a 3x3 prioritization method matrix:
Quick wins: actions fundamental to team success that lead to the best return on effort and should be prioritized before anything else.
Major projects: complex actions with long-term return on effort, best if selectively chosen and efficiently executed.
Filler activities: everyday tasks that can easily be deprioritized.
Time sucks: activities too time-consuming that can be delegated or avoided.
This matrix is adaptable for use during daily team stand-ups, or for strategic action plans or Agile sprint planning.
When to use the 3x3 prioritization method
This prioritization approach can help product managers and cross-functional teams:
Quickly determine what activities or ideas to focus on
Make the most of limited resources
Reflect on strategies and goals without wasting time or effort
Align priorities and sync up on solutions to any problems discussed
The framework can be started by a team lead, who then invites other team members to offer feedback and add ideas to the four quadrants as needed.
Create your own 3x3 prioritization matrix
Making your own 3x3 prioritization matrix is easy. Miro’s is the perfect tool to create and share it. Get started by selecting the 3x3 Prioritization Method Template, then take the following steps to make one of your own.
Decide on a clear objective for your impact effort analysis. Ask your team whether that objective should be strategic, tactical, project-related, product- or service-related, or personal (in terms of development or team growth). Have a clear scope or time frame in mind, too – are you planning for days, weeks, months, or over a year?
Brainstorm what you need to achieve those objectives. Examples of needs driven by this framework can include prioritizing actions from a planning session, developing priorities for a project team, establishing milestones for an employee’s performance plan, or prioritizing features to focus on from a product backlog.
Collect and refine your team ideas. Everyone can draft their ideas or contributions on sticky notes. Then, refine them with a live call or video chat feedback as needed.
Position your ideas according to impact and effort. Encourage everyone to assess where their idea fits on the quadrant, and move it accordingly: is it a quick win, major project, filler idea, or time suck?
Create an action plan with the next steps. Do specific team members need to test an idea’s validity? Schedule a follow-up meeting? Clarify impact and effort? Remember, value can be defined as qualitative (low to high) or quantitative (by a numbered scale, currency, time spent, or volume of output).
Share the outcome with anyone who couldn’t attend the session. Invite team members, clients, or stakeholders through Slack, email, or a public or private hyperlink as needed so that everyone can catch up on the details.