Dashboard Wireframes
Click arrow to add template to existing board
—
—
Diagrams and graphs for dashboard wireframing
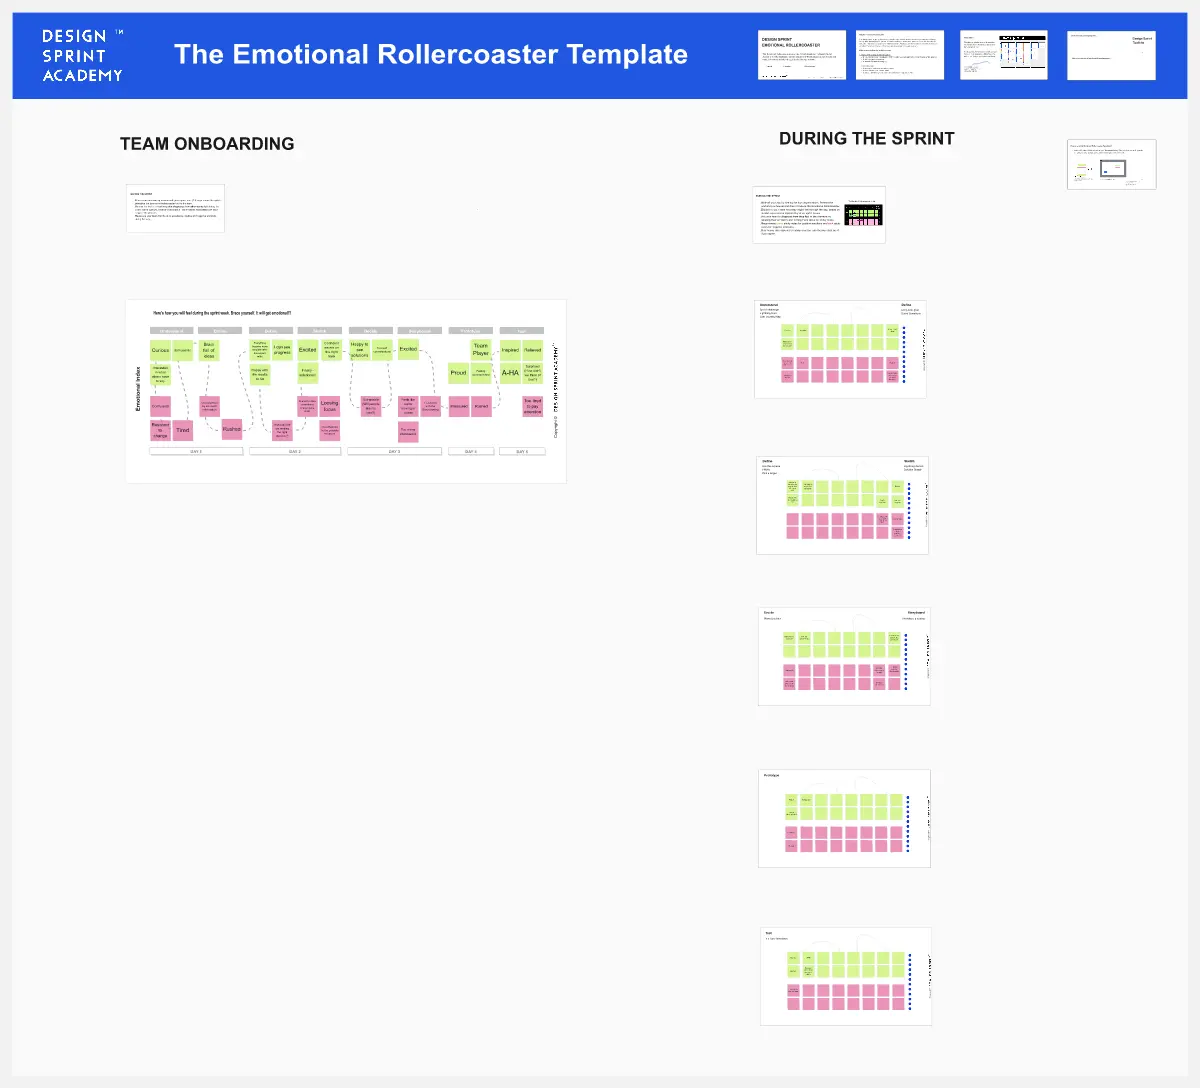
This template offers a comprehensive collection of diagrams, charts, and graphs to facilitate your dashboard design. Utilize various visualization elements to effectively represent data relationships and trends. Whether you're sketching out a business dashboard or an analytics interface, this template provides a solid foundation for communicating your design ideas.
Enhance your wireframing process and collaborate seamlessly by leveraging this resourceful template inspired by proven visual techniques.
Categories

Vitaliy Trenkenshu
CEO@redflags.ai
Author of the Enterprise Data Monetization Framework, implemented in the award-winning redflags.ai platform.
The largest data monetization project (anti-fraud data analysis for the Government) has generated more than $600 million in value.
Also: Qlik Partner Ambassador 2024, Enterprise Big Data Framework Ambassador, 2024 Artificial Intelligence Excellence Awards winner, 3xIRONMAN
Share your comment with the Miroverse community.