Online graphic organizer maker for visualizing concepts

Create a graphic organizer and transform ideas into visual concepts. Miro’s workspace helps you present your ideas with clarity and move projects forward.
accenture.svgbumble.svgdelloite.svgdocusign.svgcontentful.svgasos.svgpepsico.svghanes.svghewlett packard.svgdropbox.svgmacys.svgliberty mutual.svgtotal.svgwhirlpool.svgubisoft.svgwalt disney.svgyamaha.svgwp engine.svg

Quickly visualize ideas with an online graphic organizer

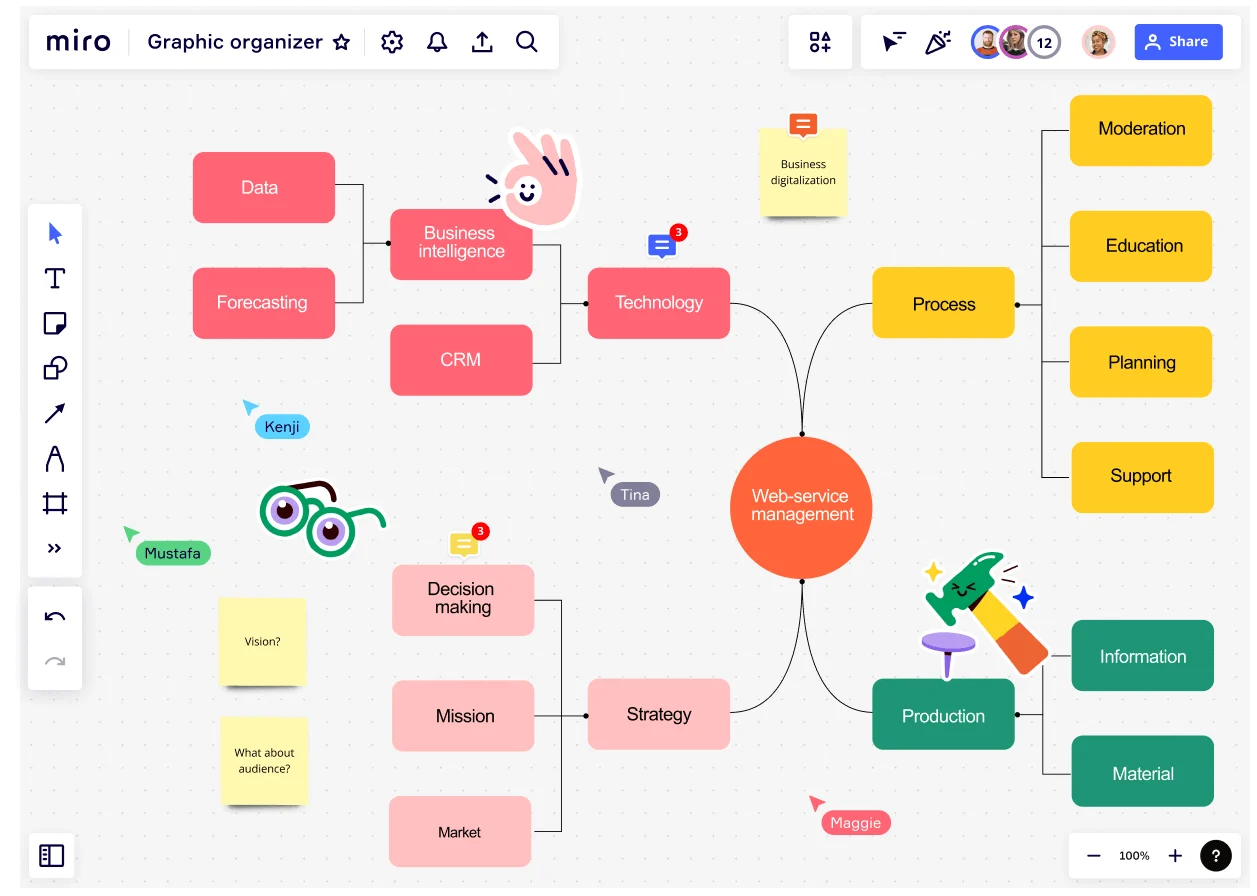
Use Miro’s graphic organizer maker to master visual storytelling. From strategists to business analysts to educators and teachers, get your point across with an online graphic organizer that helps you to connect and bring solutions.

An easy-to-use graphic organizer maker

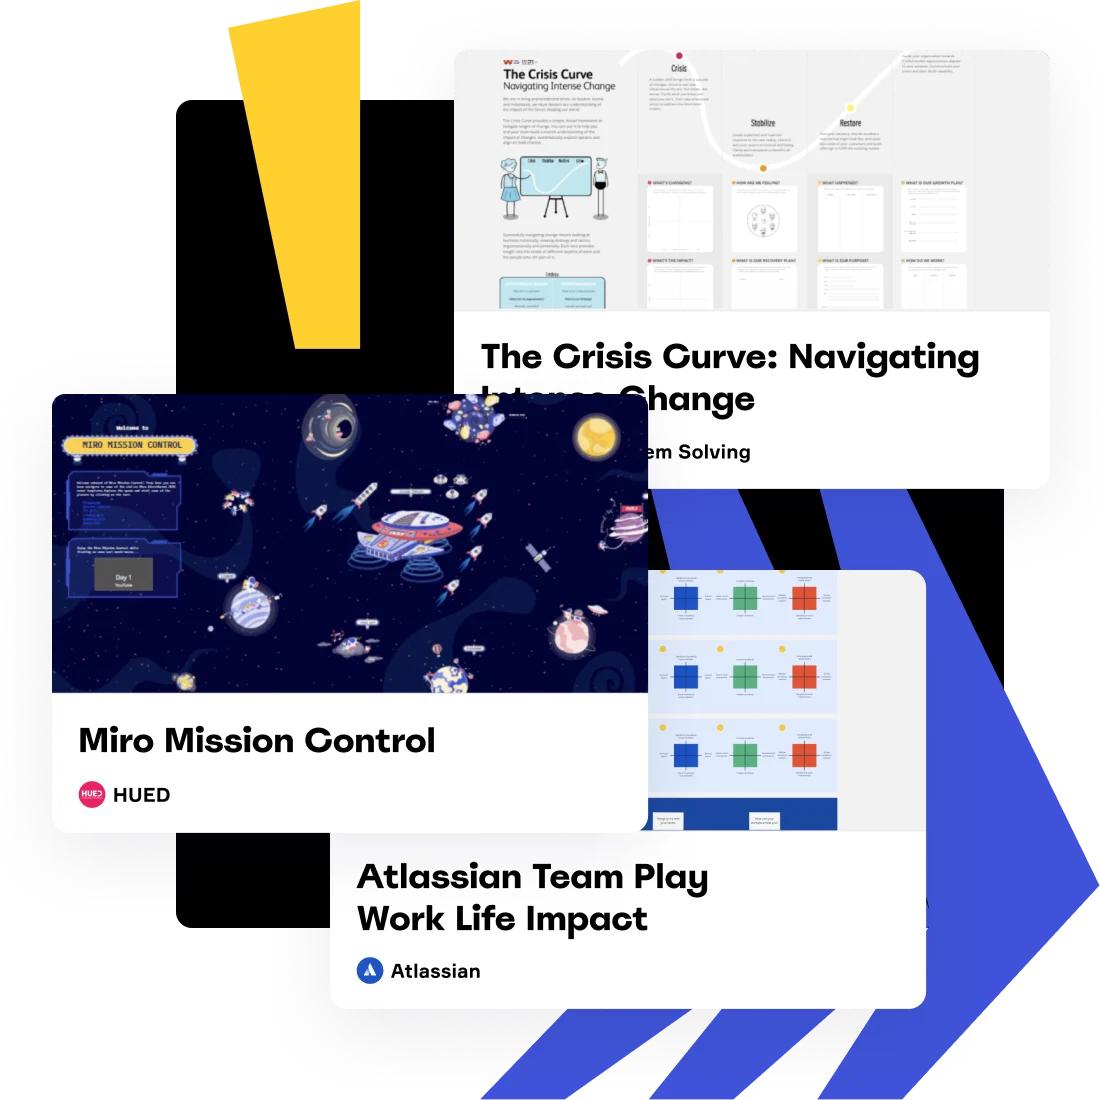
Create a graphic organizer in minutes with Miro’s infinite canvas. Get inspired by our extensive Templates Library, or browse our Miroverse community to create your graphic organizer.

Collaborate and co-create

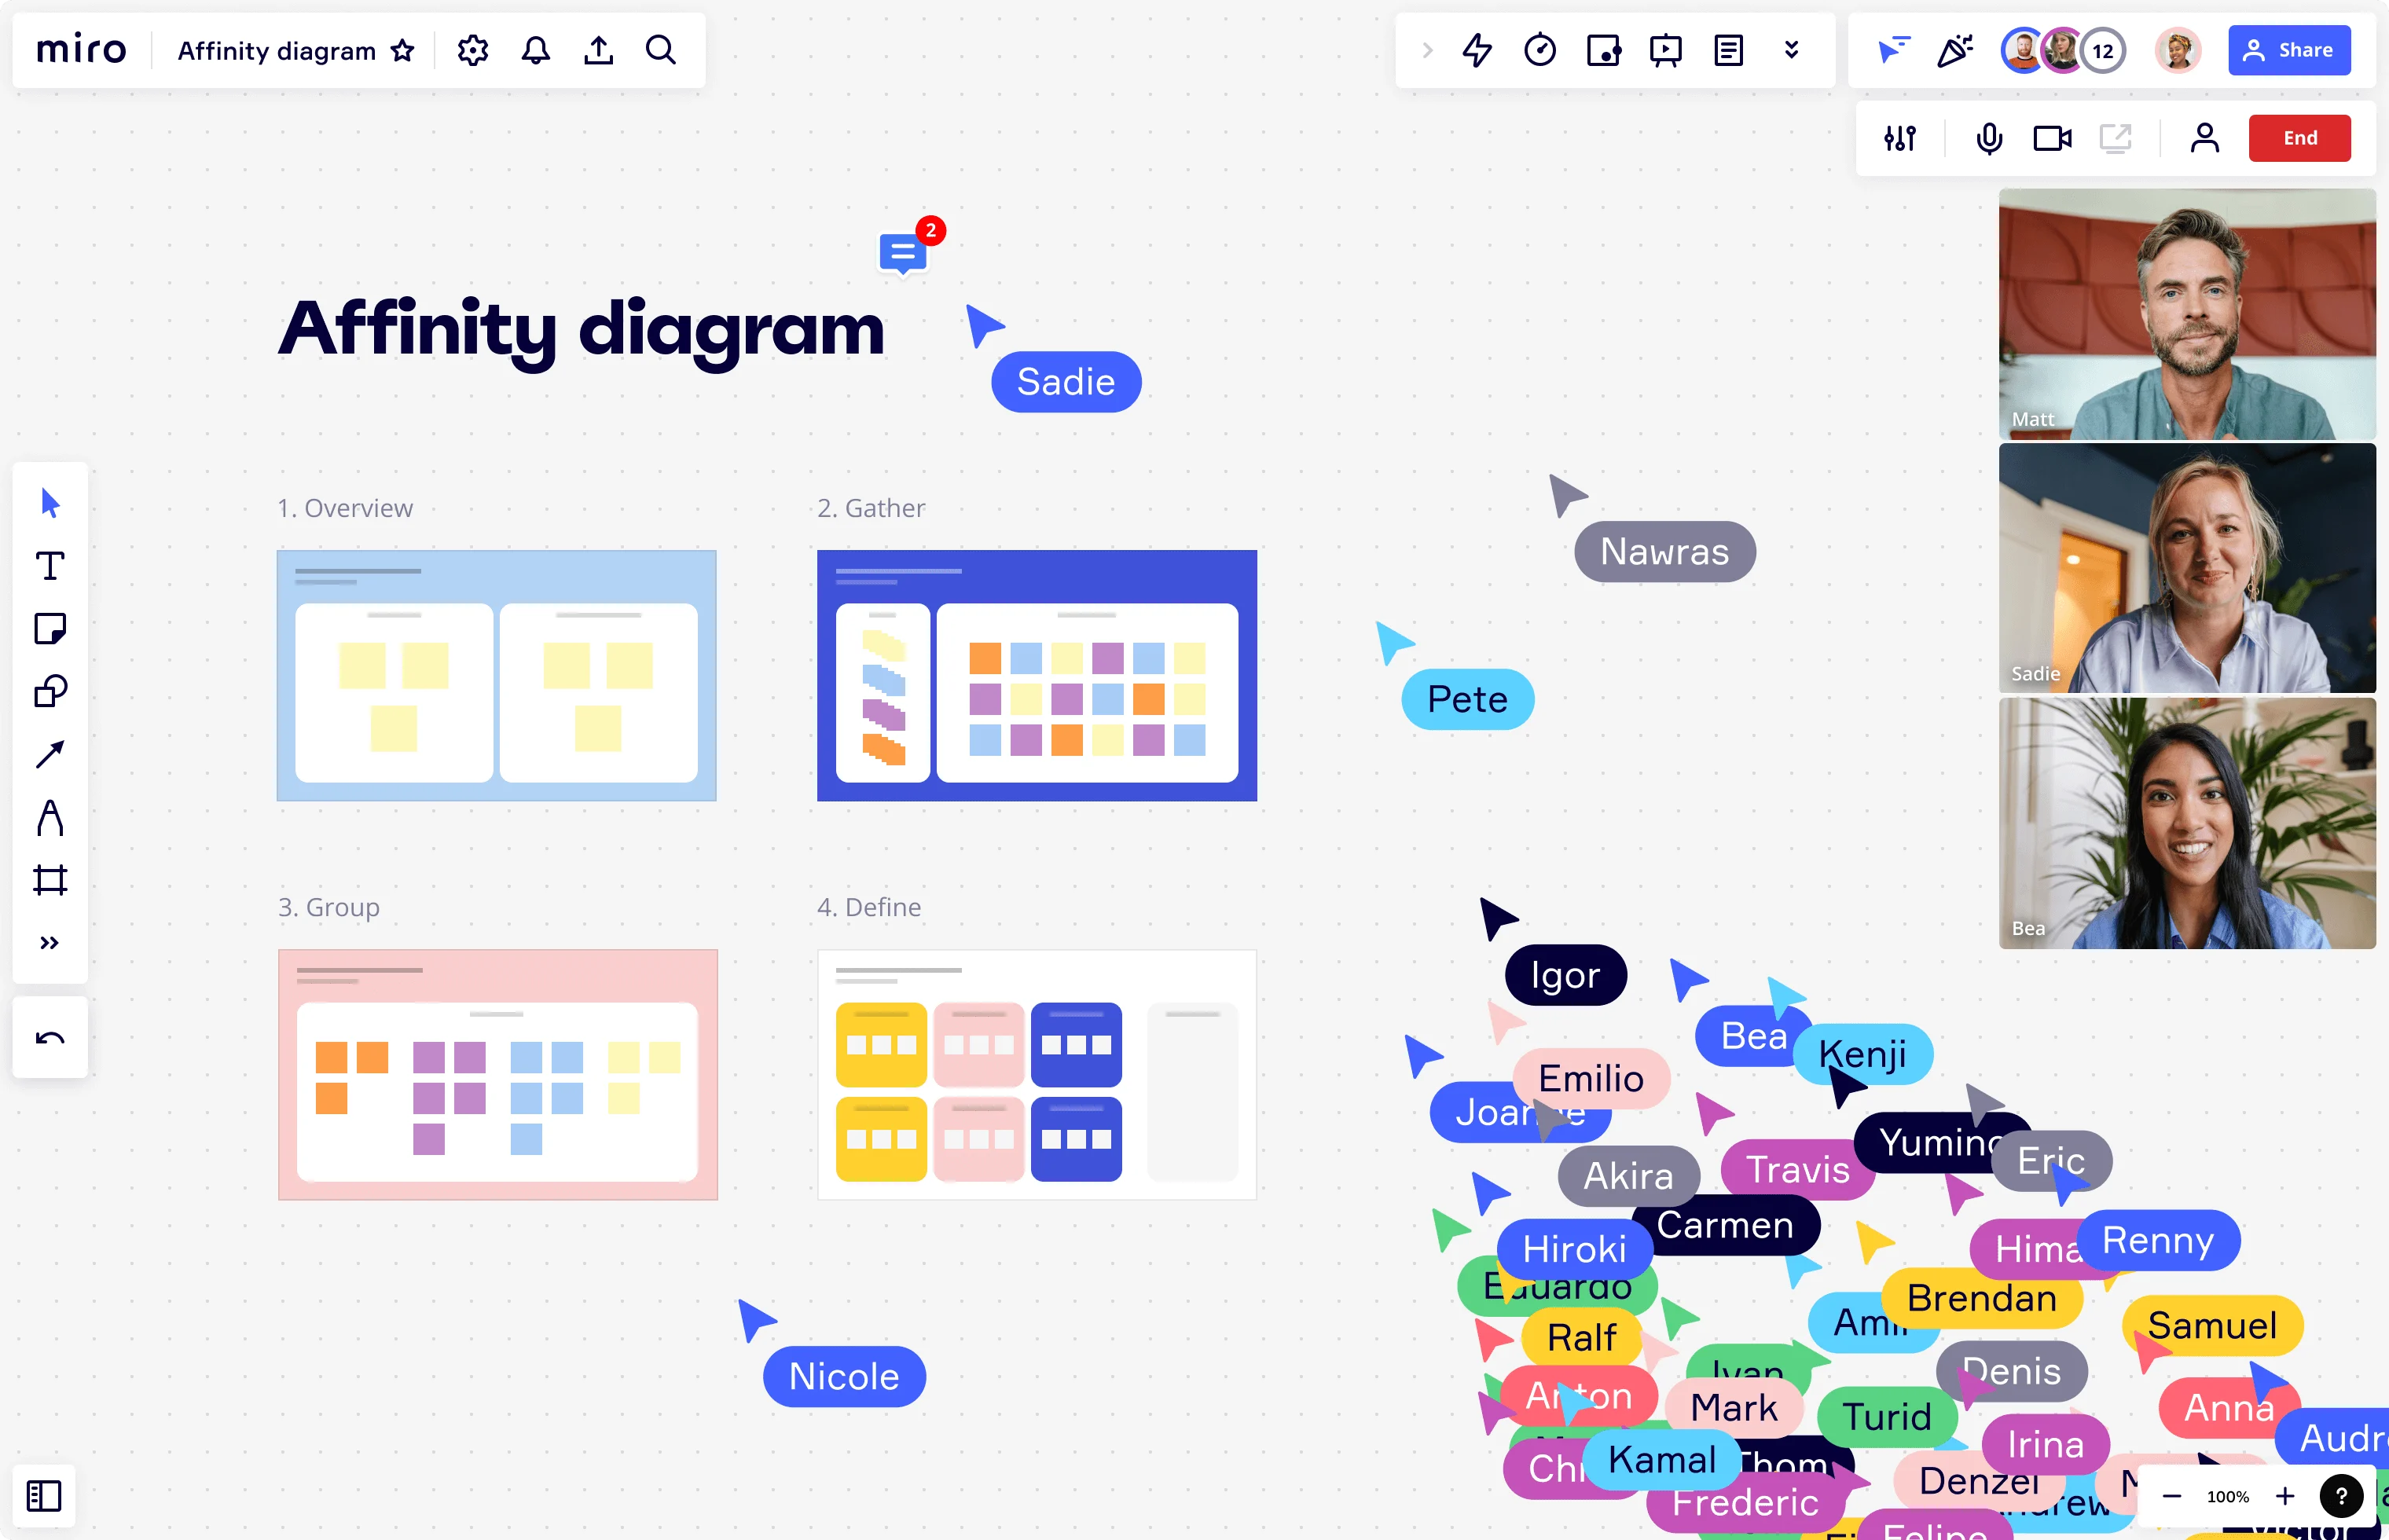
Invite everyone to co-create your graphic organizer with you. Tag them in comments, request instant feedback, and implement changes in real time or async. Iteration is much faster with Miro’s graphic organizer maker.

An online graphic organizer to share ideas

Brainstorm

Visualize ideas

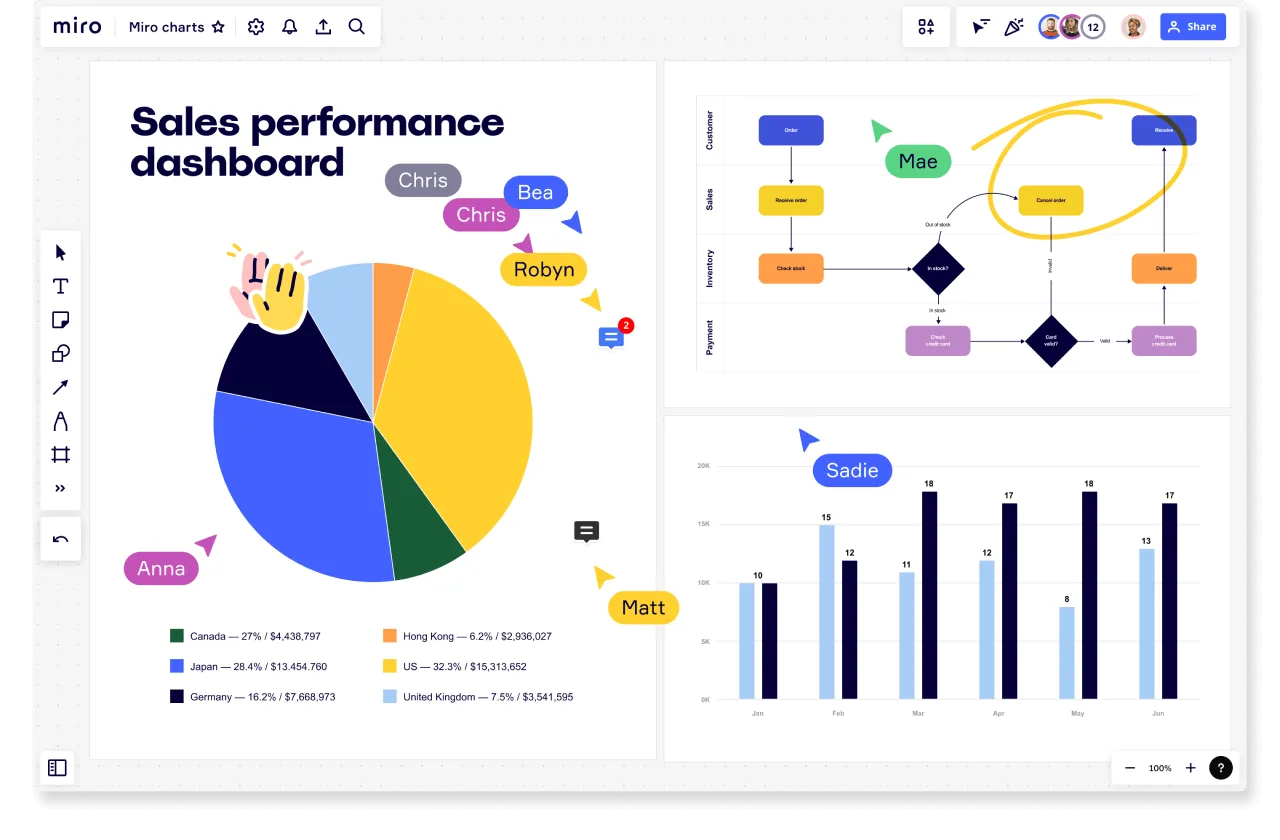
Once your graphic organizer is ready, it’s easy to visualize ideas and break down information so everyone understands the scope of their work. Improve communication and focus on what matters.
categorization

Make great presentations

Keep the momentum going with graphic organizers and easily visualize ideas on the board. Break down concepts, and arrange information in a way that is engaging.
papers

Quickly create a graphic organizer

Miro lets you create a graphic organizer fast, with no design experience needed. Use one of our ready-made templates or make one from scratch using our many editing tools.
collaboration

Improve decision-making

Circulate your graphic organizer with stakeholders and ensure information isn’t lost. Miro’s graphic organizer creator will always show the most up-to-date version, so everyone is on the same page.
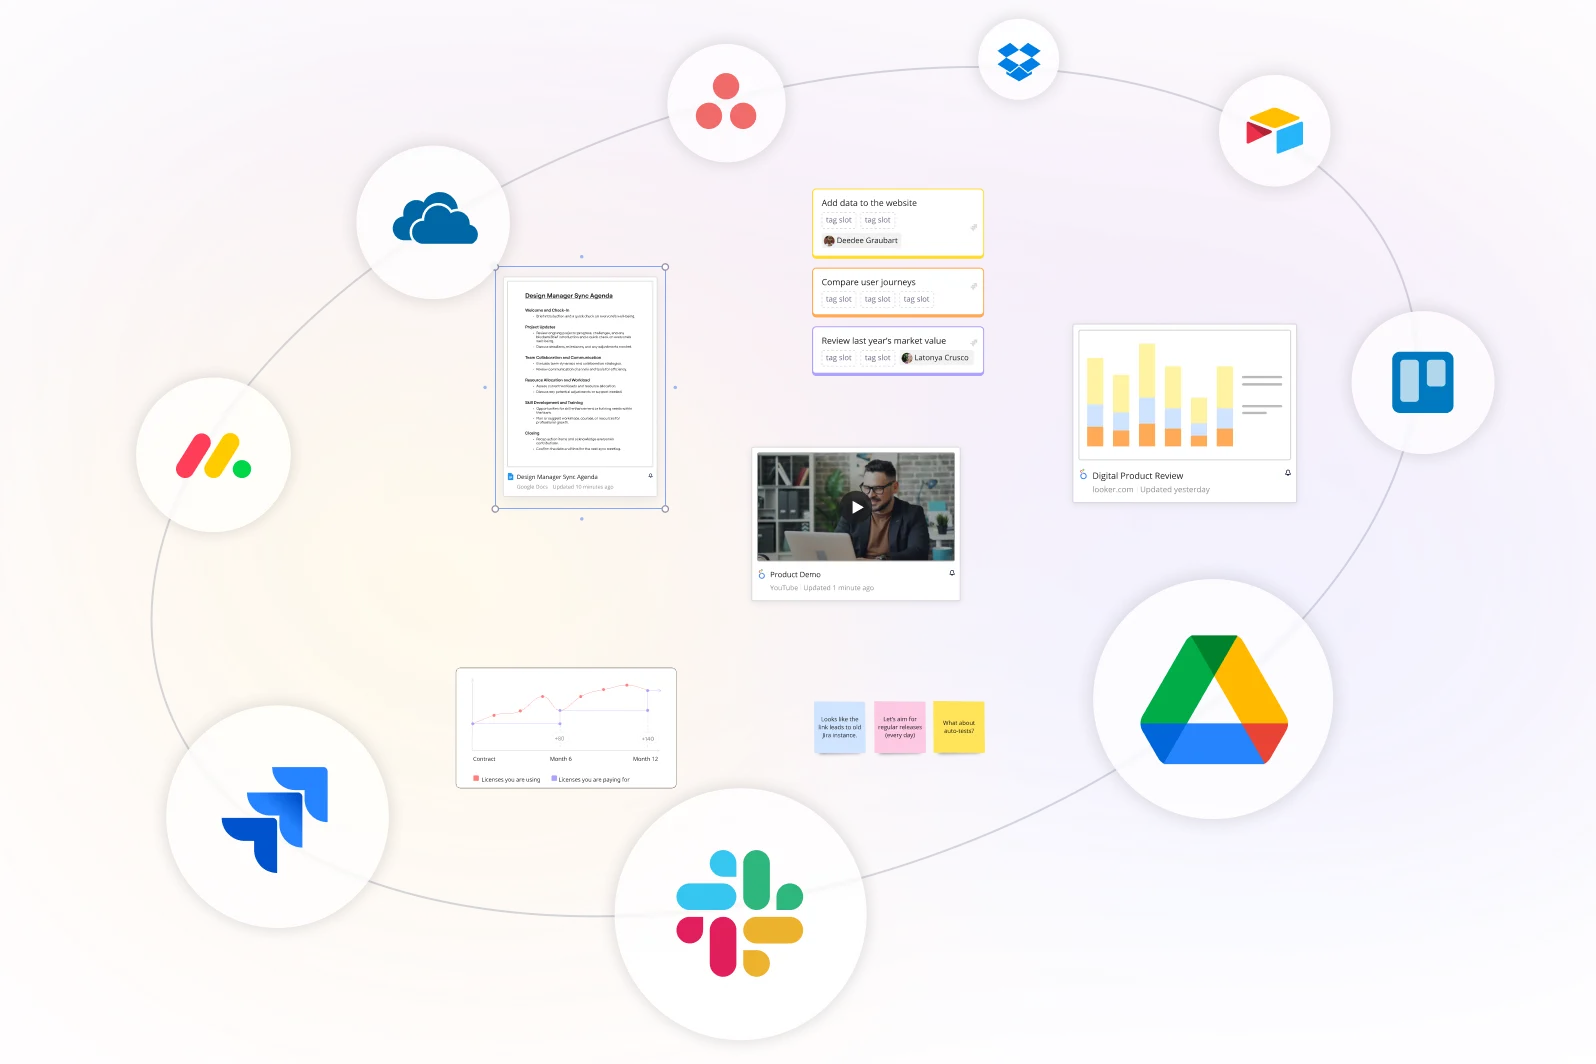
More than just a graphic organizer

Center collaboration in one visual, shared space. Miro’s graphic organizer maker helps teams to have more clarity and a better understanding of the relationships between different pieces of information, leading to stronger and more effective collaboration.

Related templates

How to create a graphic organizer with Miro

1. Choose your template

Get started by adding the template you want to have on your board. From concept maps to KWL charts, add the one that suits your needs.

2. Structure your graphic organizer

Customize the template, adding the information and concepts you find relevant. Use the context menu bar to change fonts, colors, and add labels. Arrange the elements in a hierarchy, a timeline, or any way that suits your needs.

3. Share ideas with one click

Invite everyone to your board or download your graphic organizer as an image or PDF. Add it to presentations and other Miro boards as you see fit.
See more in detail

Graphic organizer maker FAQs

motor cycle.png

Where can I create a graphic organizer?

Use a tool with features that help you design, structure, and share your graphic organizer. Depending on the complexity of the graphic organizer you need to create, you may need more control over the design and component's organization. Many online tools, including Miro, provide easy-to-use templates to create a graphic organizer. Whichever tool you choose, creating a graphic organizer is a great way to visualize your thoughts and ideas.

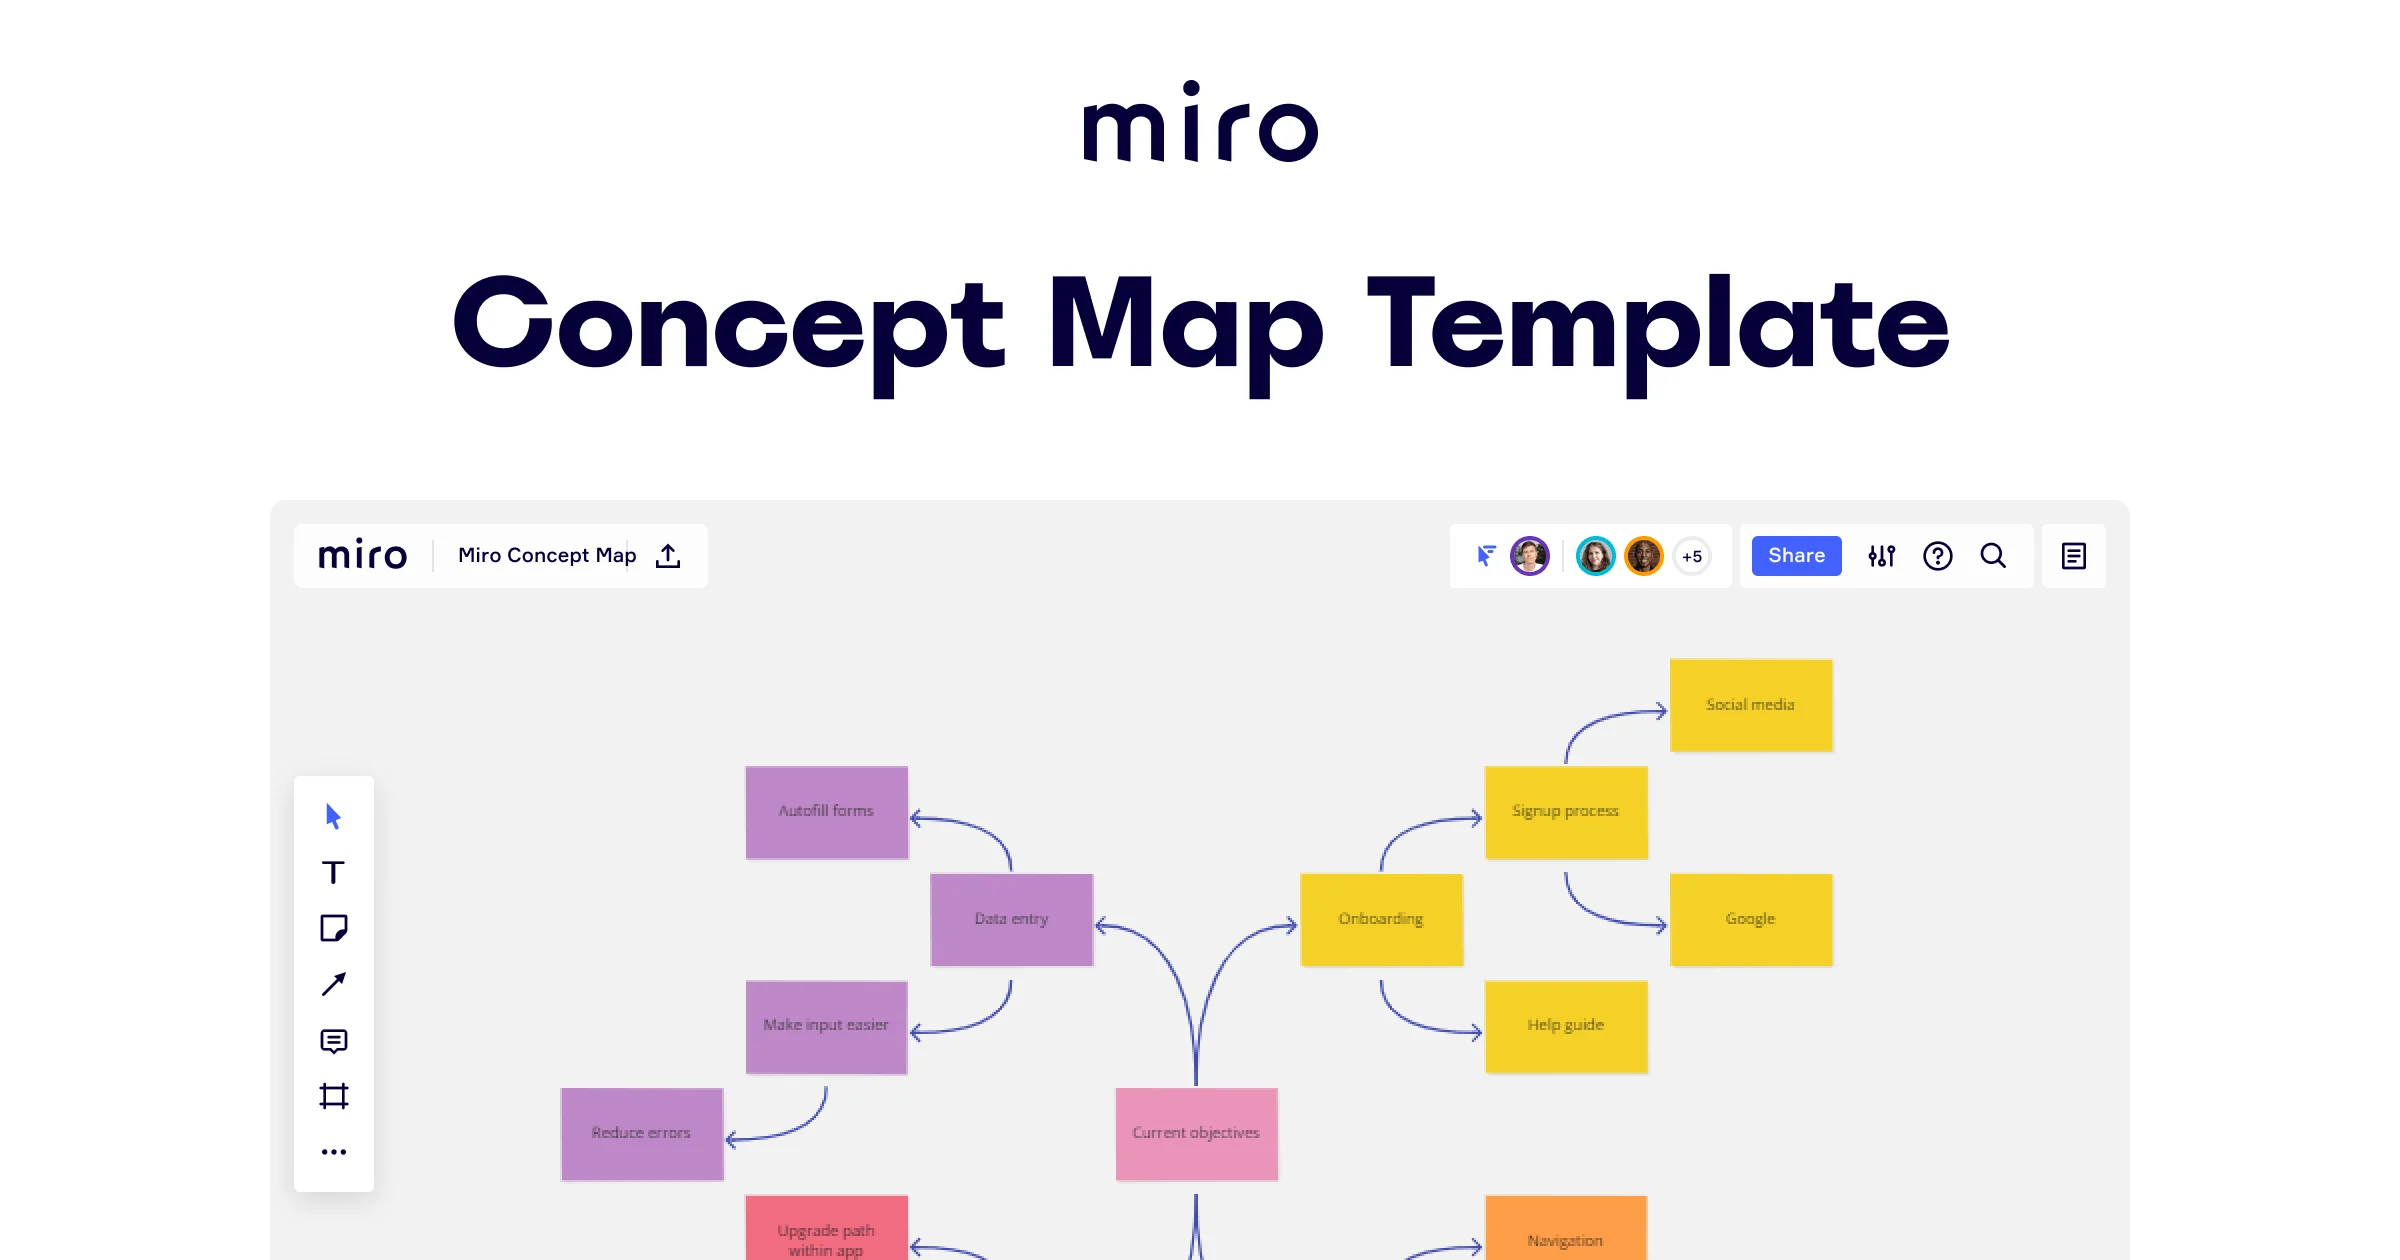
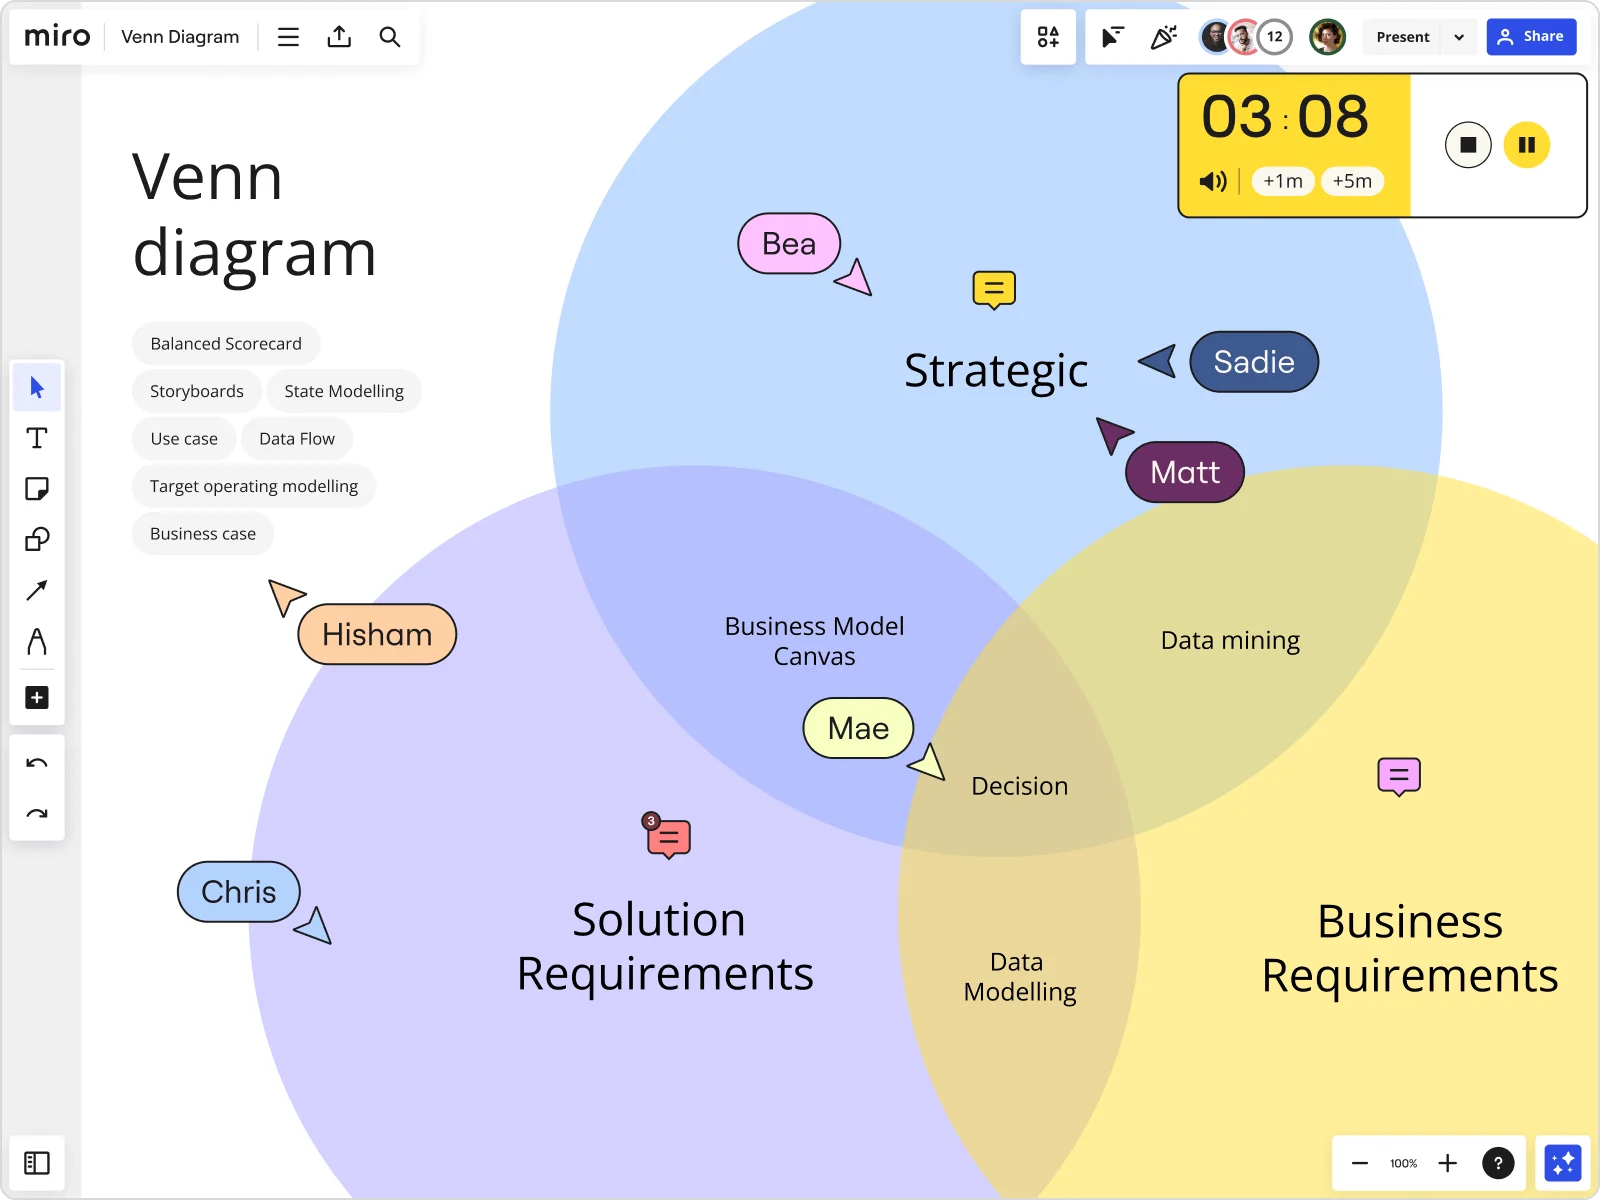
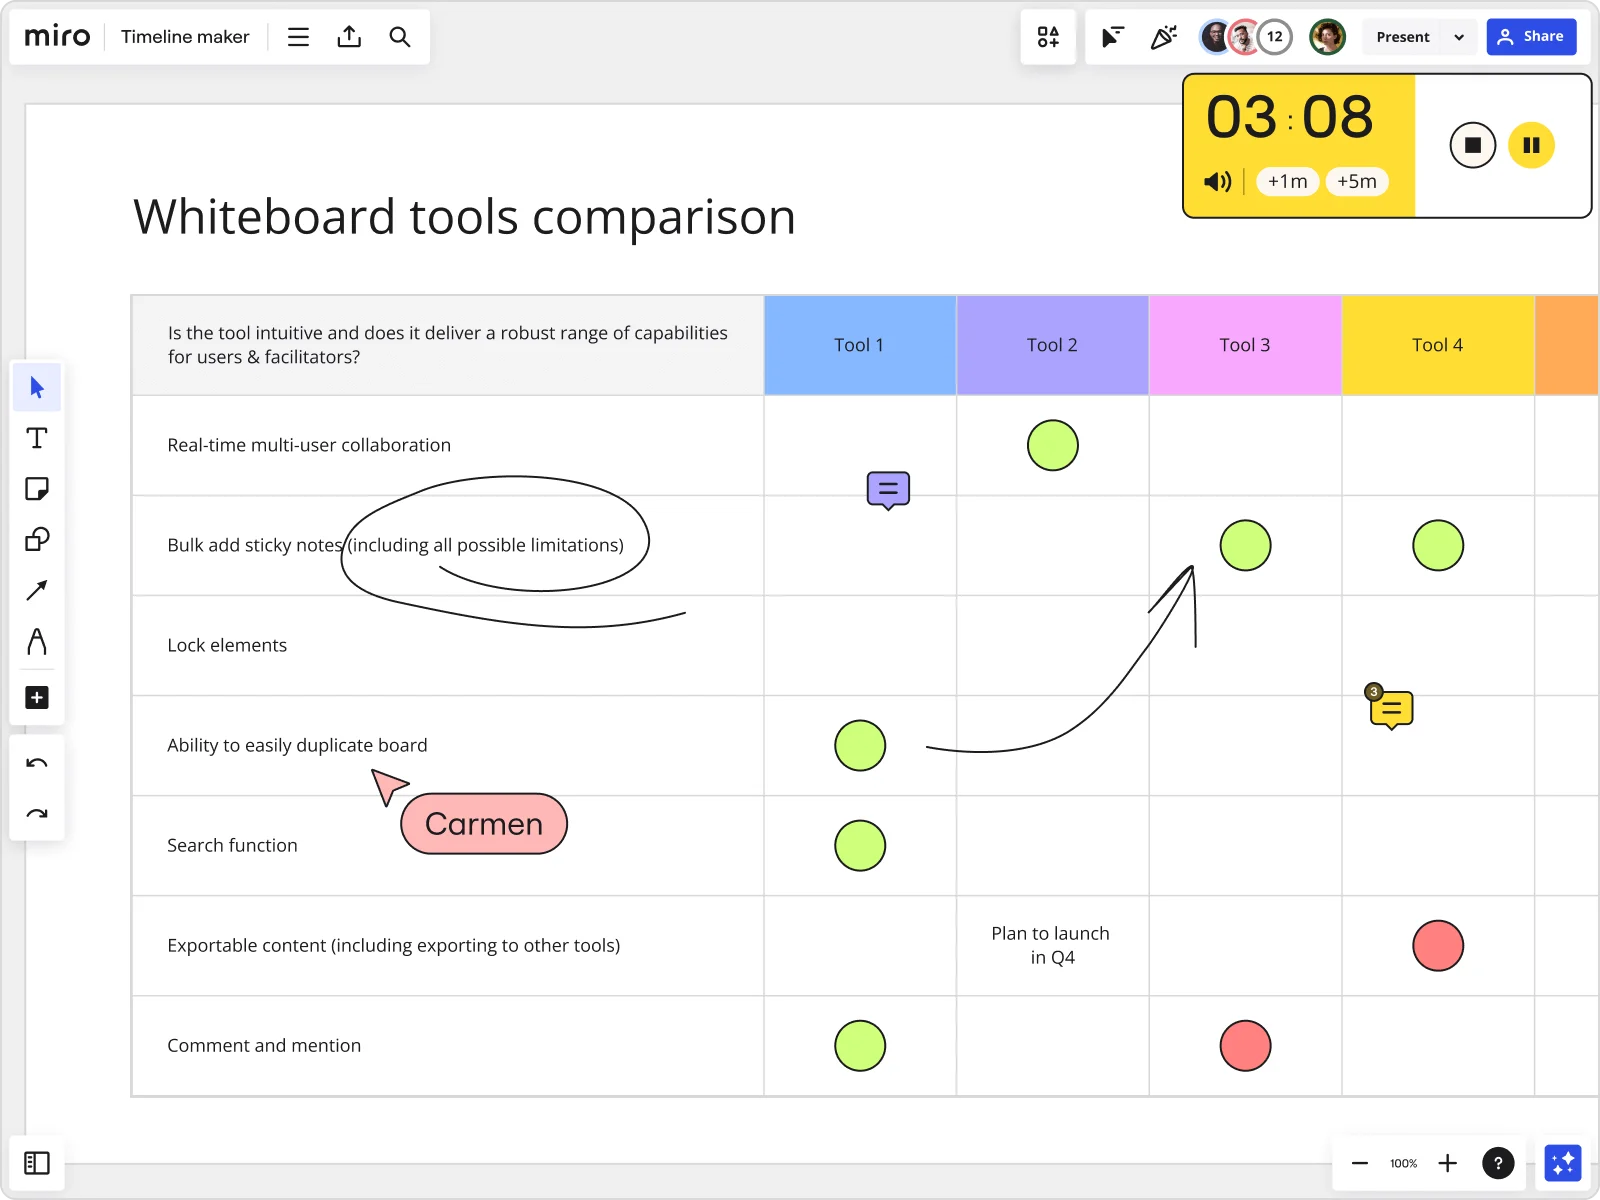
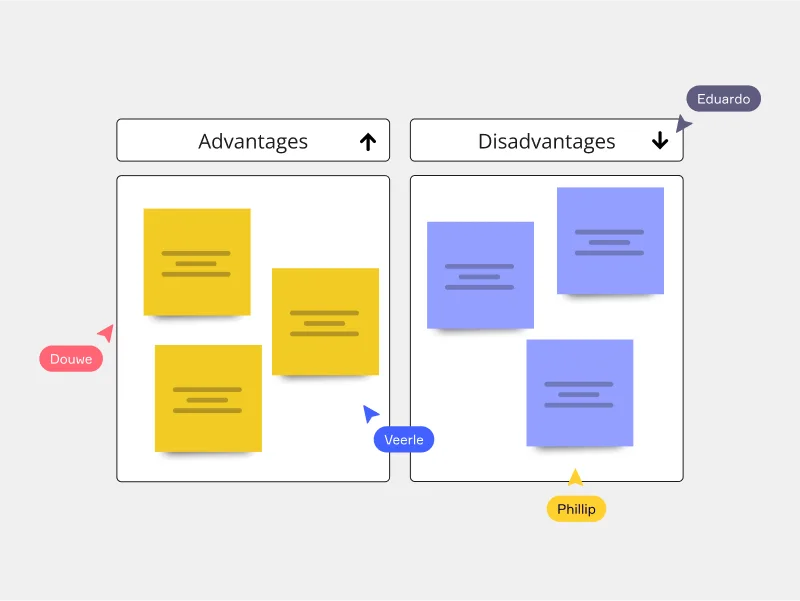
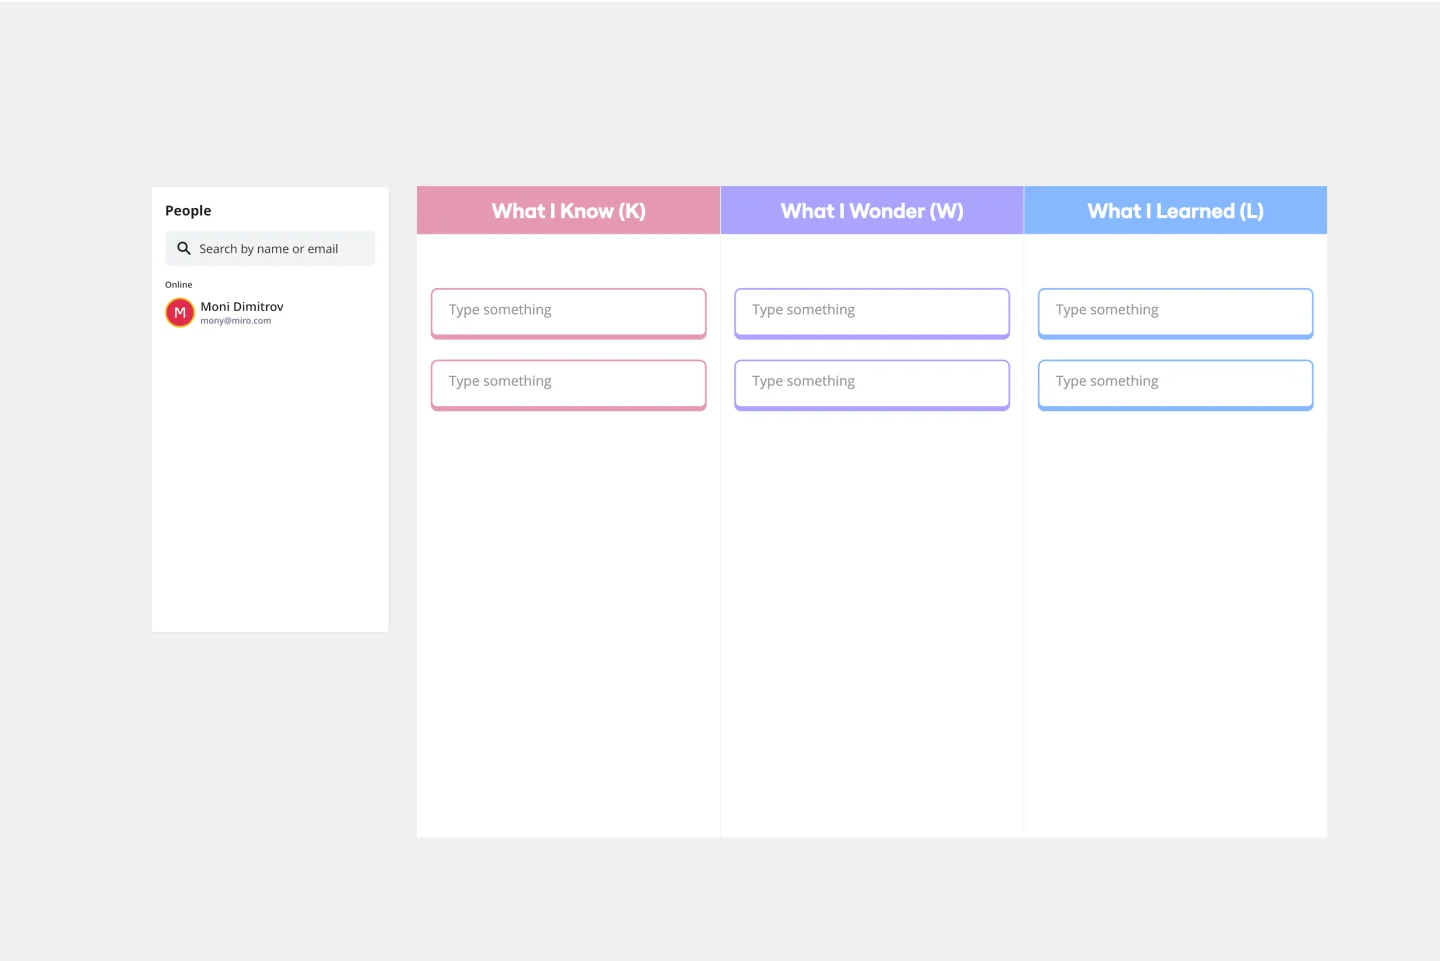
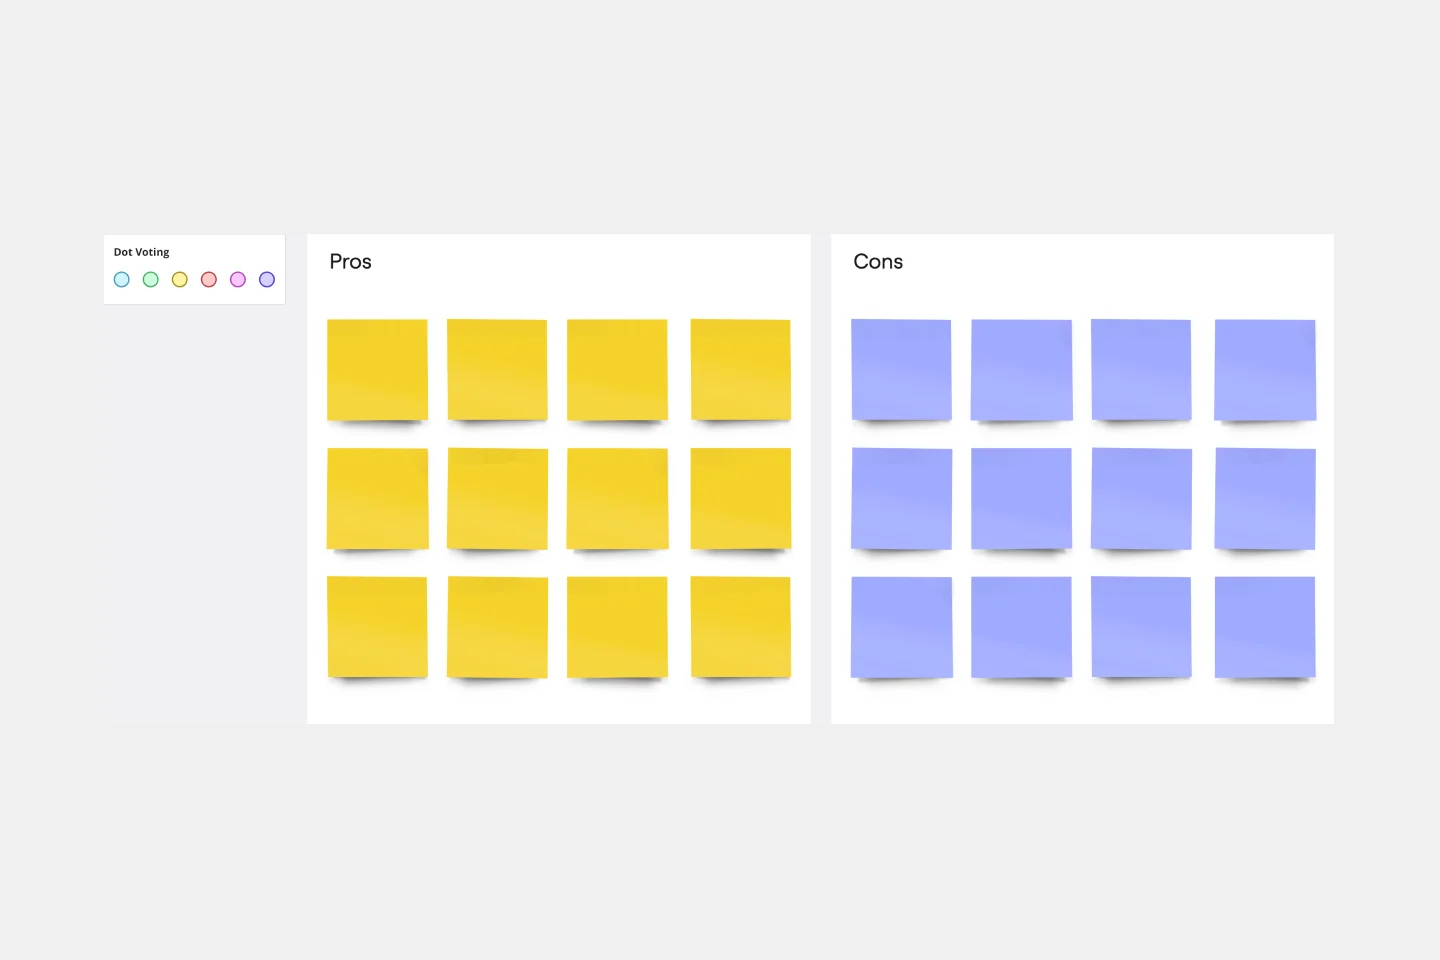
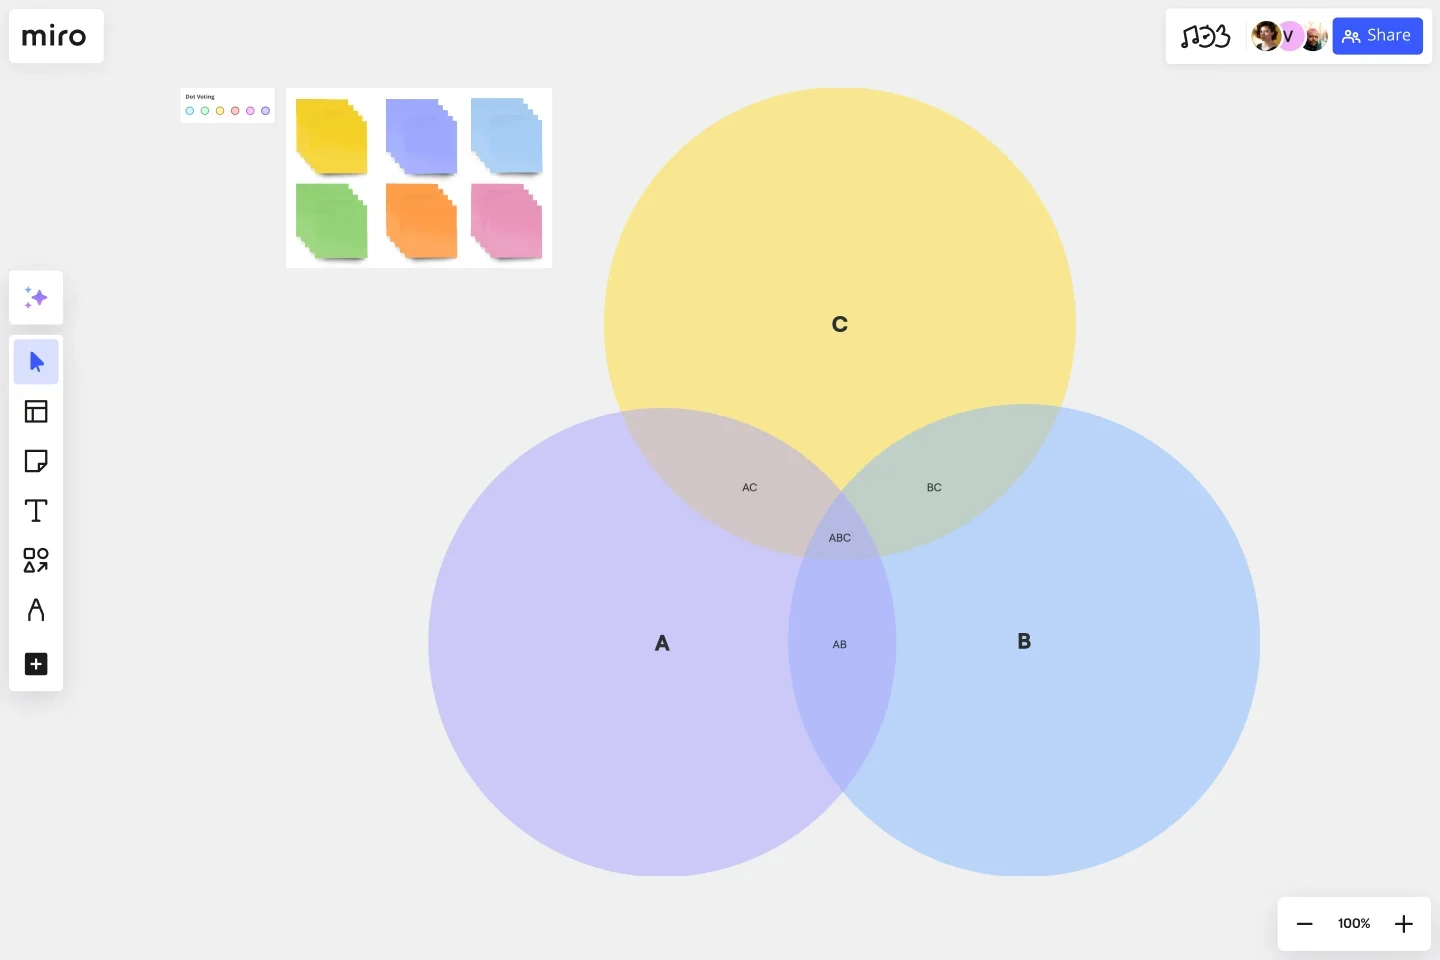
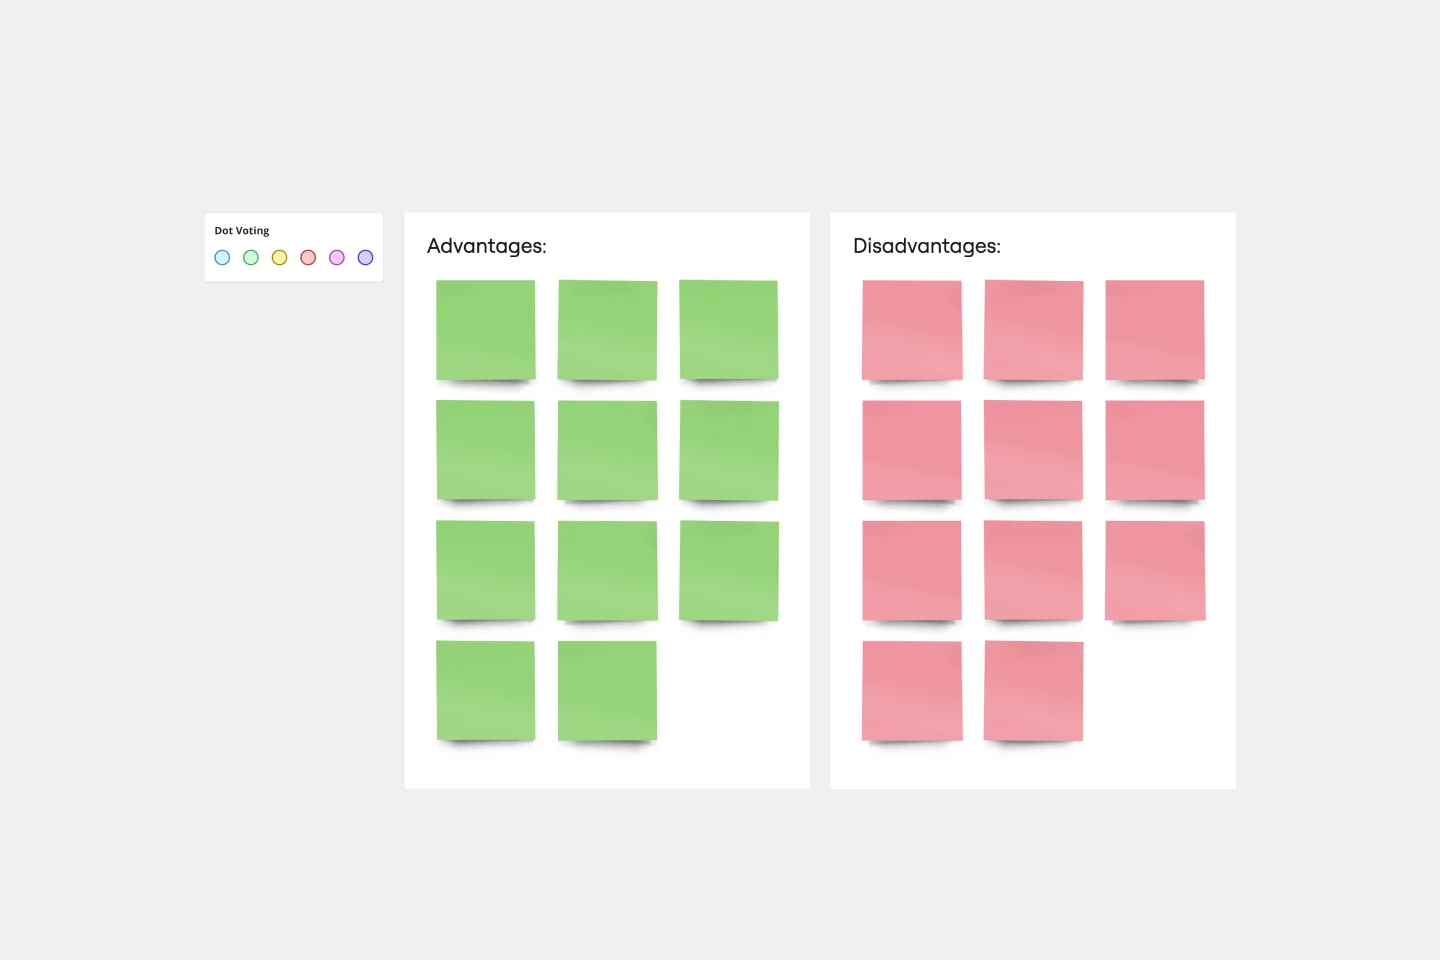
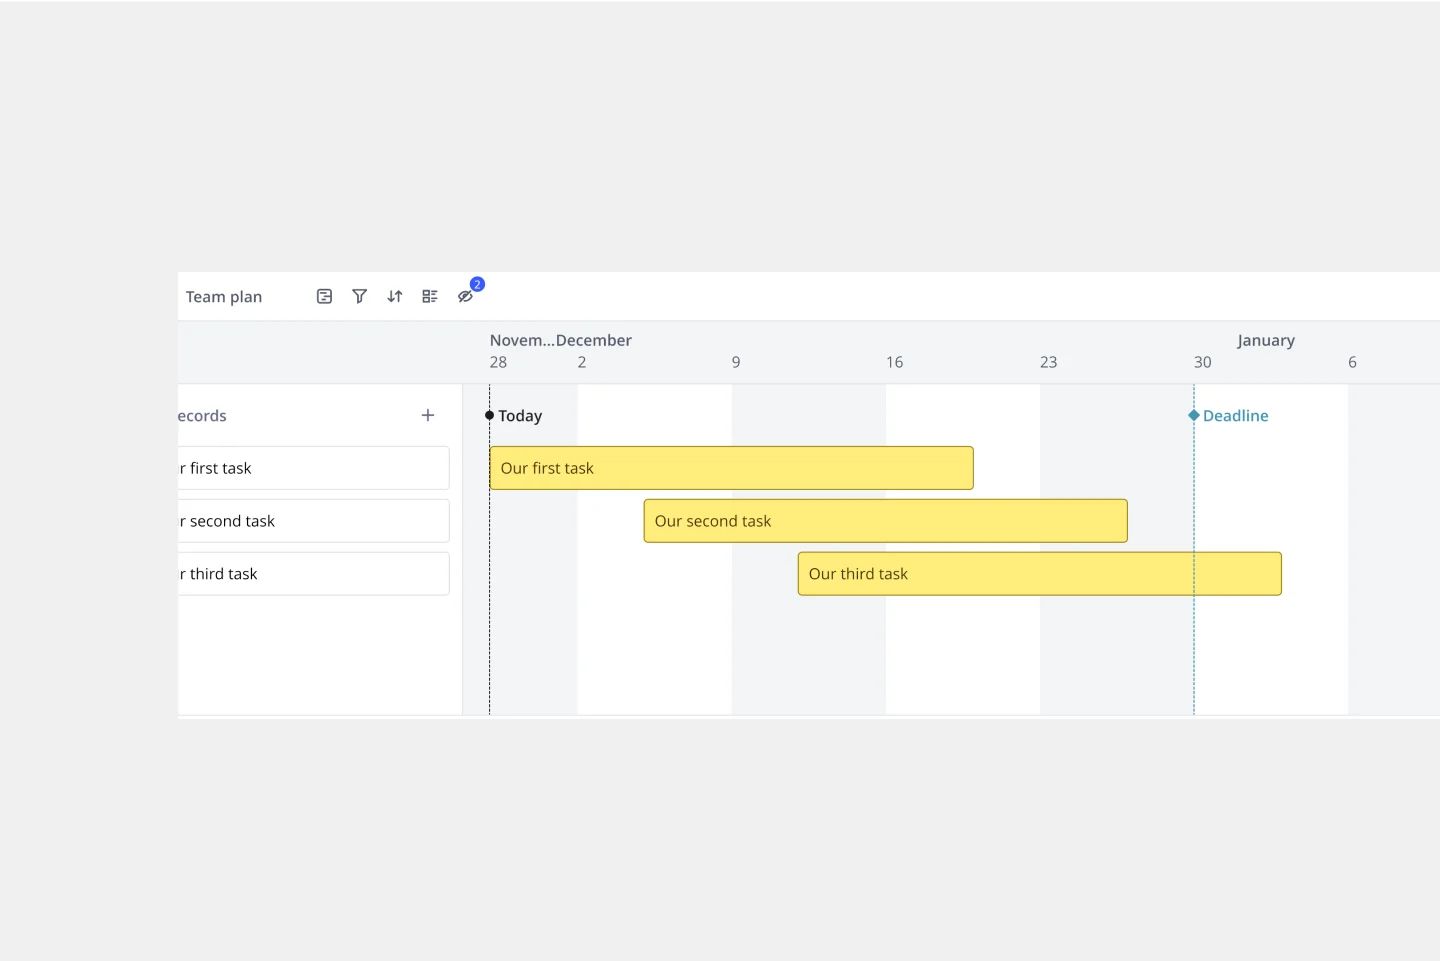
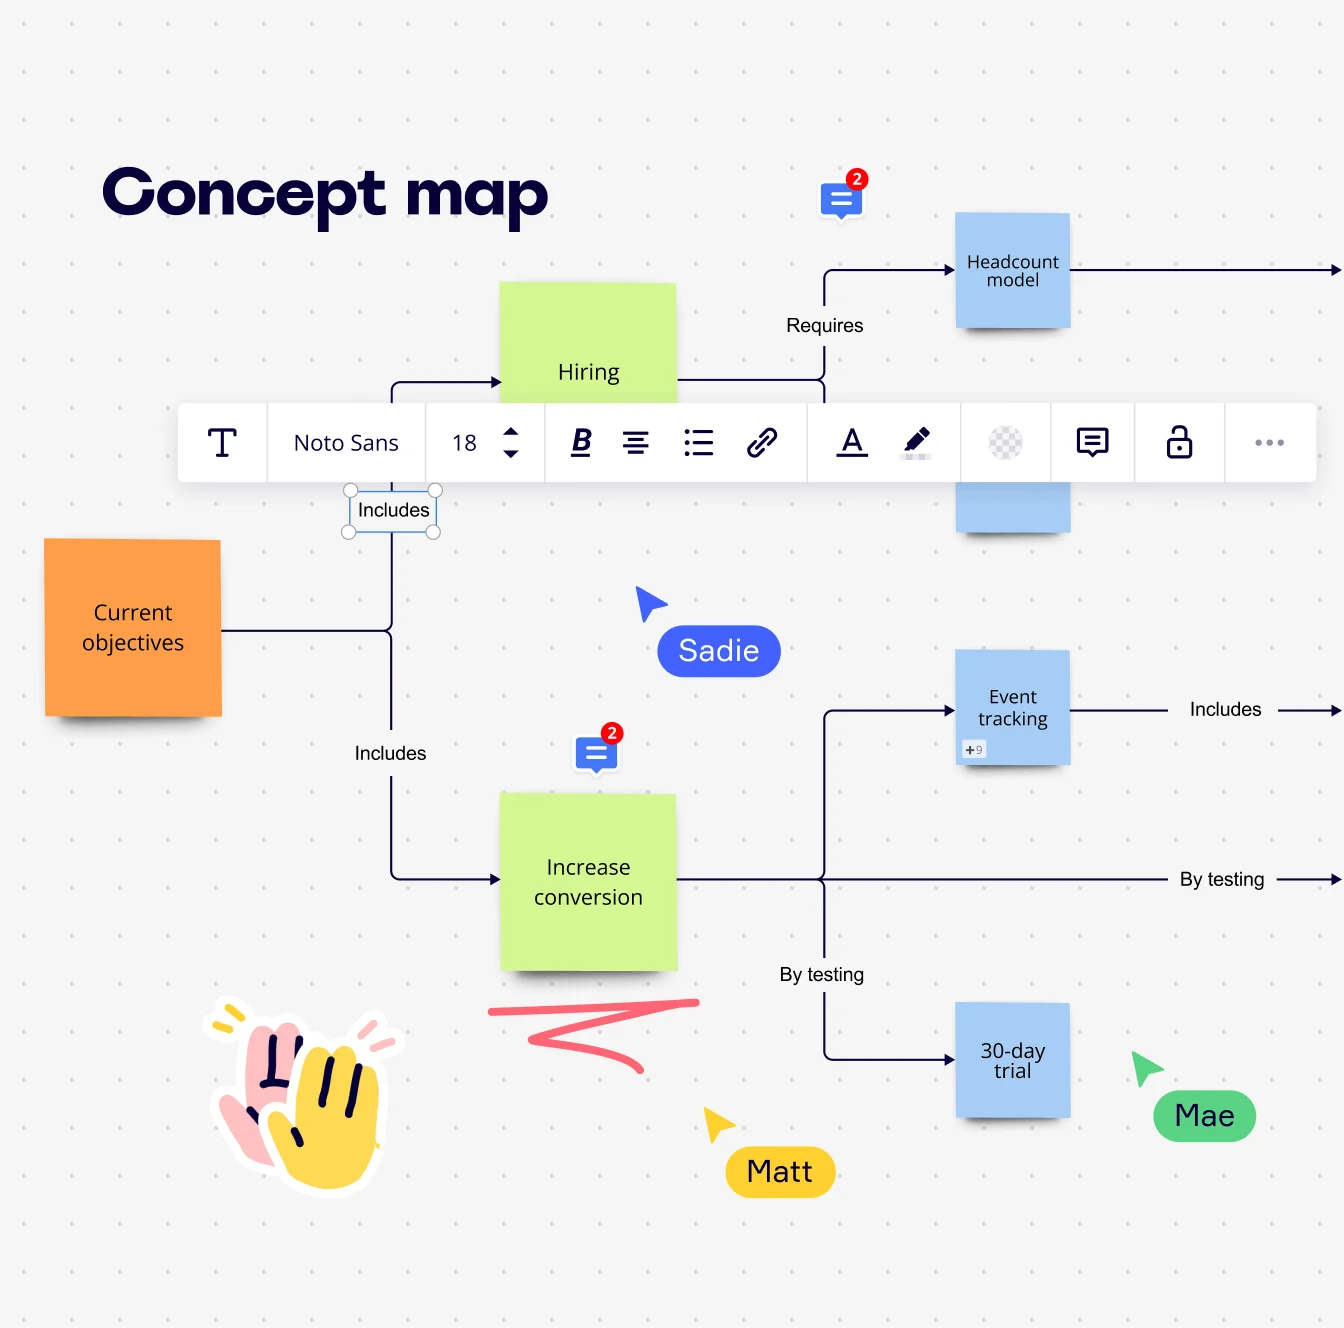
What are the five most commonly used graphic organizers?

The five most popular types are: Venn diagrams, concept maps, T-charts, and timelines. Venn diagrams are useful for comparing and contrasting two or more ideas or concepts. Concept maps are a visual representation of relationships between ideas. T-charts are used to compare two items or ideas. Timelines provide a visual representation of events in chronological order.

Get on board in seconds

Join thousands of teams using Miro to do their best work yet.
accenture.svgbumble.svgdelloite.svgdocusign.svgcontentful.svgasos.svgpepsico.svghanes.svghewlett packard.svgdropbox.svgmacys.svgliberty mutual.svgtotal.svgwhirlpool.svgubisoft.svgyamaha.svgwp engine.svg